

Introduction
Among nuclear facilities, some of facilities intimately related with internal exposures should calculate doses of internal exposures for routine or accident. The internal exposure dose is summed with the external exposure dose and managed as a permanent exposure records [1].
The internal dose assessment can be divided into two steps. Firstly, it is the step of directly or indirectly measuring the intake of the radionuclide. The second step is the dose assessment using the intake calculated from the measurement results [2]. In particular, analysis results of bioassay data of the worker that intakes radionuclide are subject to considerable uncertainty depending on the physicochemical characteristics of the radioactive material, assumptions on ingestion, capabilities of assessor, dose assessment software, anatomical and physiological factors of individual and dose assessment methods [3]. Accordingly, even in the same internal exposure scenario, the evaluation of the dose by the assessors causes considerable variation.
To reduce these variations, The International Organization for Standardization (ISO) suggest international standards for dose assessment for internal exposure monitoring though ISO 27048, which provides to demonstrate regulatory compliance reliability and to provide minimum requirements for worker monitoring data evaluation [4]. The European Union and the International Atomic Energy Agency have also conducted joint studies to develop systematic procedures and developed the IDEAS General Guidelines [5].
On the other hand, in the case of domestic internal exposure dose evaluation, it is difficult to obtain the accuracy and reliability of dose evaluation for the measurement data because the relevant technology in Korea is very weak and not institutionalized.
For this reason, the internal exposure scenarios were developed to acquire quality control of the internal exposure dose evaluation system in Korea. Seven cases on internal exposures incidents that have occurred or may occur were prepared by referring to the scenario of intercomparison exercise that NRC and IAEA have carried out. These scenarios cover exposure that can occur in workplaces involving a variety of nuclides and address various pathways as well as single and multiple intake patterns [6, 7].
Based on this, 16 nuclear facilities concerned with internal exposure in Korea were asked to evaluate the scenarios. And the results of dose assessors at each nuclear facility were compared. The purpose of this activity was to determine the harmonization of the dose assessment results calculated by each participant. Concretely, we compare different approaches in interpreting internal contamination monitoring data for each scenario, identify the effect of input parameter values on the results, and also conducted a discussion to satisfy the uniformity of the dose evaluation procedure through information exchange [8].
Materials and Methods
1. Case descriptions
In the scenarios, the internal exposures of iodine and cobalt that can occur in light water reactors, the internal contamination of the tritium that can occur in the heavy water reactor, and the possible uranium ingestion in the nuclear fuel cycle business were assumed.
1) Case 1: 131I inhalation incident during planned preventive maintenance
The worker carried out the opening of the reactor system during the planned preventive maintenance period near the reactor system. The respiratory protection equipment was not worn at that time and the status of the incident is shown in Table 1.
The radiation monitors in the reactor building before the reactor system opened showed normal values. The chemical form of iodine was element iodine. Table 2 shows the results of the whole body measurement for the worker by using whole-body counter (WBC).
2) Case 2: 60Co internal contamination as determined by routine monitoring
Initial contamination of worker A was detected through routine monitoring, and then additional measurements were performed 3 times. The chemical form of 60Co was cobalt oxide, and the results of whole body radioactivity measurements were shown in Table 3.
Because the periodic examination is one year, interviews were conducted to infer the time of ingestion. The contents according to that are summarized in Table 4.
3) Case 3: 60Co contamination in two workplaces where the radiation environment is different
The same radiation worker performed decontamination work at two workplaces in different radiation environments at different periods. After completion of the work, it was judged that internal exposure occurred as a result of radioactivity measurement. As a result of the investigation, it was estimated that radioactive dust was scattered during the work process. The measurements of the whole body radioactivity and the known information are summarized in Table 5.
4) Case 4: Tritium internal exposure during thermometer/flow meter calibration
Worker B performed the work in a tritium-contaminated radiation management area (February 2, 2017 10:50–11:10). Internal exposure occurred when the radioactivity was not measured due to malfunction of the air pollution monitor. The chemical form of the tritium is tritiated water, and the urine measurement results are shown in Table 6.
5) Case 5: Internal exposure of tritium during the O/H (Over Haul)
Worker C performed the work in the radiation controlled area during the heavy water reactor O/H period (May 2–9, 2017). The urine were sampled before the start of the work, two weeks after the start of the work, and at the end of the work. There was no perceptible event about tritium internal exposure during the work, but a high concentration of tritium was detected in the urine samples submitted. The chemical form of ingested tritium is tritiated water, and the results of urine measurements are shown in Table 7.
6) Case 6: UF6 internal exposure during cylinder replacement
On April 19, 2017 at 9:00 AM, as gas leaked during the cylinder replacement operation, internal exposure occurred to a worker. The concentration of uranium is 2.2%, and three data of lung monitoring and three data of radioactivity concentration for uranium isotopes in urine of the worker are shown in Table 8.
7) Case 7: UO2 internal exposure during solidification experiments on lime deposits
On January 9 in 2017 a liquefied solidifying agent flowed back during the solidification of the lime deposit containing uranium, causing a precipitate to bounce. Therefore, measurement by using a lung counter and the urine sample measurement were performed, and the results are shown in Table 9. The chemical form of uranium is UO2, and the worker began to work again on April 1 in 2017. This worker should have considered the previous dose because it was previously determined that there was an internal exposure (Table 10).
2. Participants
Each result that participants assessed was given a two-letter and number Identification Code. In Case 4 and Case 5, participants performed dose assessments in various methods and each method was also given as ‘-number’ (Table 11). Participants who evaluated each scenario are practitioners of the dose assessment of the institutions involved in the case. The number of participants and evaluation methods is shown in Table 11.
Participants were asked to submit the evaluation factors and information on intake they assumed, and estimated intakes and committed effective dose (CED) also (Table 12). For the convenience, an answer sheet in the form of an excel sheet was provided to participants in order to select the factors needed to calculate the intake and CED.
Meanwhile, some participants explained the evaluation method in detail and made it easier to analyze, but some participants did not. In addition, they were excluded from the statistical procedure for intercomparison if they did not provide the basic evaluation factors to be provided.
3. Evaluation of Harmonization
The procedures usually adopted to identify the presence of outliers in a set of results are based on the hypothesis that all the data are pertaining to a defined statistical distribution [1]. The distribution of results for the dose assessment is lognormal. The discrimination of outliers is to see if the results are included in the assumed statistical distribution, not to identify the wrong data. That is used as a tool to determine which evaluation factors distorted it because it is inconsistent with other results when data are not included in the statistical distribution [6]. The outlier discrimination was followed by an outlier identification procedure based on the IAEA/IDEAS intercomparison [1].
Using results (Xi) calculated, Calculate the best estimate of the geometric mean (GM) and geometric standard deviation (GSD) for the lognormal distribution.
-
Using the values obtained above, calculate the following equation to determine the z value.
Identify all results that the z value is greater than or less than 2.5. (98.8% confidence interval). This value is determined to be ‘outliers’ and excluded from the final statistical evaluation.
Repeat the above steps until the outliers is removed.
Results
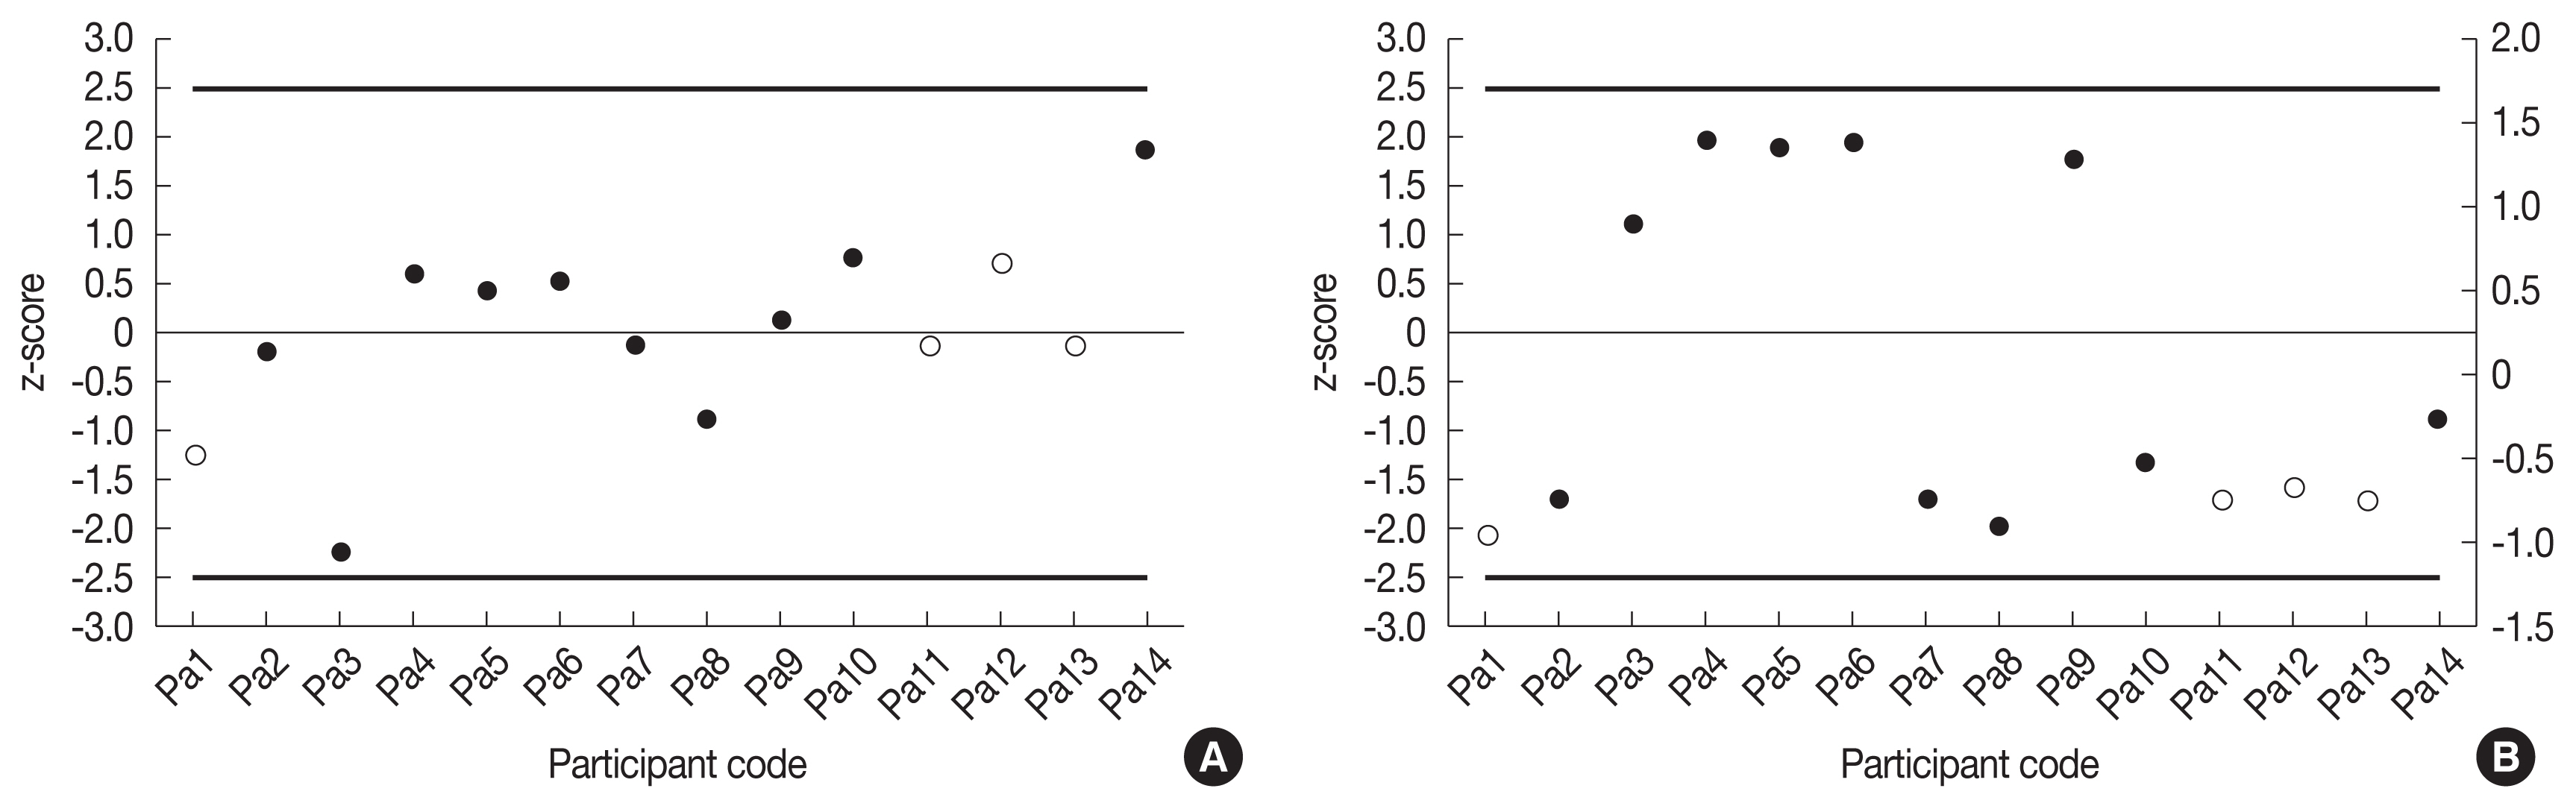
1. Case 1
As a result of discrimination of the harmonization, the intake and the CED evaluated by each facility were not selected as outliers (Figure 1). Although four of the evaluators were included in the distribution according to values of the Intake and the CED, the assessment factors were not submitted. They were marked as empty. Because Pa1 did not submit a period for chronic intake and Pa11, Pa12, and Pa13 did not indicate the absorption type or solubility, it was not known how they were evaluated.
The geometric mean, geometric standard deviation, coefficient of variation and ratio of maximum and minimum by participants are summarized in Table 13. In this scenario, the cause of the spreading of the results is due to the assumption of the absorption type and the selective use of measurement data. ICRP Publication 78 recommends that the solubility grade of the iodine element, whose physicochemical form is gas or vapor, is SR-1 [10]. Nonetheless, some participants assumed that the element iodine is a particle and behaved as the type F. Selective use of multiple measurement data does not have a significant impact (around 5%), but assumptions for absorption type show a somewhat greater effect due to differences in retention function and dose coefficient. The average intake calculated by participants using type F was a factor of 1.72 greater than the average intake assumed for SR-1. In addition, although some participants assumed that the solubility grade was SR-1, misapplication of the retention function and dose coefficient for the absorption form F during the dose assessment process resulted in various values.
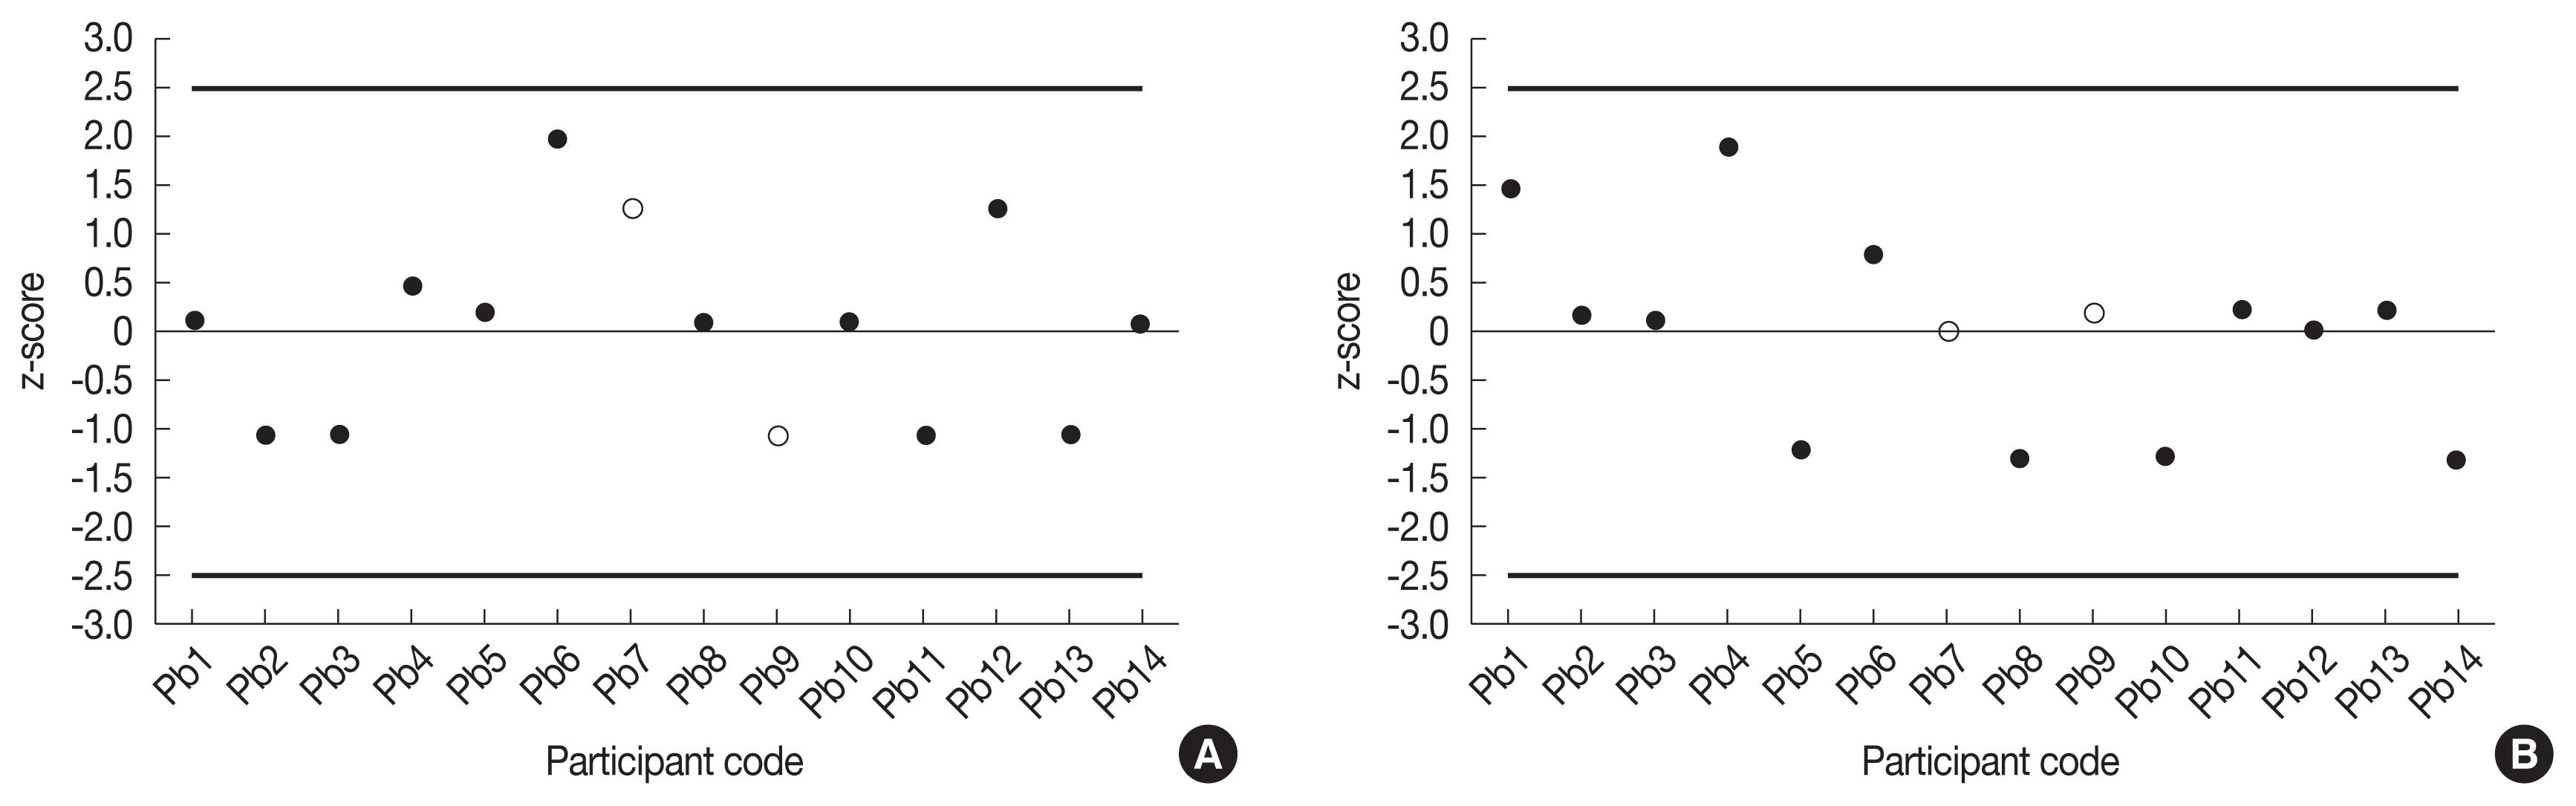
2. Case 2
As a result of discrimination of the harmonization, the Intake and the CED assessed by each assessor were not selected as outliers (Figure 2). Z scores of the Intake and the CED for 2 participants were marked as empty circle because they did not transmit accurate information. In the case of Pb9, it was not known how the absorption type was evaluated because both the particles (Type S) and gas (SR-1) submitted the selected answer. In fact, in the case of cobalt, there exist only M and S types of absorption type. Pb7 did not submit anything such as solubility, absorption type and particle size among the assessment factors.
The reason for wide distribution for results of the intake value is because the participants assumed various intake points. There may also be a cause for diversity in assumptions of absorption types (M, S). ICRP Publication 119 recommends Type S for cobalt oxide [11]. Nevertheless, some participants assumed type M. The amount of radioactive material that reaches the body fluid varies depending on absorption type because it affects the removal or absorption rate of each organ. The reason that the CED were calculated differently is also assumed to be due to the difference in the number of dosimetry and the residual rate of Type M and Type S in the assumption of the intake date and the absorption type.
It is also considered that the reason why the CED values are calculated differently is due to the difference in dose coefficient and the retention function depending on the absorption type and the assumed intake date.
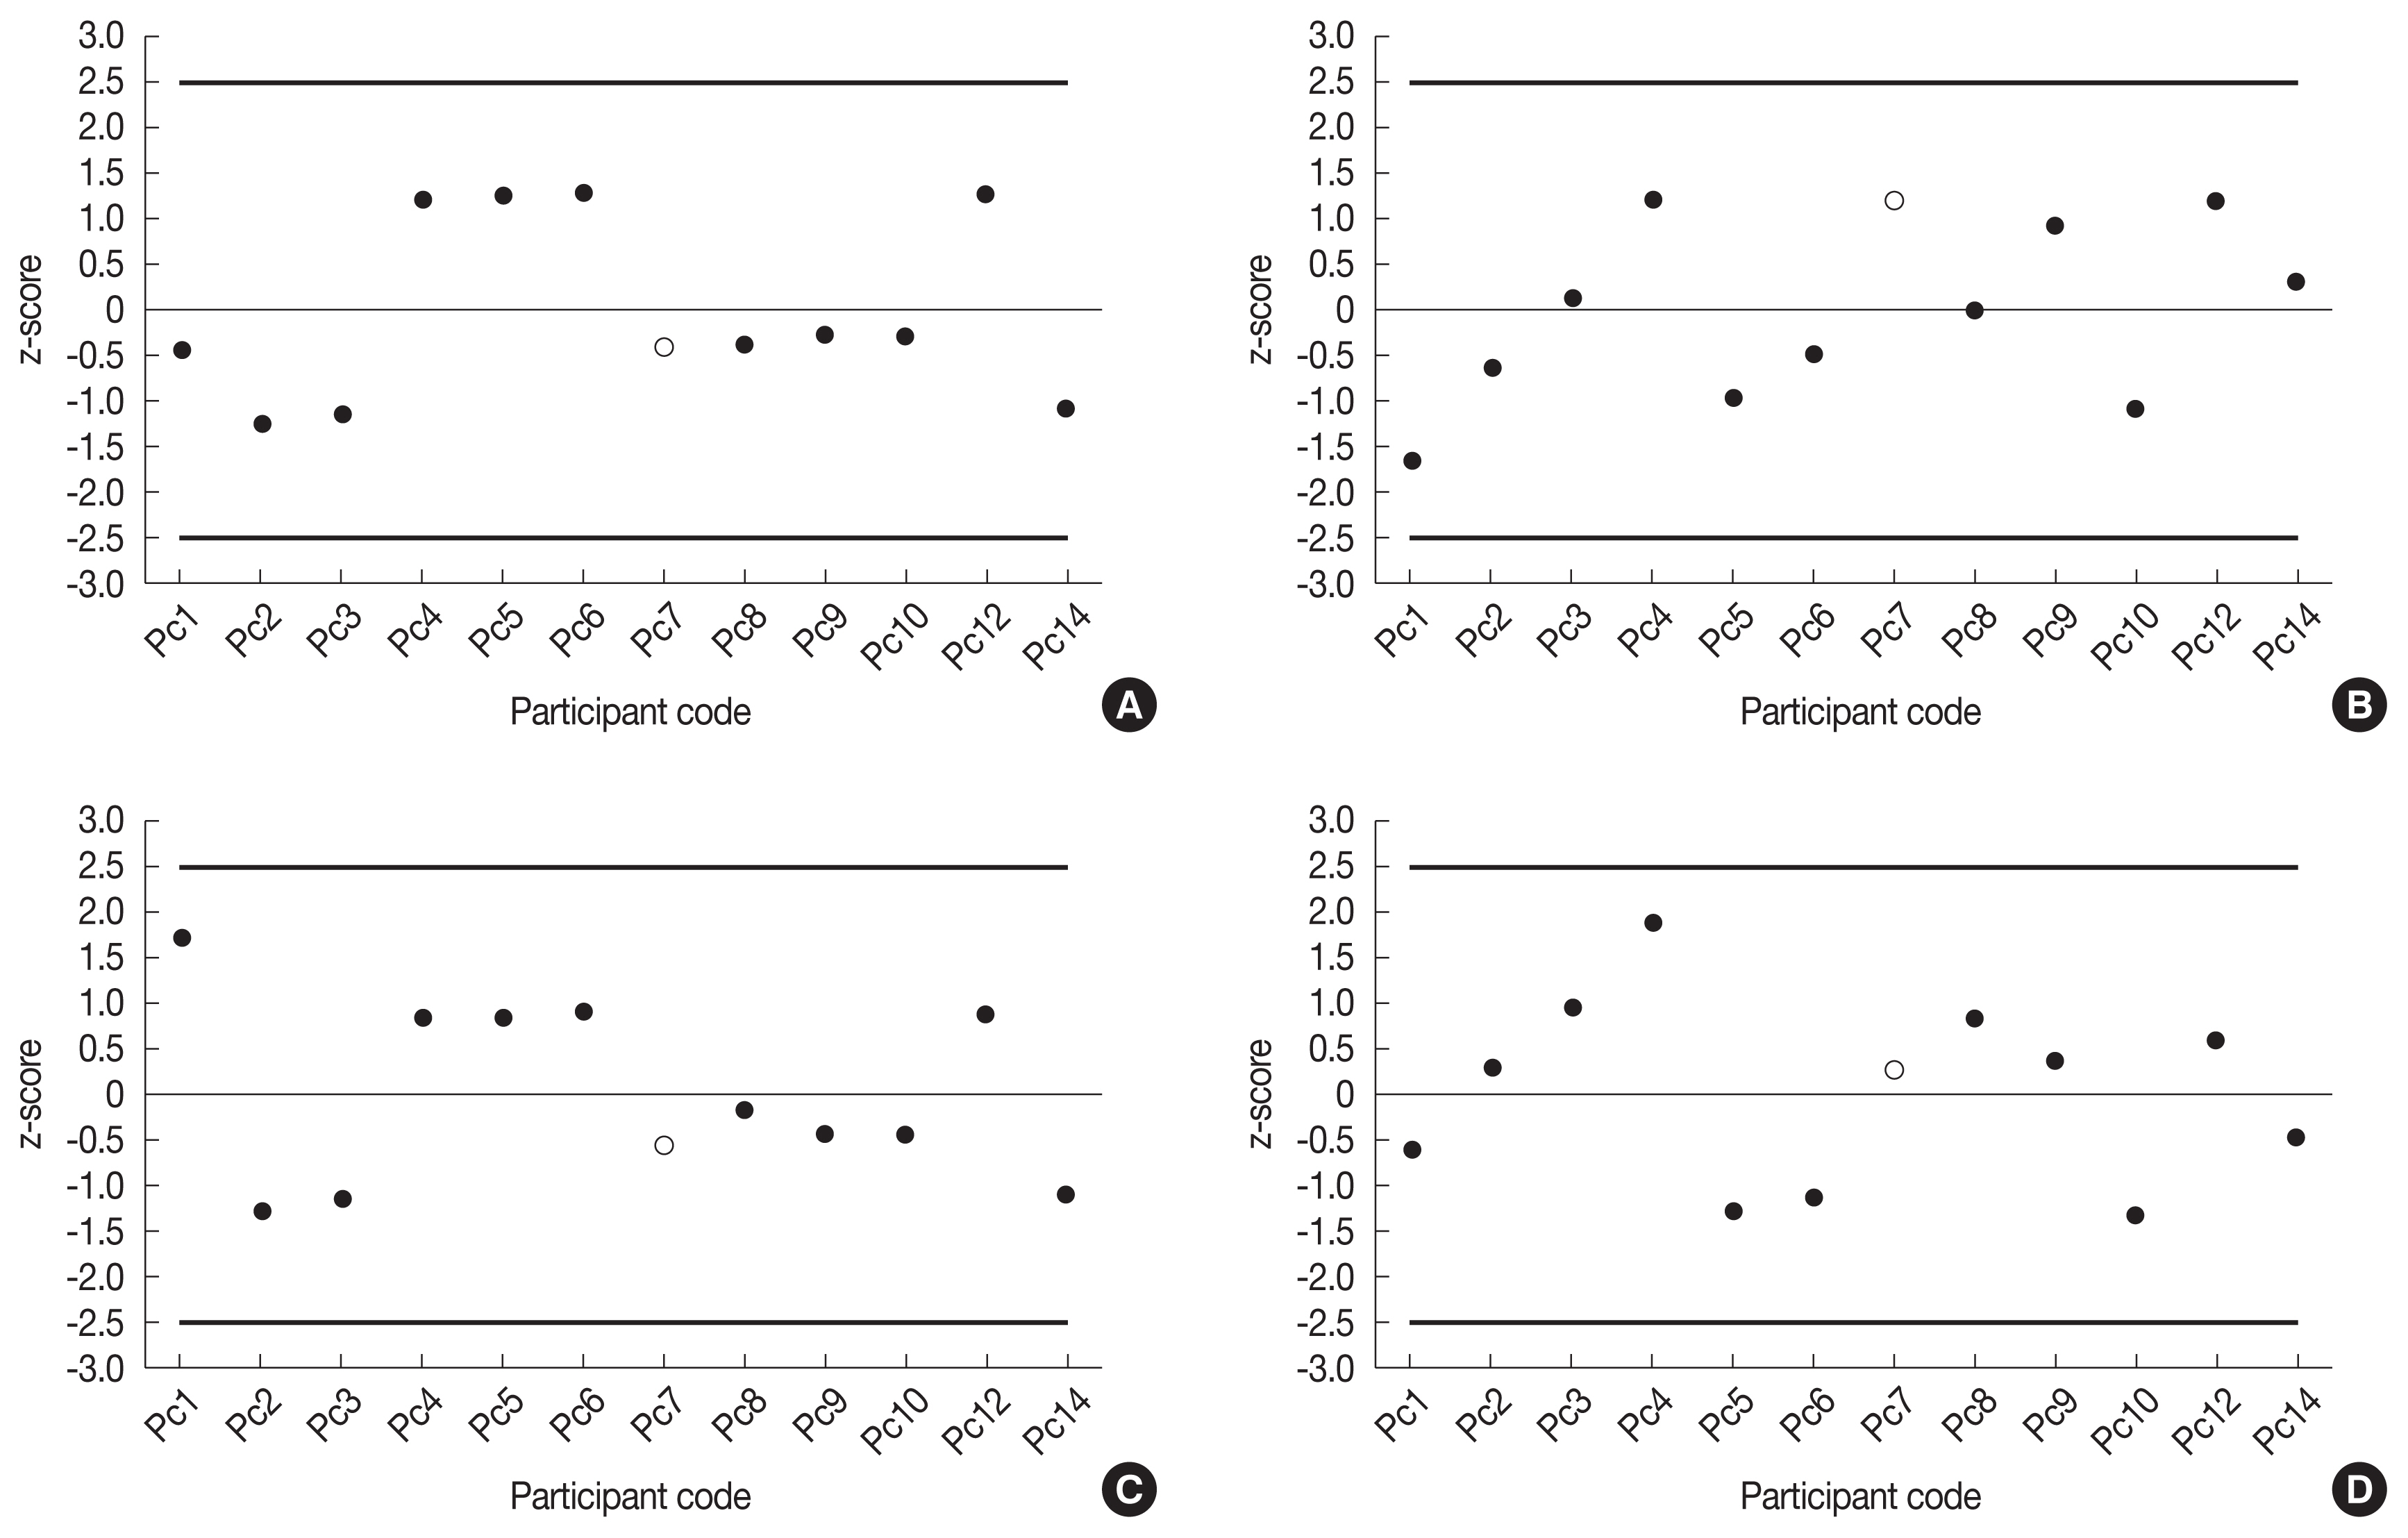
3. Case 3
In this case, since there were two intakes, the intake and the CED were divided into intake 1 and intake 2. The estimates of intakes and CEDs assessed by participants at each facility were not outliers. Since Pc7 did not present the absorption pattern and AMAD factor, it was marked as an empty circle. Pc11 and Pc13 did not assess this case. Figure 3 shows the identification of the harmonization according to the intakes and the CEDs.
The reason for the distribution is that, as in case 2, the intake point is assumed to be various. The midpoint of routine monitoring (April 3, 2017), acute intake (April 4, 2017) or chronic intake (April 1–5, 2017) made the time of intake to be various. In addition to the time pattern of intake and date of intake, information on intake and assessment factors were assumed to be the same except for Pc8 (AMAD is assumed to be 3 μm). In the case of intake 2, the ratio of maximum to minimum is 9.14 and the coefficient of variation is 69.8%, which is significantly higher than that of intake 1. The increase in the ratio of maximum and minimum and the coefficient of variation implies that the distribution is expanded. There are many reasons for this. Firstly, that is due to the variety of intake type and intake time. Secondly, various absorption type is assumed. In the information on the case, the chemical form of cobalt in the facility B was described as cobalt oxide, but there was a participant who assumed the absorption type to be M, which is the default value. Thirdly, the calculation of the residual activity at intake 1 allowed the distribution to expand. Participants did not account for this calculation method, so it was not able to be known how the intake 2 was affected by the intake 1. In addition, it was confirmed that there was a calculation error among the participants who suggested calculation method of residual radioactivity.
This is also true of CED. This is because dose coefficient differs depending on the combination of the assumption of the absorption type and the particle size. The smaller the particle size and the slower the absorption type, dose is greater [5].
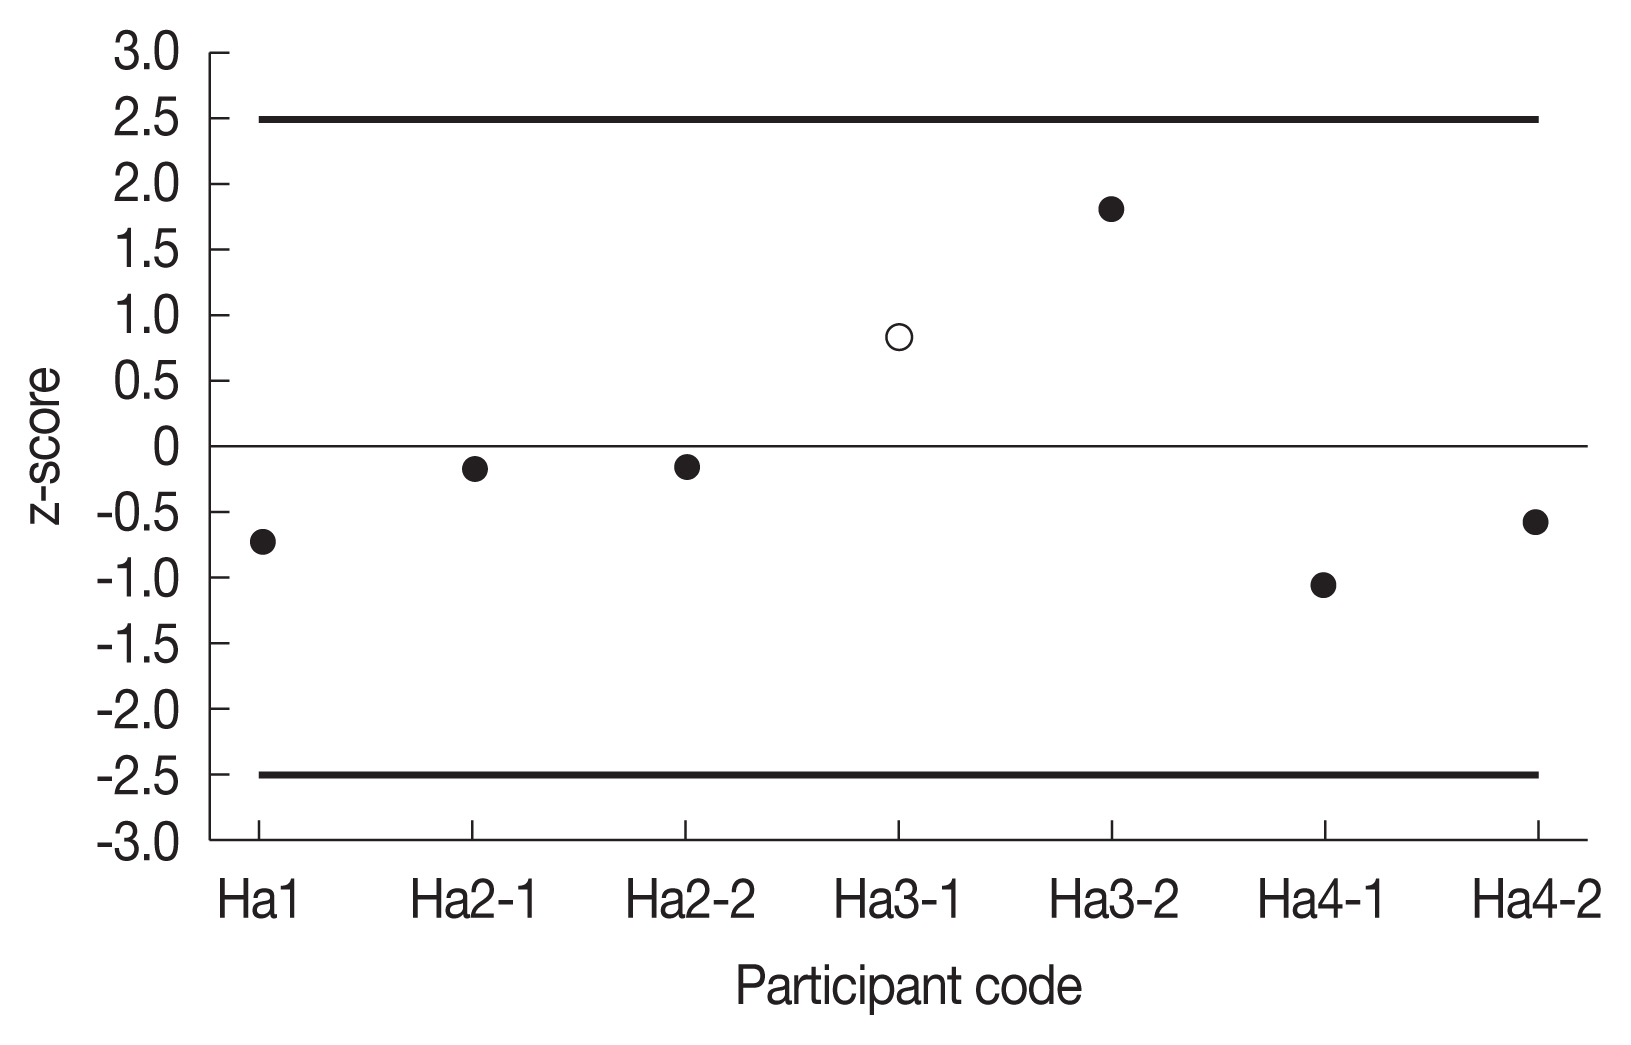
4. Case 4
In the case of tritium, it was used that a method of evaluating the dose using a procedure of measuring the concentration of the urine sample and simply fitting the concentration with time into a trapezoidal shape and the method of calculating the intake and the dose using the excretion function. All participants considered inhalation, and as assuming a solubility grade of SR-2 the dose coefficient was the same. Therefore, in order to compare the doses calculated by several methods, we conducted the harmonization identification only with the CEDs (Figure 4). Code was also given for each method.
The deposit effective dose assessed by each institutional participant according to the case was not selected as outliers. However, in Ha3-1, it was analyzed that the excretion function (0.023) per day was wrong (0.032). Ha1, Ha2-1, and Ha2-2 assumed that the value of measurements immediately before operation was background, and Ha4-1 and Ha4-2 used the background of the urine of the general person described in the case. No background was applied to other evaluations. Besides, Ha3-1 and Ha3-2 were calibrated to the radioactivity concentration per day by multiplying the sample by 1.4 L, but the other evaluations were calculated without correction.
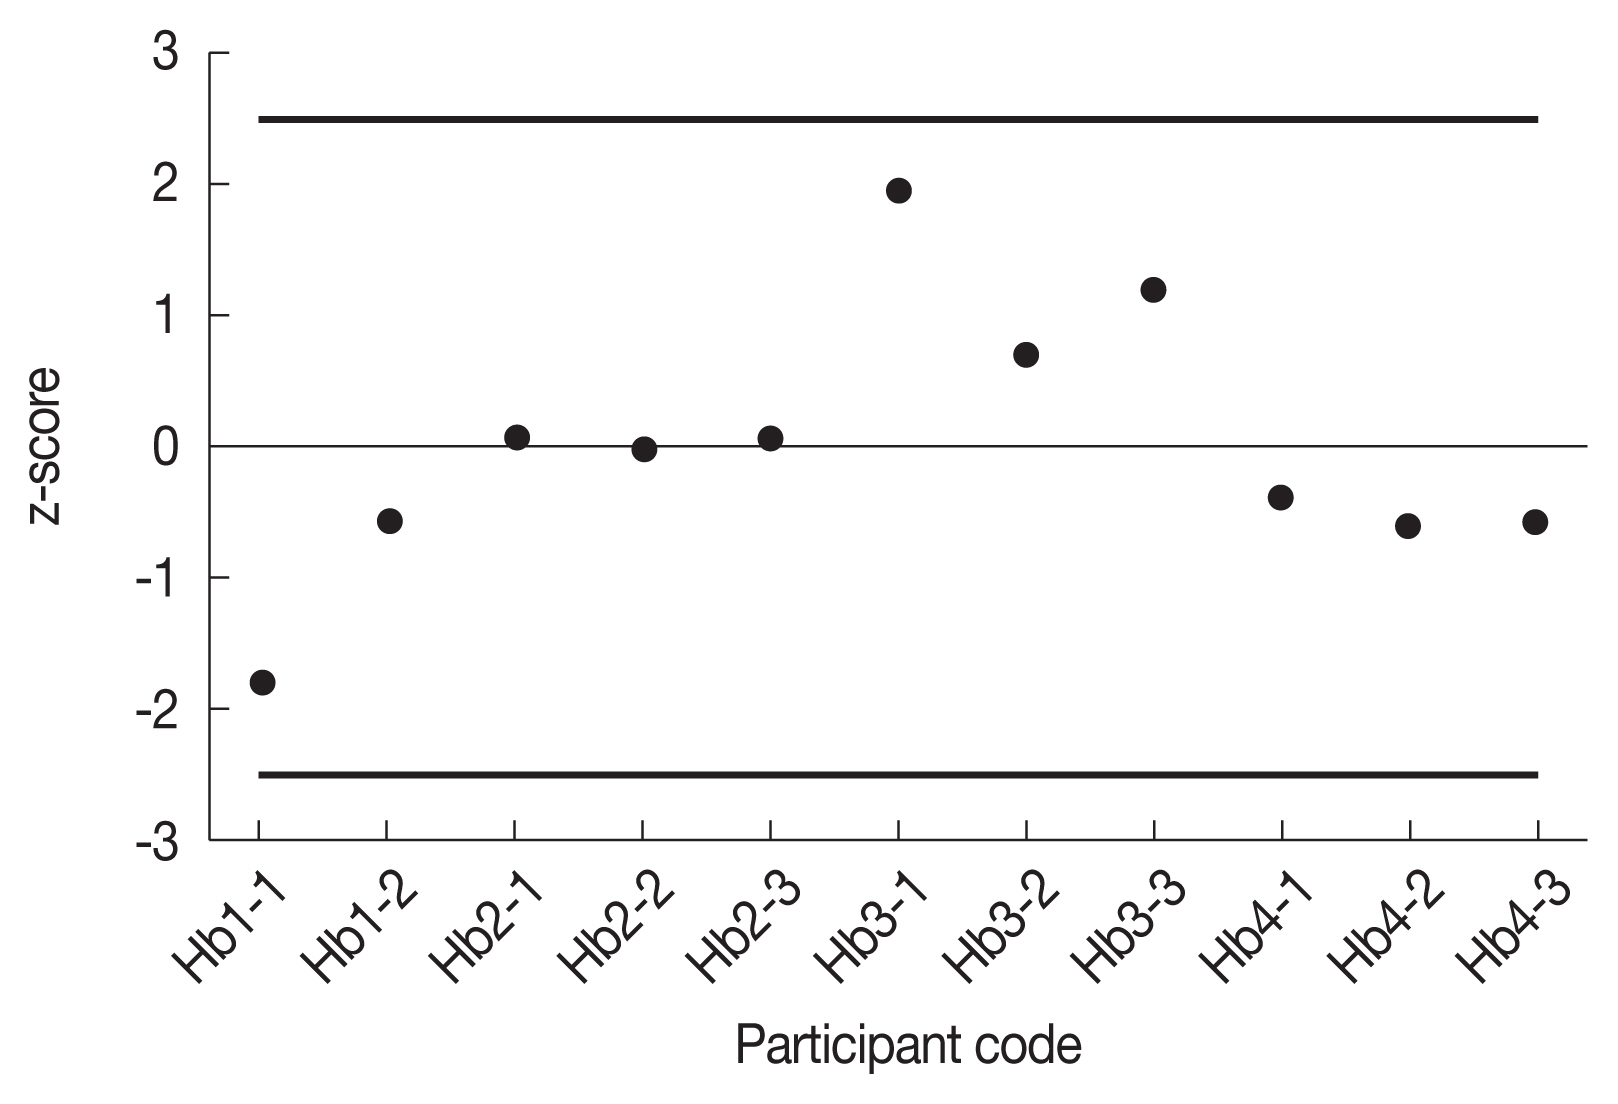
5. Case 5
In this case, only the deposit effective dose was compared for the same reason as the previous case. The CED assessed by each institutional participant according to the case was not selected as outliers (Figure 5).
The dispersion of the distribution relied on the method of calculating the intake. Except for Hb3-1, Hb3-2, and Hb3-3 the other evaluators assumed that the measurement immediately before radiation work was background. In addition, Hb3-1, Hb3-2, and Hb3-3 were calibrated to the radioactivity concentration per day by multiplying the spot sample by 1.4 L, but other evaluations were made without correction. An important point in the calculation for multiple ingestion is the need to calibrate the amount of residue previously consumed. Among participants who calculated the intake Hb1-1, Hb3-1 and Hb4-1 corrected the residual pre-intake.
The method of calculating the dose without calculating the intake is based on the assumption that the concentration of radioactivity in the body is the same as that of the measurement data, and it is calculated by calculating all the decay of tritium in the body. That is, it is calculated by obtaining the area between measurement data over time. Essentially, the infinite time integral of the last measurement must be added. There were participants (Hb1-2, Hb4-2, Hb4-3) who considered this, while there was no consideration (Hb3-2, Hb3-3).
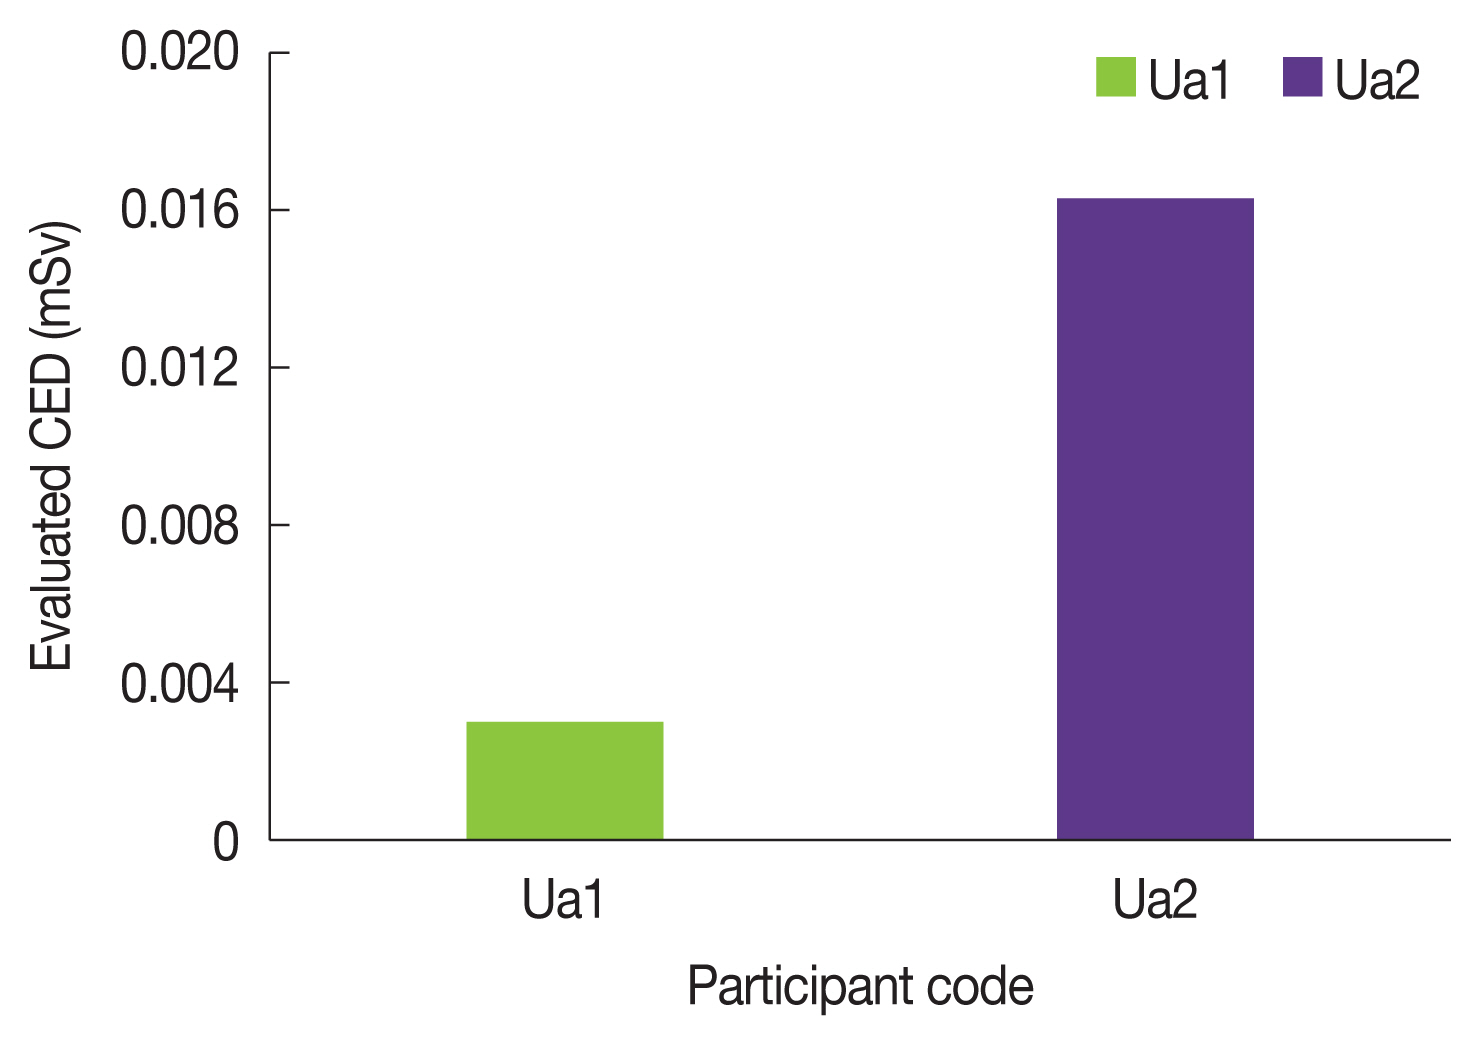
6. Case 6
In this case, there were only two evaluations, so no outliers were identified. The results of the dose calculated by the participant are shown in the figure below (Figure 6). As shown in Figure 5, the evaluated CEDs show a considerable difference. To assess the cause, we compared the assessment factors submitted by each assessor, and found that the degree of enrichment was different. Ua2 degree of enrichment for Uranium based on the case. On the other hand, although Ua1 did not attach comments, Ua1 was considered to have obtained only the intake and CED for 238U because Uranium included the highest enrichment of 238U, which seems to be caused by making a significant difference. However, this is considered to be a misjudgment. The physical half-life of 234U is very short compared to the physical half-life of 238U, so the fraction of 234U radioactivity in uranium is very high. This is the reason that 234U has the greatest effect on internal exposure among the uranium isotopes described in the case.
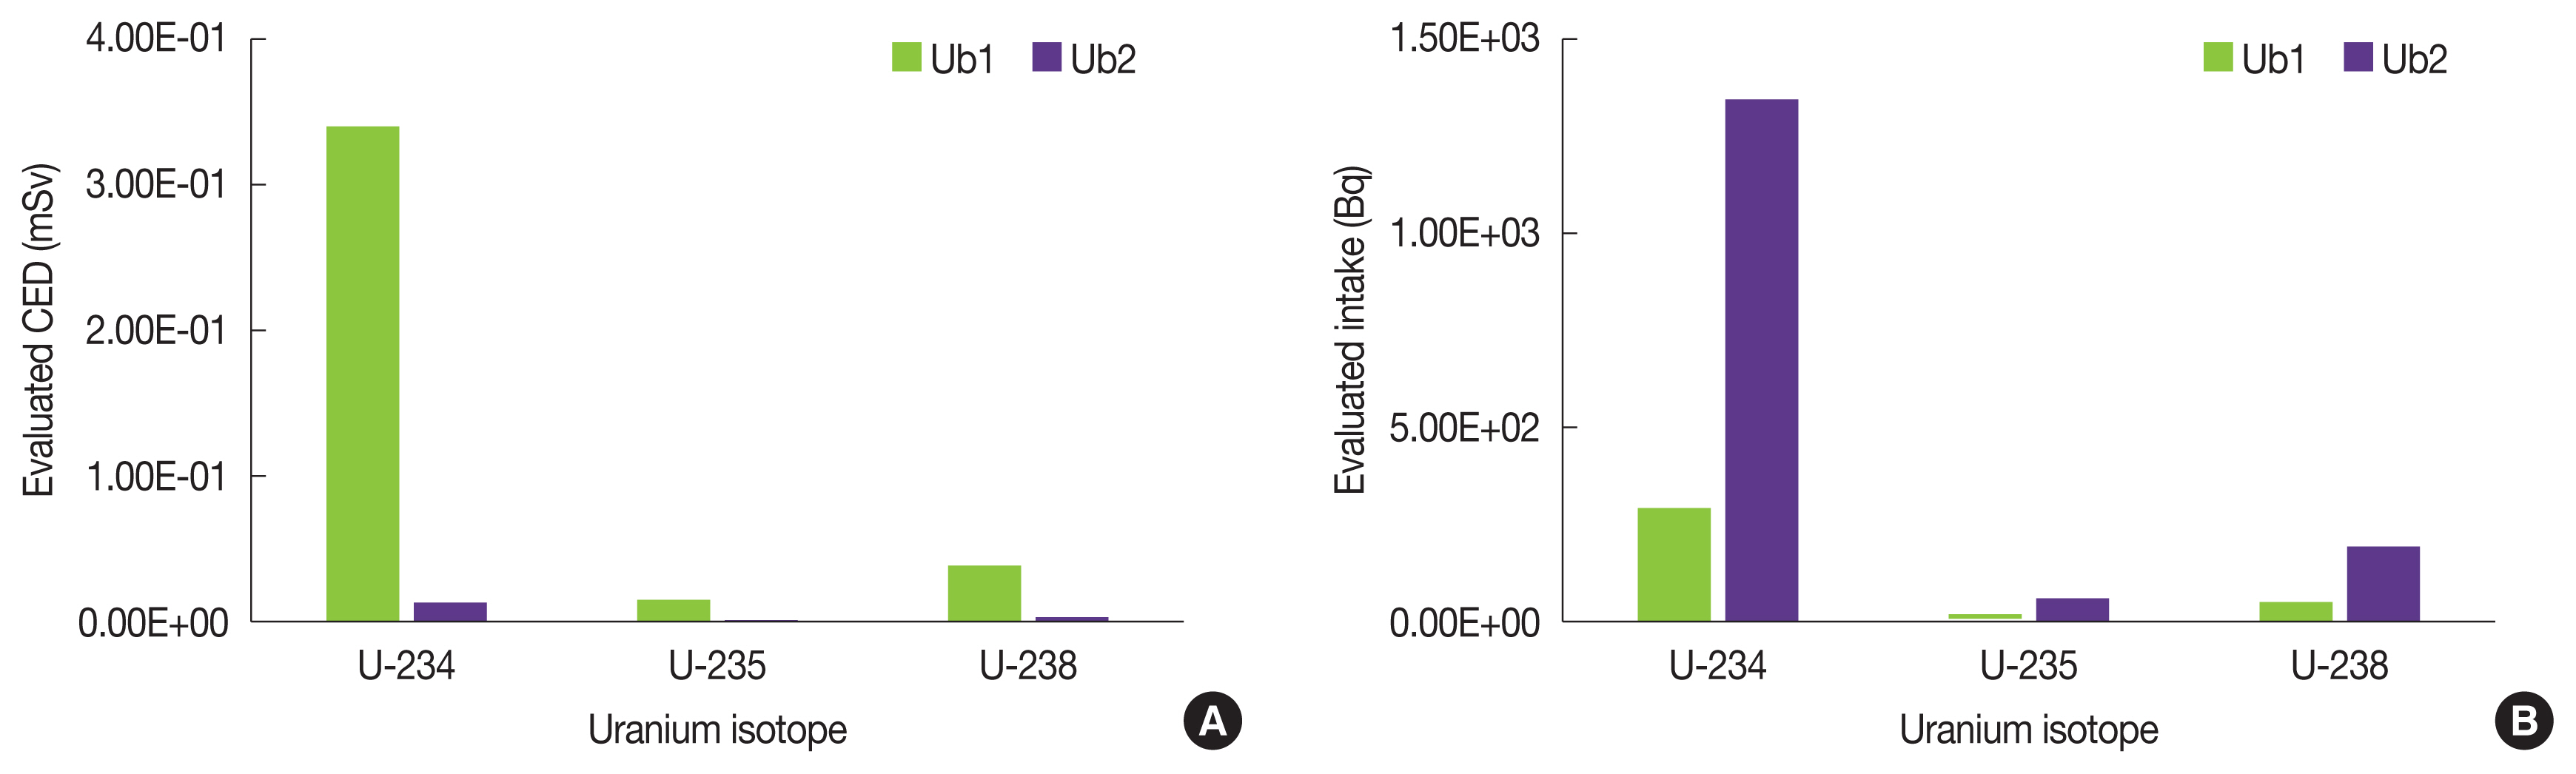
7. Case 7
Since there were only two evaluations as in Case 6, the results of Intake and CED were compared without identification the outliers (Figure 7).
The assessment factors were all the same and since Ub1 did not introduce the calculation process, it was difficult to make accurate comparison. Actual calculations in Case 7 are complicated because pre-intake and mixed nuclear species should be considered. These can make a difference. In this case, however, we were able to see from retrospective analogy that the biggest cause of the difference was the misuse of the dose coefficient.
Discussion
From the assessment of seven scenarios by participants, we were able to identify the reasons for the spread of the results. This can be divided into two main categories. The first is the spread of the distribution of results according to the assumption of the intake and assessment factors. The second is due to the misapplication of the factors involved in the calculation method.
In more detail, the effects of the assumptions of the intake and assessment factors are:
If the time of intake is unknown, the assessor determines the intake point through interviews or work log, or from a conservative perspective assumes that a chronic intake or an acute intake occurred in the middle of the monitoring period. However, this approach involves uncertainty about the point of intake and, if the point of intake differs from the actual, causes the error in the evaluated dose. Since the risk of these errors increases with longer period, general recommendation is not to misvalue real intakes more than three times due to monitoring period [12].
If you do not know the absorption type, or if you know it but simply evaluate the dose, it will be an error factor of the dose by evaluating it by choosing the default value recommended by ICRP. In case 3, for example, when compared to inhalation types M and S, assuming M, amount of intake was increased and the dose was reduced. In the case of absorption type M, the absorption rate to body fluids is higher and therefore the retention from the whole body is lower than that of absorption type S because it excretes more over time. Therefore, if the elapsed time after intake is the same, the concentration of radionuclides remaining in the whole body is reduced, which results in overestimation of the intake in the initial intake calculation. On the other hand, the doses received by workers can be attributed to substances of absorption type S with a low absorption rate of body fluids staying in the lungs for a long time, resulting in more exposure to the whole body [3].
Some participants also assumed different type of intake, intake routes, and AMAD. Assumptions about the intake time, and of whether the intake was acute, lasted for a short period of time or extended for a long time, are a significant point in interpreting the bioassay data. In some cases, as retention and excretion functions diminish very quickly the choice of time pattern of intake may affect the doses assessed within the same range [3].
The size of an aerosol affects the deposition of the Human Respiratory Tract Model (HRTM) and the transfer of the particles into the Gestro-Intestinal (GI) tract. For conservative or simple calculations, the ICRP recommends a size of 5 μm for radiation workers and 1um for the public, but in some working environments, aerosols are detected in various particle sizes.
Although not considered in this study, furthermore, consideration of progeny radionuclides bring uncertainty from calculating internal dosimetry in its train.
As to the effect of the calculation method and misapplication of related factors,
In the case of multiple ingestion, the diversity of dose calculation results was made from the differences in the calculation of the residual of the previous intake. This is why all the factors are the same, but the results are different.
In particular, not taking into account the background dose when being exposed small radioactivity makes considerable difference. The approach to urine samples is to evaluate the background before it is placed in the work and subtract it from the post-work measurement. If this method is not available, it is advised to consider subtracting the background value of an operator who has not been exposed to the radiation environment or subtracting the background value of the worker’s family member [5].
In the case of urine, it is necessary to calibrate the daily urine volume of the adult in the urine sample in order to evaluate the dose using the daily excretion fraction. However, in the case of direct dose evaluation by integrating the time-dependent area of bioassay measurement data, it can be applied immediately without correction. Incorrect application may result in over- or under-assessment.
An important assumption for uranium intake is that isotopes of uranium behave identically. Accordingly, the concentration of each isotope must be taken into account. In this case, uranium-234 is the smallest mass ratio among the isotopes that make up uranium, but it contributes most dose because of the shortest physical half-life [13].
Some participants made the mistake of using different coefficients without using the corresponding coefficients, even though they had chosen factors in recognition of the case or conservative factors. This also contributes to uncertainty.
Conclusion
Based on these results, we discussed with participants. Although there were no outliers in the result of identification of the seven cases, but there were various detailed proposals for the consistency of the results. As a result of the assessment of these scenarios, only one scenario was in level 2 presented as an IDEAS guideline above 1 mSv. In this blind test, the dose measurement results in most scenarios are less than 1 mSv. Although some participants were able to know about ingestion information or factors, they used the basic values presented by the ICRP in response to one of the basic principles of IDEAS’s project, ‘proportionality’ [14, 15]. However, some used the factors described in the case. In order to reduce the differences resulting from this, it also was proposed the need for precise guidance on factor selection at low dose exposure. We also thought that it was necessary to evaluate more sophisticated assessments through scenarios corresponding to level 3 above 6 mSv. Finally, in this intercomparison, most of the scenarios have low dose calculation results. However, in case of high dose scenario, misapplication of the calculation method and coefficient are a major cause of distribution spread. It is necessary to provide professional education for the dose assessor to solve this problem.
It is hard to expect harmonization is achieved through this one time blind intercomparision. The blind test intercomparation will be executed periodically, as a result, harmonization would be ensured. Furthermore, if harmonization is secured, accuracy and precision would definitely be acquired.
Although the aim of the blind test intercomparison was to determine harmonization, it is believed that as comparing and discussing the results, it could be possible to give expertise in dose assessment and contribute to quality assurance.