

Introduction
Quality Assurance (QA) in radiotherapy is generally practiced for the two main parts; to test the performance of medical LINAC machine and to verify the delivering accuracy of patient treatment plan. The former focuses on the mechanical performance and radiation accuracy of the machine and is performed on a regular period basis like daily, monthly, and yearly by recommendations or national regulations. The latter aims for a patient treatment using Intensity Modulation Radiotherapy (IMRT) and Volumetric Modulated Arc Therapy (VMAT) and is usually carried out before first start of treatment. Task Group 142 Report by American Association of Physicists in Medicine (AAPM) [1], one of the latest recommendations on QA of medical accelerators, mentions machine QA for IMRT but focuses only on mechanical test of MLC without any detailed mention of IMRT plan QA itself.
VMAT, the state-of-the-art beam delivering technique in a radiation therapy is much more advanced radiotherapy than traditional IMRT and is now commonly practiced in clinical situation. The complex features of its beam delivering system demands stricter QA than that for conventional fixed gantry IMRT. In modern radiotherapy, all clinical institutes do their best to get the optimal VMAT QA to guarantee successful dose delivering to tumor and normal tissue as expected in treatment planning system. However, there are no special mentions of regular machine QA for VMAT in TG142 report [1] released in 2009 and Korean regulation [2] in 2015 mostly based on TG142.
What is the best QA for IMRT or VMAT plan? The ideal plan QA is in principle to be performed in three-dimensional patient body in real time while patient is under treatment for a full period of treatment. However, it is unrealistic and furthermore, there are no commercial tools available for such QA. The suboptimal QA as an alternative is to utilize patient-like phantom and carry out QAs on a daily base each time before daily treatment (we call it “full QA” for convenience in this work). The two-dimensional (2D) detector array systems like portal dosimetry and MatriXX (IBA Dosimetry GmbH, Schwarzenbruck, Germany) has a limitation to give three-dimensional information of dose distribution because patient CT image are not used, but are broadly practiced in clinical situation as a realistic QA tools. The three-dimensional QA systems like COMPASS (IBA Dosimetry GmbH) are commercially available but are improper to be used for daily based patient QA. Even though these two or three-dimensional QA systems are available in clinical practice, they are all for patient-specific plan QA and will give a great deal of workload for daily based QA. Considering realistic difficulties in clinical situation, the QA for patient plan is commonly carried out one time before start of first treatment (we call it “one QA” for convenience). One QA has good advantage as a realistic solution but cannot guarantee the full delivering accuracy over a full session of treatment. In other words, it cannot predict unexpected delivering errors occurring in not first day but another day of treatments. It necessitates another solution to make up for the deficiency of one QA.
There have been much efforts to develop the proper machine QA related to IMRT and VMAT [1–4]. AAPM TG119 [5] released in 2009 suggested various target structures in a simple box-shaped phantom, but they were for IMRT plan not for VMAT plan. Report 24 of Netherlands Commission on Radiation Dosimetry Subcommittee (NCS) released in 2015 developed significant guidelines for quality assurances and control for VMAT treatments and suggested a tumor site specific class solution as the machine QA for VMAT [4]. They gave general, but not detailed, guidelines for the development of VMAT plan by class solutions. Mohammad et al. introduced and tested the regular machine QA for VMAT where it was called representative VMAT QA [6], but it was simple and consisted of one Planning Target Volume (PTV) and a few organs at risk in a cubic water phantom.
We aim to perform and test a special VMAT plan proposed in this research as a machine QA so that it might be a good solution to supplement weak point of one QA to make it more realistic. In this work, we tried to develop the exclusive VMAT plan as regular machine QA simulating alike real VMAT plan. The computational human phantom developed by Choi et al. [7] was used to simulate a real humanlike body. The body was divided simply into five anatomical sections and VMAT plans representing each section were created from real VMAT plans. We named the plan a plan-class specific reference quality assurance (pcsr QA) in this research. Five pcsr QA plans were performed and tested in this work.
Materials and Methods
1. Plan classification
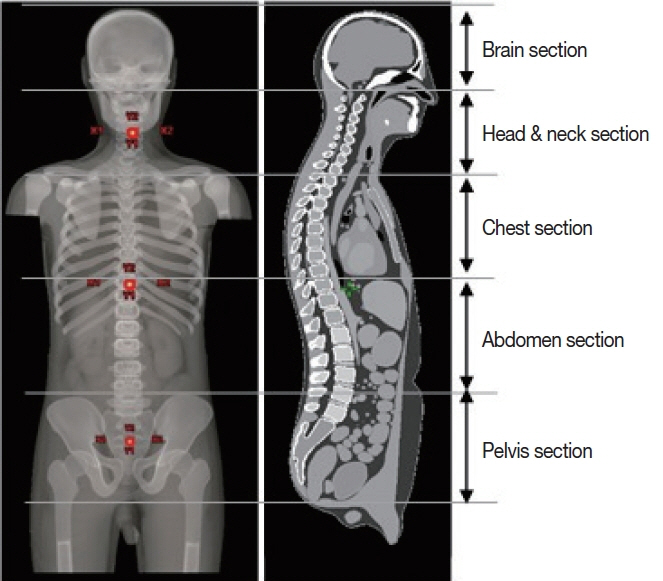
The aim of this study was to develop pcsr QA for VMAT. In accordance with this purpose, it is ideal that all the possible VMAT plans be classified and grouped together into each specific class with similar plan properties and that the pcsr QA, a reference QA representing each class, should be designed and planned. The plan class should be defined in principle by plan properties with different modulation level. It means that plans from totally different treatment sites like brain parts and pelvis parts are likely to belong to the same class. On the contrary, even plans in the same treatment sites each might go to different plan classes, that is to say, different modulation levels. We thought that the plan properties-based plan classification seems good theoretically, but we didn’t try it here because it looked not easy to first define plan properties and then classify plans by them. Instead of classifying plans by plan properties, which will be done later in follow-up study, in this research, we took a simple approach to classify plans by treatment sites (Figure 1). We took a simple assumption that plans in the same treatment site had similar plan properties.
We divided the whole body into five treatment sites (Figure 1) for convenience, brain, head and neck, chest, abdomen, and pelvis. One plan in each treatment sites was selected from real patient treatment cases and used to create the plan-class specific QA plan, named pcsr QA, respectively. In other words, the pcsr QA plan used real patient plan and therefore can be said to take much more advanced form of QA for VMAT than simple Picket Fence test (PF test) and IMRT QA in TG142 [1]. For this study VMAT cases with multiple fractions were selected and Stereotactic Radiosurgery (SRS) and Stereotactic Body Radiotherapy (SBRT) cases were excluded.
2. Creating pcsr QA plan
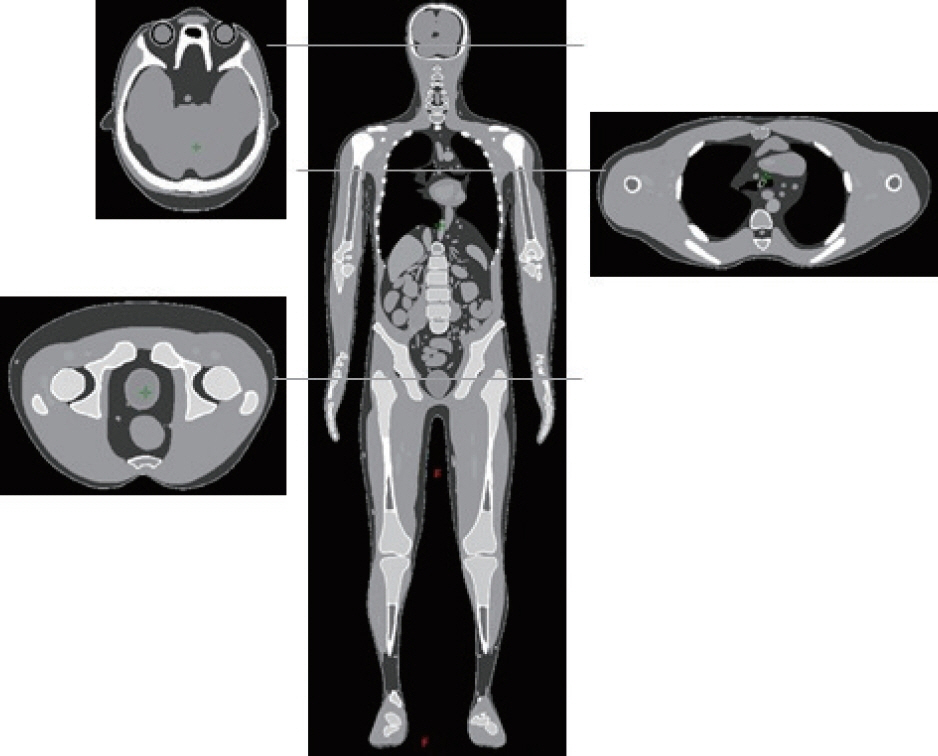
In this study, we aim to develop the QA plan modeling same as real patient treatment plan. In order to realize this, we need first the CT image set equivalent to real patient anatomy. Real patient CT images are the best candidate, but you are not supposed to use it for a research without getting permission from the hospital related Institutional Review Board. The QA, developed in this research is not for patient treatment but only for regular machine QA for VMAT plan. Therefore, for this QA we have no call to have the CT image exactly same as real human anatomy. If an artificial human CT imitating human body as close to real human body as possible was available, it could be a good alternative for real patient CT image. We used High-Definition Reference Korean-Man (HDRK-Man), the computational human phantom developed in Hanyang University Radiation Engineering Laboratory (HUREL) (Figure 2) to create human body like CT image. This phantom is the Polygon-Surface Reference Korean-Man [8] by converting the Visible Korean Human-Man voxel phantom [7] and adjusting the CT data to that of reference Korean data for height (171 cm), weight (68 kg), and 30 organs and tissue sizes. This phantom was used as VMAT QA-dedicated CT Image and will be called pcsr phantom here for convenience. If you visit the website http://hurel.hanyang.ac.kr, you can get more information on this phantom.
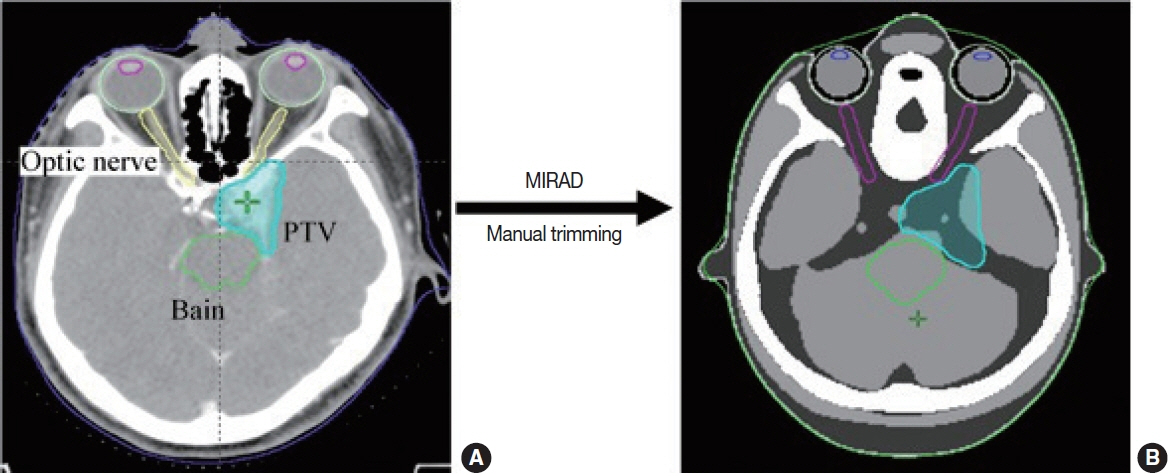
In this study, the pcsr QA plan imitates a real VMAT patient plan. After selecting a real patient plan to be used as a model of a pcsr plan, contours in the real plan were mapped into the pcsr phantom (Figure 3). We fulfilled this job with the help of MIRADA (version 1.1.1), which is a software tool for Deformable Image Registration. Patient CT and Phantom CT are first fused in MIRADA and then organs at risk in patient CT are deformed and contoured in phantom CT. However, the contours made this way look somewhat different from original ones in size and shape and we trimmed and smoothed them a little bit manually so that they have the size and shape as similar to original one as possible.
We designed five pcsr QA plans from selected patient plans for each treatment site - brain, head neck, chest, abdomen, and pelvis- in our treatment planning systems (Eclipse, Varian Medical Systems, CA, USA) (Figure 4). The corresponding verification plans for them then were created and verified with portal dosimetry system. Here, we simply call them “pcsr verification plans”. The pcsr QA plans were made with the same plan conditions as selected real patient plans including same constraints imposed to PTV and organs at risk. We summarized them in Table 1, where we don’t show the constraints used in real patient plan because of many constraints to be included in summary in the table. We delivered five pcsr verification plans on a daily basis over a period of research and tracked them to assess their usefulness. Several real patients under treatments (Table 2) were also tracked to test the usefulness of this pcsr QA through comparisons between them.
Results and Discussion
We first investigated how much MLC movement and dosimetric error occurs in regular delivery of pcsr plans and additionally tried to compare with those occurred in regular delivery of real VMAT plans. The basic performance of pcsr plans were evaluated with MLC movement and gamma index analyses.
1. MLC movement analysis
MLC movement error is considered as one of key causes of dose distribution error. We evaluated it from data in Dynalog file. Dynalog file contains MLC position information of each 0.05 second interval of any radiotherapy session. It is created with the MLC controller of medical LINACs from Varian (Varian Medical Systems, Palo Alto, CA, USA). We first analyzed dynalog file data with Dynalog File Viewer (DFV) (version 7, Varian Medical Systems). DFV [9] is a useful utility program, installed in Four Dimensional Integrated Treatment Console (4DITC), the computer console of the LINAC. However, DFV only show MLC position error, it does not show us anything about leaf speed error. Also, DFV does not show how much MLC movement errors occurred in different positions of irradiated treatment field. Therefore, we used MATLAB program for more detailed analysis of position and speed of individual MLC leaf.
The MATLAB program anticipated all MLC position data in dynalog files of all plans. Then leaf positions were magnified with the magnification factor 1.966; dynalog file contains leaf positions at their physical plane [9] but we needed to evaluate all leaf positions on the horizontal plane through isocenter. The used magnification factor was the ratio between source to MLC bottom distance and MLC bottom to isocenter distance, calculated from the data in DICOM RTPLAN file. Equation 1 and 2 was used to calculate MLC speed and error, respectively. N in these equations stands for leaf position tag at 0.05 seconds time of the VMAT session. MLC controller of pre-TrueBeam LINACs from Varian (Varian Medical Systems) records MLC position information at 0.05 seconds interval of beam delivery.
1) MLC positional error
We evaluated daily MLC position error occurred in delivering pcsr verification plan and real treatment plans. Maximum of Root Mean Square (maxRMS) of MLC position among all active leaves was evaluated with DFV and MATLAB program.
(1) MLC position error analysis with DFV
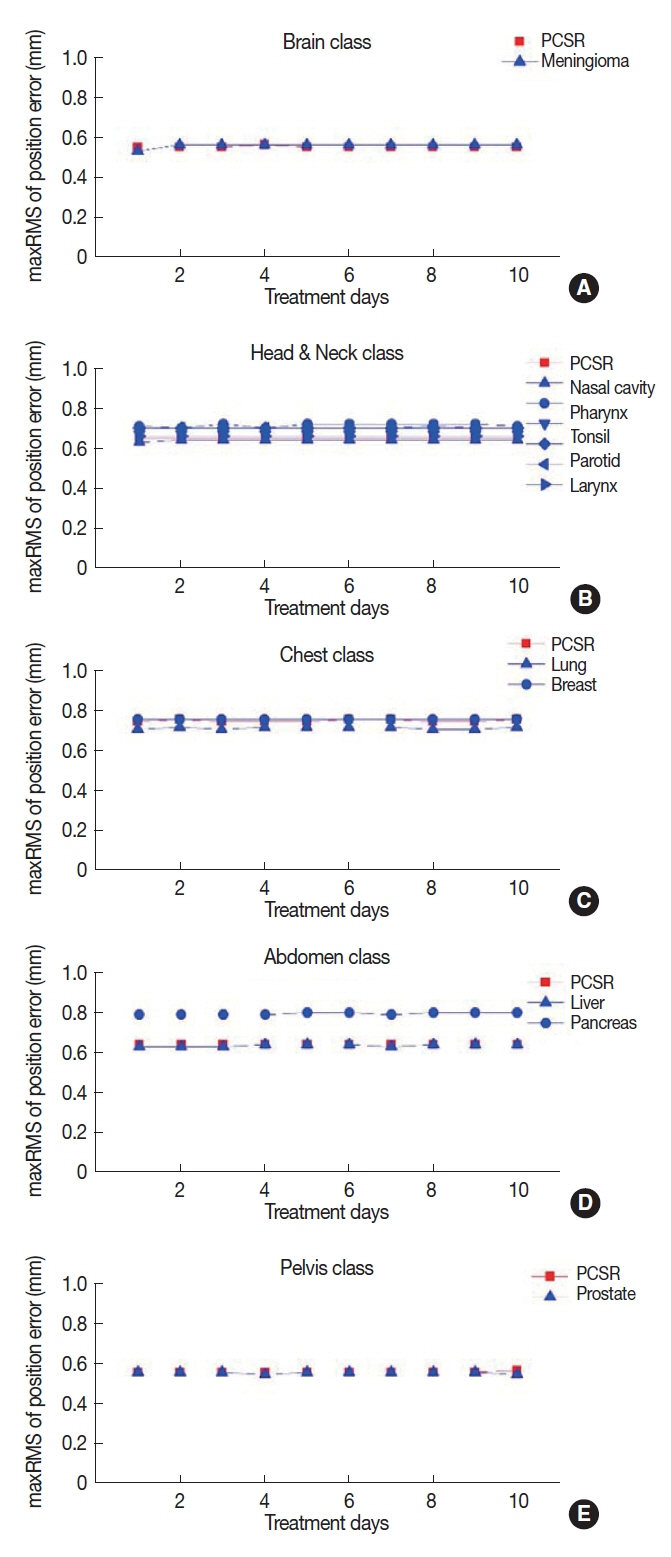
DFV provides a simple and useful evaluation tool of MLC performance with the recommended tolerance <0.35 cm for maxRMS of MLC position error [1–3]. Figure 5 shows the daily distributions of the maxRMS by DFV for 5 different pcsr QA plans and 12 real treatment plans which were grouped into the corresponding plan class. Similar MLC position error was revealed by different other previous works [10–13]. The maxRMSs for all plans were all within the tolerance limit. The maxRMSs of real plans were compared with those of their pcsr plan and resulted in good acceptable fluctuation range in reference to their pcsr plans (Figure 6). These results can, carefully but not definitely, lead to guess that the simple DFV analysis of the maxRMSs with pcsr QAs could be a simple and useful tool to check the MLC performance of real VMAT plans belonging to their plan class.
(2) MLC position error analysis with MATLAB
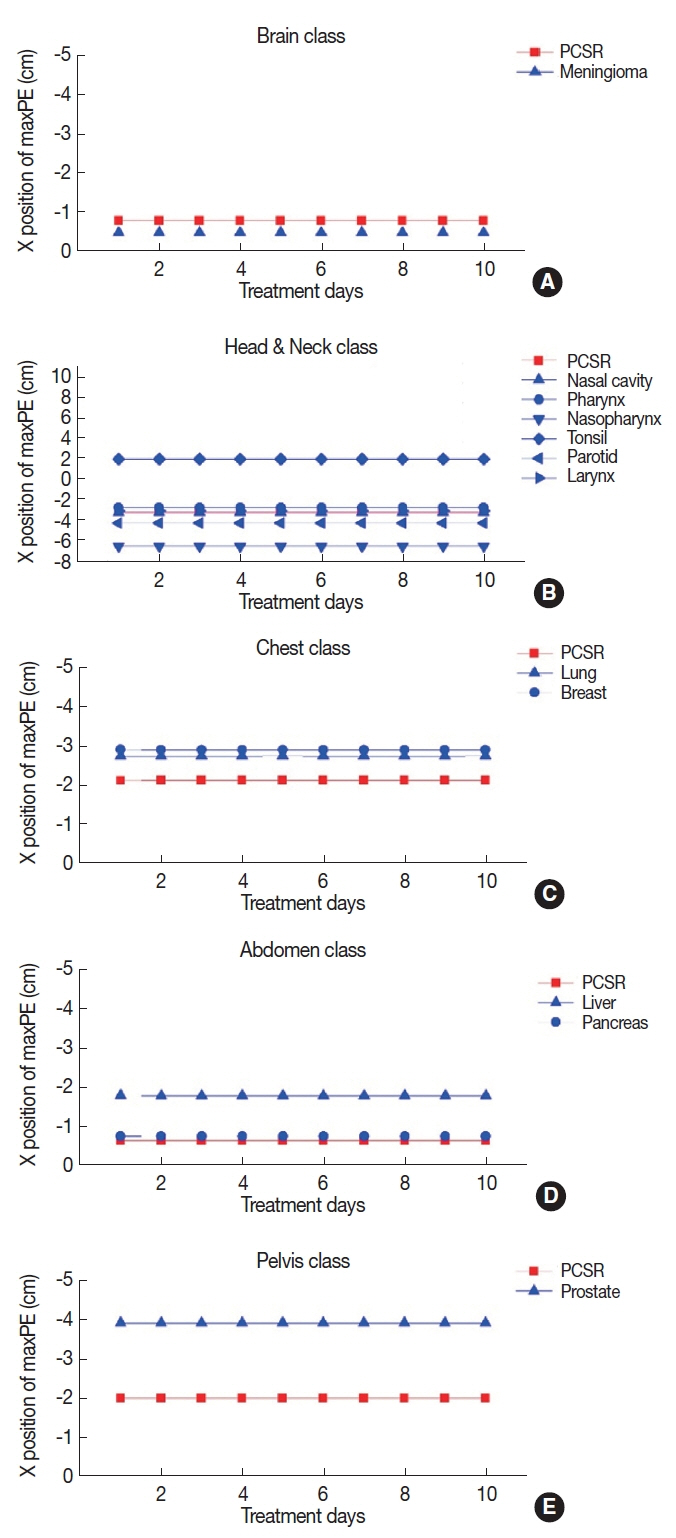
DVF allows users a simple and easy access to the information of maxRMS of MLC position error for individual leaf in bank A and B. However, you cannot get the positional information from DVF of where the maxRMS occurs in the total range of individual leaf moving. Neither any recommended parameter in guidelines [1–4] nor any commercial software of dynalog file analysis help us to know which portion of the irradiated area is affected by big MLC position errors. We used MATLAB from Dynalog file to catch where the maximum position error (maxPE) of individual leaf occurs in travelling each 1 mm path inside the irradiated area. We tracked only the specific leaf number with the biggest maxRMS of position error among all leaves.
The maxRMS of position error is useful to evaluate the temporary performance of MLC movement whereas positional constancy or variation of maxPE can be a good indicator of the stability and repeatability of MLC movement during VMAT delivery session. Figure 6 shows the daily distribution of the position of maxPE of the leaf number with the biggest maxRMS of position error among all leaf numbers for 5 different plan class. The positional variation of maxPEs for both pcsr and real plans were observed very stable (≤±8.6× 10⁻⁴%) over the research session, which argues the good stability and repeatability of MLC movement during VMAT delivery session. Moreover, the real plans in their plan class showed similar variation as their pcsr plan (Figure 6), which could lead to meaningful correlation that pcsr QA plans can be a good guideline to check mid-term quality of MLC movement for real VMAT delivery.
2) MLC Speed error
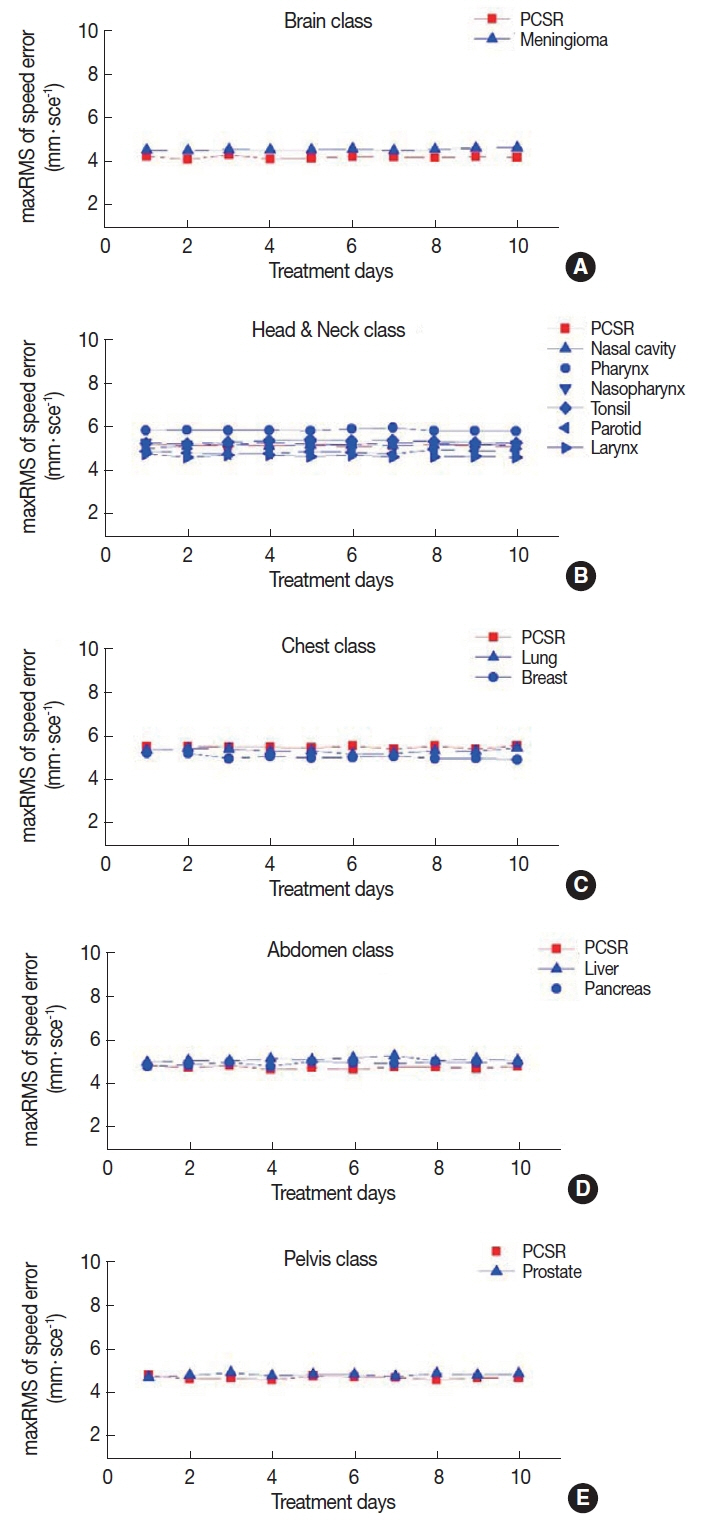
In this work, we also tried to analyze MLC speed properties because it is an important VMAT plan parameter and it has direct relation to beam to the scale of beam modulation and deliverability [6, 14–17, 28]. Thus, VMAT plans can be characterized by MLC speed. DFV is a handy tool to analyze MLC position accuracy and beam held status, but it cannot provide us MLC speed information. We focused in this research on the daily variation of maxRMS of speed error over the research period because it can be another evidence on a good mid-term quality of VMAT treatment deliveries. We used the MATLAB program from dynalog files to calculate maxRMS of MLC speed error for daily QA sessions of five pcsr QA plans and real treatment plans. Figure 7 shows the calculated daily maxRMSs of MLC speed error for five different plan class, treatment sites, that is to say, brain, head & neck, chest, abdomen, and pelvis plan class. We found similar trend of speed error as Litzenberg et al. [20] shown in their software demonstration.
Daily variations for real VMAT plans in Figure 7 were observed very comparable to those in their pcsr plans. The analogy with their figure could lead to careful but significant inference that pcsr QA plan could be a surrogate for the QA of real VMAT plan over a treatment session. The difference of maxRMSs of speed error between real plans and their pcsr plan in Figure 7 doesn’t let us come to an easy conclusion that pcsr have significant relation with real plans as their surrogate, different than position error analysis. It comes from the limit of pcsr plan, which was simply created from selecting randomly one of real plans in plan class. The simple classification of plans by treatment sites results in different modulation levels among plans even in the same plan class. It will be best to categorize plans by their modulation level to create plan class. However, we didn’t do it in this work and leave it behind as future work. In spite of such limitation, Figure 7 argues that pcsr plan can play a good role of predicting mid-term quality of real VMAT plans over the treatment session even for one time plan QA.
2. Dosimetric analysis
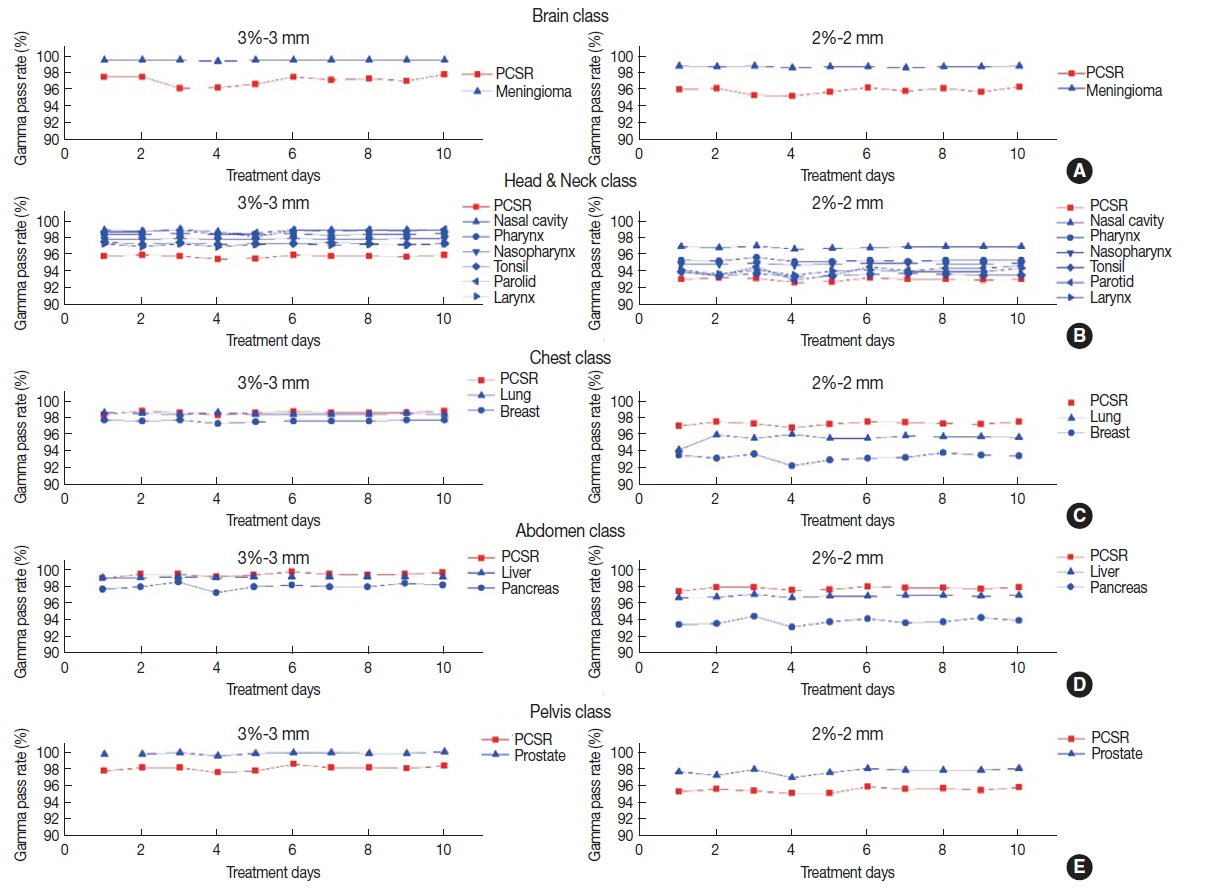
The final accuracy of beam delivering should be evaluated in terms of delivered radiation dose. Gamma pass rate has been commonly used to evaluate the dosimetric accuracy of beam delivering [21]. We used the Portal dosimetry system using electronic portal imaging devices (version aS1000, Varian Medical Systems) to analyze gamma pass rate with the criteria of pass rate 95% for 3%-3 mm, which is commonly used criteria for pass rate in clinical practice, and added the 2%-2 mm criteria. We evaluated planar dose distribution in the area encompassed by completely irradiated area outline (CIAO) +10 mm margin. Improved gamma algorithm option was used for global gamma analysis, when normalization mode was set to absolute, and local gamma threshold was set to 20%. Portal Dosimetry Reference Guide [22] for using the portal dosimetry module in Eclipse (Version 11, Varian Medical Systems) details these tools.
In this work, we hoped to predict the mid-term quality of real VMAT deliveries using pcsr QA plans and paid attention to the daily variation of gamma pass rate rather than its value. Figure 8 shows how gamma pass rates of both pcsr QA plan and treatment plans in their plan class varied on a daily basis over this study period. Similar gamma pass rate was observed in other earlier studies [6, 23–25]. It was observed that the daily variation of both pcsr plans and real plans in their plan class had a similar trend for the criteria of both 3%-3 mm and 2%-2 mm. These findings enable us to infer that pcsr QA plan could be a good surrogate for real VMAT plan to predict the mid-term stability and repeatability of real plan without its daily plan QA. The gamma analysis performed in this study can be supplemented by organ based gamma index like that suggested in AAPM TG 218 [26]. However, it is beyond this research scope and left behind for future work.
Advanced radiotherapy technologies like VMAT demands dosimetric accuracy as well as mechanical accuracy. The present guidelines for LINAC QA are not updated as fast as new technologies come to the market. For example, present guidelines [1–4] recommend monthly PF test for MLC QA, but researches [27, 28] found that we need daily MLC QA. More importantly, the MLC movement error revealed in this strenuous test cannot represent the MLC movement error occurred in real treatment delivery [14]. AAPM TG 100 [29] clearly addressed this issue in their 153rd failure mode error analysis (FMEA). Some radiotherapy centers perform periodic “Class-solution QA” [30] to guarantee that the basic dosimetry remains valid. Our proposed pcsr QA can be good alternative, because it includes both of mechanical and dosimetric QA of the LINAC. Ours is an elementary proposal and further work can be done to enhance plan class or to include 3D dosimetric evaluation in pcsr QA.
CONCLUSION
In this work we partitioned human body into five different anatomical sites, that is, five plan class and made a new proposal of pcsr plan to represent each class as a part of regular LINAC QA for VMAT plan. Of course, this newly proposed pcsr plan leaves much to be desired so it needs additional future research. In spite of its shortcomings, we believe that the pcsr QA proposed in this study would be useful and helpful to predict the mid-term (~roughly one month or less) quality of real VMAT treatment delivery.