Kim, Lee, Lee, and Choi: Assessment of Environmental Radioactivity Surveillance Results around Korean Nuclear Power Utilization Facilities in 2017
Abstract
Background
Government conducts environmental radioactivity surveillance for verification purpose around nuclear facilities based on the Nuclear Safety Law and issues a surveillance report every year. This study aims to evaluate the short and the long-term fluctuation of radionuclides detected above MDC and their origins using concentration ratios between these radionuclides.
Materials and Methods
Sample media for verification surveillance are air, rainwater, groundwater, soil, and milk for terrestrial samples, and seawater, marine sediment, fish, and seaweed for marine samples. Gamma-emitting radionuclides including 137Cs, 90Sr, Pu, 3H, and 14C are evaluated in these samples.
Results and Discussion
According to the result of the environmental radioactivity verification surveillance in the vicinity of nuclear power facilities in 2017, the anthropogenic radionuclides were not detected in most of the environmental samples except for the detection of a trace level of 137Cs, 90Sr, Pu, and 131I in some samples. Radioactivity concentration ratios between the anthropogenic radionuclides (137Cs/90Sr, 137Cs/239+240Pu, 90Sr/239+240Pu) were similar to those reported in the environmental samples, which were affected by the global fallout of the past nuclear weapon test, and Pu atomic ratios (240Pu/239Pu) in the terrestrial sample and marine sample showed significant differences due to the different input pathway and the Pu source. Radioactive iodine (131I) was detected at the range of <5.6ŌĆō190 mBq┬Ękg-freshŌłÆ1 in the gulfweed and sea trumpet collected from the area of Kori and Wolsong intake and discharge. A high level of 3H was observed in the air (Sangbong: 0.688┬▒0.841 Bq┬ĘmŌłÆ3) and the precipitation (Meteorology Post: 199┬▒126 Bq┬ĘLŌłÆ1) samples of the Wolsong nuclear power plant (NPP). 3H concentration in the precipitation and pine needle samples showed typical variation pattern with the distance and the wind direction from the stack due to the gaseous release of 3H in Wolsong NPP.
Conclusion
Except for the detection of a trace level of 137Cs, 90Sr, Pu, and 131I in some samples, anthropogenic radionuclides were below MDC in most of the environmental samples. Overall, no unusual radionuclides and abnormal concentration were detected in the 2017ŌĆÖs surveillance result for verification. This research will be available in the assessment of environment around nuclear facilities in the event of radioactive material release.
Keywords: Environmental Radioactivity, Anthropogenic Radionuclides, Radioactivity Concentration, Normal Fluctuating Range, Radioactivity Concentration Ratio
Introduction
The IAEA provides general requirements for the radiation monitoring and design of monitoring programs to protect the environment and human beings based on the Safety Standards Series [ 1]. Further, IAEA Safety Guide No. RS-G-1.8 [ 2] offers the responsibilities and generic aspects of surveillance programs of the facility operators and regulatory body; IAEA Safety Reports Series No. 64 [ 3] provides detailed descriptions of the actual design and operation of the environmental monitoring program that comprised monitored materials, radionuclides, and frequencies. In South Korea, the Nuclear Safety Act, Article 104 (Preservation of Environment) stipulates that the installer or operator of facilities shall conduct the survey of radiation environment and the evaluation of the environmental impact for the surroundings of the facilities; Article 104, Clause 2 stipulates that a regulatory body will perform the verification surveillance to confirm and evaluate the surveillance results conducted by the facility operator. For this, the Nuclear Safety and Security Commission (NSSC) entrusted the Korea Institute of Nuclear Safety (KINS) to perform the surveillance of the surroundings of nuclear power utilization facilities in South Korea. A total of seven nuclear power utilization facilities in South Korea including four nuclear power plant sites in Kori, Wolsong, Hanul, and Hanbit, the nuclear fuel fabrication and nuclear power research facility in Daeduk, and the radioactive waste disposal facility in Gyeongju. The environment media, radionuclides, measurement frequency, and assessment for the verification surveillance are designed based on the NSSC Notification No. 2017-17 (the Regulation on Survey of Radiation Environment and Assessment of Radiological Impact on Environment in Vicinity of Nuclear Power Utilization Facilities) [ 4]. In the US and the UK, the government does not conduct verification surveillance; instead, it reviews and discloses the results of the assessments conducted by the operator. In Canada, the Radiation Protection Bureau of Health Canada [ 5] prepares the annual reports on the surveillance results, and in China, the Radiation Monitoring Technical Center prepares the annual reports on the surveillance results conducted by the Department of Environmental Protection in each province where power plants are located [ 6]. South Korea began the environmental radiation surveillance around the Gori nuclear power plant Unit 1 for the first time in 1977, and since 1983, detailed, government-led surveillance has been performed. Along with the expansion of nuclear power utilization facilities, the surveillance scope targets have gradually increased. The governmentŌĆÖs surveillance results are open to the public as annual reports; these reports include the verification of the reliability of the operatorŌĆÖs surveillance results as compared with two results and the assessment of environmental impact by the facility operation based on the surveillance results. However, these reports were limited in the in-depth interpretation of the data at the research level, such as the long-term accumulation trends of each radionuclide, short-term fluctuation, and the relationships between radionuclide using the radioactivity concentration.
Therefore, this research used only detected radionuclides in the environmental radioactivity in the annual report on ŌĆ£The Environmental Radiological Surveillance Assessment around the Nuclear Facilities in 2017ŌĆØ [ 7] published by KINS, and studied for the short-term and long-term fluctuations of these radionuclides and the comparison with previous yearŌĆÖs results, and the origin of each artificial radionuclides using the radioactivity concentration ratio between them. This research will be available in the evaluation of the environmental impact of the surroundings of nuclear power utilization facilities at nuclear or radiation emergency situations.
Materials and Methods
Table 1 shows the environmental radioactivity monitoring program around nuclear power utilization facilities, and the sampling points are described in detail in the annual report published by KINS [ 7]. The targets are generally divided into land samples and marine samples. Land samples include air, water, soil, and agricultural product, and marine samples include seawater, seabed sediment, fish, and seaweed. The sampling points, preprocessing, and chemical separation methods of samples are described in detail in the reports; this study briefly describes the measuring samples preparation and measurement methods per radionuclide.
Gamma-radionuclide analysis: Soil, riverbed, and seabed sediments were dried, ground, and filled into the measurement container (D6H4) made by KINS. For seawater and underground water, ╬│-radionuclides were isolated from them using AMP (ammonium phosphomolybdate) and MnO2 coprecipitation method and filled into D6H4. The agricultural product samples were turned to ash in an electronic furnace at 450┬░C, and the ash was filled into D6H4. The precise ╬│-radionuclide analysis was performed using high purity germanium (HPGe) ╬│-radionuclide spectrometry and a multichannel analyzer. Radiostrontium (90Sr) analysis: From the dried inorganic samples and ash sample, metallic elements were leached using strong acid treatment, and chemical and ion-column separation method were used to isolate Sr. For marine samples, the coprecipitation method with carbonates and oxalate was used, and Sr was purified using fuming nitric acid. The purified Sr in the form of strontium nitrate (Sr(NO3)2) crystal that were melted with ultrapure water and stand for 14 days to make equilibrium between 90Sr and 90Y, and an ultra low-level liquid scintillation counter (LSC, LKB, Quantulus 1220) was used to measure the Cherenkov radiation from 90Sr. Plutonium (Pu) analysis: Using acid, metallic elements were extracted from the small amount of samples (inorganic sample: 4 g, ash sample: 10 g), and Pu was purified using the TEVA (EiChrom) extraction chromatography. The amount of seawater sample (~20 kg) was reduced via Fe(OH)3 coprecipitation and Pu was purified using the same method as the inorganic sample. The isolated Pu was further purified using extraction chromatography to minimize the effect of interference elements. The final Pu solution was measured using the multi-collector inductively coupled plasma mass spectrometry (MC-ICPMS, NEPTUNE, Thermo Scientific, Germany) through the sample introduction system including the desolvation equipment (ARIDUS-II, Cetac Technologies, USA) inside. Tritium (3H) analysis: Tritium in the air was collected for one month with the automatic air sampling device having the molecular sieve (5 ├ģ) column inside. The column was heated for over two hours at 450┬░C in the horizontal tube furnace, and the recovered tritium was moved to the distillation process to remove organic materials in the solution. Tritium was then put in the Teflon measurement container, and the scintillator (Ultima gold LLT, Packard, USA) was added and measured with an ultra low-level LSC. For pine needles and milk samples, a freeze dryer was used to extract the tissue free water, and the dried samples were used to extract the organic bound water. Water was directly distilled and measured in the same way as the air sample. Radiocarbon (14C) analysis: CO2 in the air was collected for one month along with tritium in the same air sampling device. Using the horizontal tube furnace, the CO2 collected in the molecular sieve (5 ├ģ) column inside the collection device was heated for over two hours at 450┬░C, and the extracted CO2 was dissolved into the ammonia solution (NH4OH). Calcium chloride (CaCl2) was added to the ammonia solution to synthesize calcium carbonate (CaCO3) precipitate. For pine needles and milk samples, free water was completely removed using a freeze dryer, and using a high-pressure bomb, CO2 was collected from the dried samples and CaCO3 was synthesized using the same method as the air sample. The retrieved CaCO3 was mixed very slowly with HCl to evolve CO2 from the CaCO3, and CO2 was trapped into absorber (CarboSorb E, Packard Bioscience B.V.) and mixed with a scintillator (PermaFluor E+, Packard Bioscience B.V.) for measurement using LSC.
Results and Discussion
1. Cesium-137 (137Cs) results
The 2017 results showed that radioactive cesium ( 137Cs) and radioactive iodine ( 131I) among the ╬│-radionuclides were detected in some samples, and the other artificial ╬│-radionuclides shown in Appendix 1 of the Notification of NSSC [ 4] were not detected. The detection percentage of 137Cs in soil, seabed sediment, fish, and seawater samples was 32%, 13%, 90%, and 98%, respectively, and 131I was detected in few seaweed samples. The detection percentage in the seabed sediment was lower than that in the soil sample because the seabed sediments collected at the nuclear power plantsŌĆÖ (NPP) intake and discharge area, except in Kori, had a higher percentage of sand than in soil and accordingly, the content of the organic materials and clay that contribute to 137Cs absorption is low. Since the detection of these radionuclides depends on their minimum detectable radioactivity concentration (MDC) that relies on the sample amounts in the analysis and the equipment capability in the measurement, the detection itself does not imply the existence of the radionuclides in the samples. The MDC of soil, seabed sediment, fish, and seawater was <0.80ŌĆō<2.58 Bq┬Ękg-dry ŌłÆ1, <0.56ŌĆō<1.91 Bq┬Ękg-dry ŌłÆ1, <3.72ŌĆō<65.2 mBq┬Ękg-fresh ŌłÆ1, and <1.36ŌĆō1.69 mBq┬Ękg ŌłÆ1, respectively. Shown in Figure 1 is the 137Cs analysis results in the soil and seabed (riverbed) sediments, and the soil results in 2017 (<0.80ŌĆō9.47 Bq┬Ękg-dry ŌłÆ1) were within the normal fluctuation of 0.89ŌĆō11.1 Bq┬Ękg-dry ŌłÆ1 for the last five years without any drastic change in the surrounding regions of the five NPPs. This was similar to the concentration range (<0.65ŌĆō20.1 (Jeju) Bq┬Ękg-dry ŌłÆ1) in the soil (top layer) at the 15 regional radioactivity monitoring stations in 2017 [ 8]. 137Cs in the seabed sediments was detected in only Kori, including the New Kori, and the range of the concentration was very low with <0.67ŌĆō2.95 Bq┬Ękg-dry ŌłÆ1 that was within the concentration variation in the last five years at 0.92ŌĆō2.50 Bq┬Ękg-dry ŌłÆ1. Meanwhile, 137Cs was detected above MDC (~1 mBq┬Ękg ŌłÆ1) in most seawaters and the concentration was within 1.36ŌĆō2.23 mBq┬Ękg ŌłÆ1. The low MDC obtained by applying a large number of samples (approximately 60 kg) and the long measurement time (80,000 seconds). Owing to the homogeneity characteristics of the seawater sample, there was little variation in the concentration between the sampling point, and the results in 2017 were similar to those of the previous years. However, the results of the six species of fish (a total of 28 samples) were ranged from <22.2 to 196 (Spanish mackerel) mBq┬Ękg-fresh ŌłÆ1 ( Figure 2), but that in all seaweeds were below MDA (37.2ŌĆō97.6 mBq┬Ękg-fresh ŌłÆ1). The mean enrichment coefficient calculated by the average radioactivity concentration in the seawater and fish collected around NPPs (n=23) was 59, and it was ranged between 9 and 109. This result was within the enrichment coefficient (mean=39; range 6ŌĆō105; n=90) [ 9] presented in the annual report of the Korean marine environments surveillance for five years (2005ŌĆō2009) and the reported value (mean=84; range 5ŌĆō1,800; n =1,812) by the IAEA [ 10].
2. Strontium-90 (90Sr) results
As shown in Figure 3, the 90Sr concentration range in the soil in 2017 was <0.17ŌĆō0.94 (mean: 0.51) Bq┬Ękg-dry ŌłÆ1, which was within the last five yearsŌĆÖ concentration range of 0.11ŌĆō2.19 Bq┬Ękg-dry ŌłÆ1, and the detection percentage above the MDC (0.17 Bq┬Ękg-dry ŌłÆ1) was approximately 76%. The concentration range in the seabed sediments was <0.10ŌĆō0.32 (mean: 0.23) Bq┬Ękg-dry ŌłÆ1, which was about one-third of that of the soil sample. It is assumed that such a difference in concentration was because of the physio-chemical properties of the soil and seabed sediments as in the 137Cs results. In the seawater samples collected from the intake and discharge of the five NPPs, 90Sr was above MDC (~0.4 mBq┬Ękg ŌłÆ1), and the concentration range was 0.58ŌĆō1.32 mBq┬Ękg ŌłÆ1, which was similar to the results (0.64ŌĆō1.37 mBq┬Ękg ŌłÆ1) obtained in the 2017 Korean marine survey [ 11]. There was no large difference in the concentration between plant sites, and the 90Sr concentration in 2017 was within the normal fluctuation.
3. Plutonium results
Plutonium was detected in all soil, seabed (riverbed) sediment, and seawater samples; this was because of the considerably low MDC owing to the use of MC-ICPMS that offers extremely high measurement sensitivity. MDC in the soil and seabed sediment was ~5 mBq┬Ękg ŌłÆ1 and that in the seawater was ~0.1 ╬╝Bq┬Ękg ŌłÆ1. In addition, by detecting 239Pu and 240Pu using MC-ICPMS, the atom ratio between them could be determined, and thereby, Pu origin could be estimated. In 2017, the average concentration in the soil and seabed (riverbed) sediment samples at the four NPPs was all within the normal fluctuation level, and except in Kori Power Plant, the concentration in the soil was higher than that in the seabed sediments ( Figure 4). The seabed sediments collected from the intake area of Kori 1 and Kori 2 NPP showed a higher value than the soil sample because of the absorption effect caused by the higher clay content than any other region and the sinking effect of Pu in the seawater. The average concentration of the Pu ( 239+240Pu) from the total 42 seawater samples was 5.2┬▒2.3 ╬╝Bq┬Ękg ŌłÆ1, which was within the fluctuation of the last five years and was similar to the result obtained through the marine environmental radioactivity survey [ 11]. For soil and riverbed sediments, the 240Pu/ 239Pu atom ratio ( Table 2) is similar to the atom ratio at 0.18 to 0.19 because of the global fallout caused by a nuclear test [ 12]. The Pu in the riverbed sediments in Daeduk originated from the atmosphere fallout, as opposed to the Pu in the marine samples, and therefore it was similar to the soil samples. Meanwhile, Pu atom ratios in the marine samples (seabed sediments and seawater) were over 0.22, except in the seabed sediments in Hanbit NPP, and such a high atom ratio was similar to that in the seawater in the Pacific region and seabed sediments around the Korean Peninsula in the past [ 13, 14]. It has been reported that the high Pu atom ratio in the marine samples was because of the contribution of close-in fallout Pu from nuclear weapons tests conducted at the Pacific Proving Grounds that had a different fission yield than the inland nuclear weapons tests, directly to the sea, and thus, it caused different ratio from the global fallout in the land [ 15]. Owing to the effect of the marine environments, the seabed sediments at the intake and discharge area showed a high atom ratio. However, in the case of the seabed sediments from the Hanbit NPP, the average atom ratio was 0.21, meaning that the sediments had high clay content, most of which are mixed with the land environmental substance. Such regional characteristics had also been observed in the atom ratio results ( Figure 5) in seawater in 2017 and for the last five years. The seawater collected at the Hanbit intake and discharge had a high content of fine clay particles, and because of the effect of some Pu eluted from it, its atom ratio was lower than the other seawater samples.
4. Iodine-131 (131I) results
The 2017 survey results showed that 131I was detected in some seaweed samples collected around the power plantsŌĆÖ intake and discharge, and MDC was <55ŌĆō<176 mBq┬Ękg-fresh ŌłÆ1. It was detected only in the gulfweed and sea trumpet collected in the sea near Kori and Wolsong, and it was not detected in Hanbit (gulfweed) or Uljin (sea mustard, gulfweed). The results from the last five years ( Figure 6) also showed that it had been detected in only Kori and Wolsong, and Kori had always shown a higher concentration of 131I than Wolsong. It showed the maximum concentration in 2013, and the concentration and the detection rate gradually decreased, and for the last six years, the detection percentage in Kori and Wolsong was 85% and 68%, respectively. In these seaweed samples, however, other gamma radionuclides and 137Cs were not detected, and 131I was not detected in the other environmental samples (underground water and seawater). It is assumed that this originated from the 131I used in medical applications in hospitals, and hence, 131I, medical-origin, artificial radionuclide, was reported in the intake water and effluent in the river near Kori sewage treatment facility as well as seaweed collected near plant [ 16]. Therefore, the relatively high detection of 131I in the seaweed samples near Kori was because of the effect of the 131I, contained in the effluent from the large sewage treatment facility near the NPP site. Meanwhile, it is evaluated that the continuous reduction of the 131I concentration and detection rate since 2013 was because of the strict control and improvement of the effluent management of 131I in hospitals.
5. Tritium (3H) and carbon-14 (14C) results
Figure 7 demonstrates that the 3H in the air near Wolsong NPP was higher than the other NPPs both in the 2017 survey result as well as in the last five yearsŌĆÖ reports; this was because of the operation of its heavy-water reactor, the 3H emissions were higher than the other plants that used light-water reactors by five to eight times. In the case of 14C, the emissions from Wolsong NPP were about twice higher than the others, but the difference in concentration was negligible, except for slightly high in Sangbong, Wolsong, in summer. Figure 8, illustrating the concentration variation in the air samples with direction near Wolsong NPP, shows the wind direction dependency (NEE>SSW) and seasonal variations. This trend was remarkable in 3H having a large emission and high mobility as compared to 14C. From the survey of the NPP emissions data in the last five years showed that the difference decreased owing to the reduction trend of gaseous 3H waste recently.
The analysis results of the water samples showed that 3H concentration in the rainwater sample from the inside of Wolsong NPP was considerably higher than in the water samples of the other NPPs (34.2ŌĆō482 Bq┬ĘL ŌłÆ1), which is resulting from the difference in the gaseous emissions at the plant. Figure 9 illustrates the 3H results in rainwater samples with distance and direction near Wolsong NPP. 3H concentration in rainwater exponentially decreased by distance, and compared to the previous data [ 17], the 2017 results showed the overall decrease in the concentration. The maximum concentration was 79 Bq┬ĘL ŌłÆ1 from the sample collected at the staff housing in February, which was significantly lower than WTOŌĆÖs drinking water guidance level 10,000 Bq┬ĘL ŌłÆ1 [ 18]. The concentration in underwater was as low as <MDCŌĆō3 Bq┬ĘL ŌłÆ1 that is significantly lower than rainwater because of the dilution and natural decay as rainwater flows down underground, and there was little difference between the NPPs. The 3H and 14C results in the pine needles near Wolsong NPP showed that only 3H collected in May in Sangbong, close to NPP, was 2.5 times higher than the annual average concentration. This is attributed to the influence of a higher monthly concentration of 3H in the air samples and seasonable factors, such as the seasonal wind direction and rainfall trends. However, 14C did not show any regional or seasonal differences because of low emissions and diffusions.
6. Radioactivity concentration ratio among 137Cs, 90Sr, and Pu
Figure 10 shows the comparison of the concentration ratio between radionuclides in the soil, seabed sediments, and seawater samples for the last five years. The average 137Cs/ 90Sr concentration ratio in soil and seabed sediments for the last six years, including the 2017 data, was 8.97┬▒6.90 and 7.08┬▒ 4.84, respectively. Considering the fluctuation of the concentration ratio in the environmental samples, these results had little difference compared to the previous results in soil (10.7┬▒6.62) [ 19] and the coastal seabed sediments (11.2┬▒ 2.9) [ 20] caused by global fallouts, which were surveyed in Korea in the past. The 239+240Pu radioactivity concentration ratio in relation to 137Cs and 90Sr in soil was 0.04┬▒0.02 and 0.43┬▒0.36, respectively, and that in the seabed sediments was 0.35┬▒0.18 and 2.1┬▒1.5, respectively; these results were higher than 239+240Pu/Cs (0.024┬▒0.004) and 239+240Pu/Sr concentration ratios (0.24┬▒0.13) [ 19] in Korean soil, surveyed in 1994, and it is believed that this is because of the concentration reduction mainly by the natural decay of 137Cs and 90Sr. In the case of the coastal seabed sediments, the concentration of Pu was higher than in soil because of the sinking of a particle-reactive Pu in seawater and the input from the land owing to natural erosion. Meanwhile, the 137Cs/ 90Sr concentration ratio in seawater in 2017 was 2.40┬▒0.91, and the 239+240Pu/ 137Cs and 239+240Pu/ 90Sr concentration ratios were 3.88┬▒2.67 and 7.08┬▒4.12, respectively. Compared to the survey data in the past, seawater is less affected by the sampling location than soil, and therefore, there was little difference in the deviation between concentration ratio and sampling sites. The concentration ratios in these radionuclides in seawater were similar to the previous results surveyed from the East Sea [ 21, 22], and thus, it is believed that these radionuclides might have originated from previous nuclear tests or nuclear plant accidents.
Conclusion
This study is significant in the assessment of the short- and long-term concentration fluctuation and evaluation of the source contribution by concentration ratios analysis between these radionuclides for anthropogenic radionuclides detected above MDC in the result of the environmental radiological surveillance around nuclear power utilization facilities in 2017. Among the ╬│-radionuclides, 137Cs was detected from some soil, seabed sediments, and fish samples. 131I was detected from seaweed samples near Kori and Wolsong NPP, but considering the sampling points and no detection of other artificial radionuclides, it was traced from medical applications. 90Sr was detected from most of the samples where 137Cs was also detected, and the radioactivity concentration of most of these radionuclides was low, which was just little over MDC, and all of them were within the normal fluctuation. Most of 137Cs, 90Sr, and Pu isotopes were detected from seawater for which the considerable amounts of sample were used, and all of them were within the normal fluctuation. The radioactive concentration ratio of these radionuclides in soil, seabed sediments, and seawater was similar to that of the global fallout caused by the previous nuclear tests. The Pu atom ratio (240Pu/239Pu) from the land samples was different from that in the marine samples, and it is believed that this is because of the close-in fallout Pu from the previous Pacific Proving Grounds nuclear weapons tests, as opposed to global fallout Pu in the land. The 3H concentration was relatively high in the samples near Wolsong NPP (air, rainwater), and compared to that of 3H, the 14C concentration did not show much difference between NPPs, and the concentration was similar to the previous year. 3H in pine needle showed the concentration difference by distance and wind direction from NPPs due to its gaseous emissions. Most of the 2017 survey results were below MDC, and the concentration of artificial radionuclides detected was within the normal fluctuation and did not show any extraordinary results. It is expected that the outcomes of this study will be available in the verification of the surveillance results conducted by the operators of nuclear power utilization facilities and the assessments of the environmental impact in the vicinity of NPPs in case of the leakage of radioactive materials.
References
1. International Atomic Energy Agency. Radiation Protection and Safety of Radiation Sources: International Basic Safety Standards. IAEA GSR Part 3. 2014.
2. International Atomic Energy Agency. Environmental and Source Monitoring for Purposes of Radiation Protection. IAEA RS-G-1.8. 2005.
3. International Atomic Energy Agency. Programmes and systems for Source and Environmental Radiation Monitoring. IAEA Safety Reports Series No. 64. 2010.
4. Notice of the Nuclear Safety and Security. Notice of the Nuclear Safety and Security Commission no. 2017-17: Regulation on Survey of Radiation Environment and Assessment of Radiological Impact on Environment in Vicinity of Nuclear Power Utilization Facilities. 2017.
5. Health Canada. Environmental Radioactivity in Canada 1997ŌĆō2009. 2001.
6. Radiation Monitoring Technical Center. Annual Report of the National Radiation Environment. 2018.
7. Korea Institute of Nuclear Safety. The Annual Report on the Environmental Radiological Surveillance and Assessment around the Nuclear Facilities. KINS/AR-140. 2017;28.
8. Korea Institute of Nuclear Safety. Environmental Radioactivity Survey in Korea. KINS/ER-028. 2017;49.
9. Korea Institute of Nuclear Safety. Marine Environmental Radioactivity Survey. KINS/ER-092. 2010;6.
10. International Atomic Energy Agency. Handbook of Parameter Values for the Prediction of Radionucilde Transfer to Wildlife. IAEA-TECODC-479. IAEA. Vienna, 2014.
11. Korea Institute of Nuclear Safety. Marine Environmental Radioactivity Survey. KINS/ER-092. 2017;13.
12. Kelley JM, Bond LA, Beasley TM. Global distribution of Pu isotopes and 237Np. Sci of the Total Environ. 1999;237ŌĆō238:483-500.  13. Kim CK, Kim CS, Chang BU, Choi SW, Chung CS, Hong GH, Hirose K, Igarashi Y. Pu isotopes in seas around the Korean Peninsula. Sci Total Environ. 2004;318:197-209.  14. Kim CK, Kim CS, Chang BU, Choi SW, Chung CS, Hong GH, Hirose K, Pettersson HBL.
240Pu/ 239Pu atom ratios in the bottom sediments of the NW Pacific Ocean. J Radioanal Nucl Chem. 2003;258(2):265-268. 15. Hirose K, Aoyama M, Kim CS, Kim CK, Povinec PP. Plutonium isotopes in seawater of the North Pacific. 2006;8:67-82.
16. Korea Institute of Nuclear Safety. Nationwide Surveillance on the Environmental Radiation. KINS/RR-937. 2012;121-122.
17. Korea Institute of Nuclear Safety. The Annual Report on the Environmental Radiological Surveillance and Assessment around the Nuclear Facilities. KINS/AR-140. 2011;22:40-43.
18. International Atomic Energy Agency. Criteria for Radionuclide Activity Concentrations for Food and Drinking Water. IAEA-TECODC-1788. IAEA. Vienna, 2016.
19. Kim CS, Lee MH, Kim CK, Kim KH.
90Sr, 137Cs, 239+240Pu and 238Pu Concentrations in Surface Soils of Korea. J Environ Radioactivity. 1998;40:75-88. 20. Choi SW, Jin HG, Kim CS, Row JW, Kim CK, Rho BH. The Distribution of 137Cs, 90Sr and Pu isotopes in the Coastal Sediment of Korea. J Korean Association for Radiation Protection. 2002;27(2):101-110.
21. Hirose K, et al. Anthropogenic radionuclides in seawater in the East Sea/Japan Sea: Results of the first-stage Japanese-Korean-Russian expedition, J. Environ Radioactivity. 1999;43:1-13. 22. Ikeuchi Y, et al. Anthropogenic radionuclides in seawater of the Far Eastern Seas. Sci of the Total Environ. 1999;237ŌĆō238:203-212.
Fig.┬Ā1
Comparison of 137Cs concentration in soil and sediment samples with previous yearŌĆÖs data and NPP operatorŌĆÖs mean. 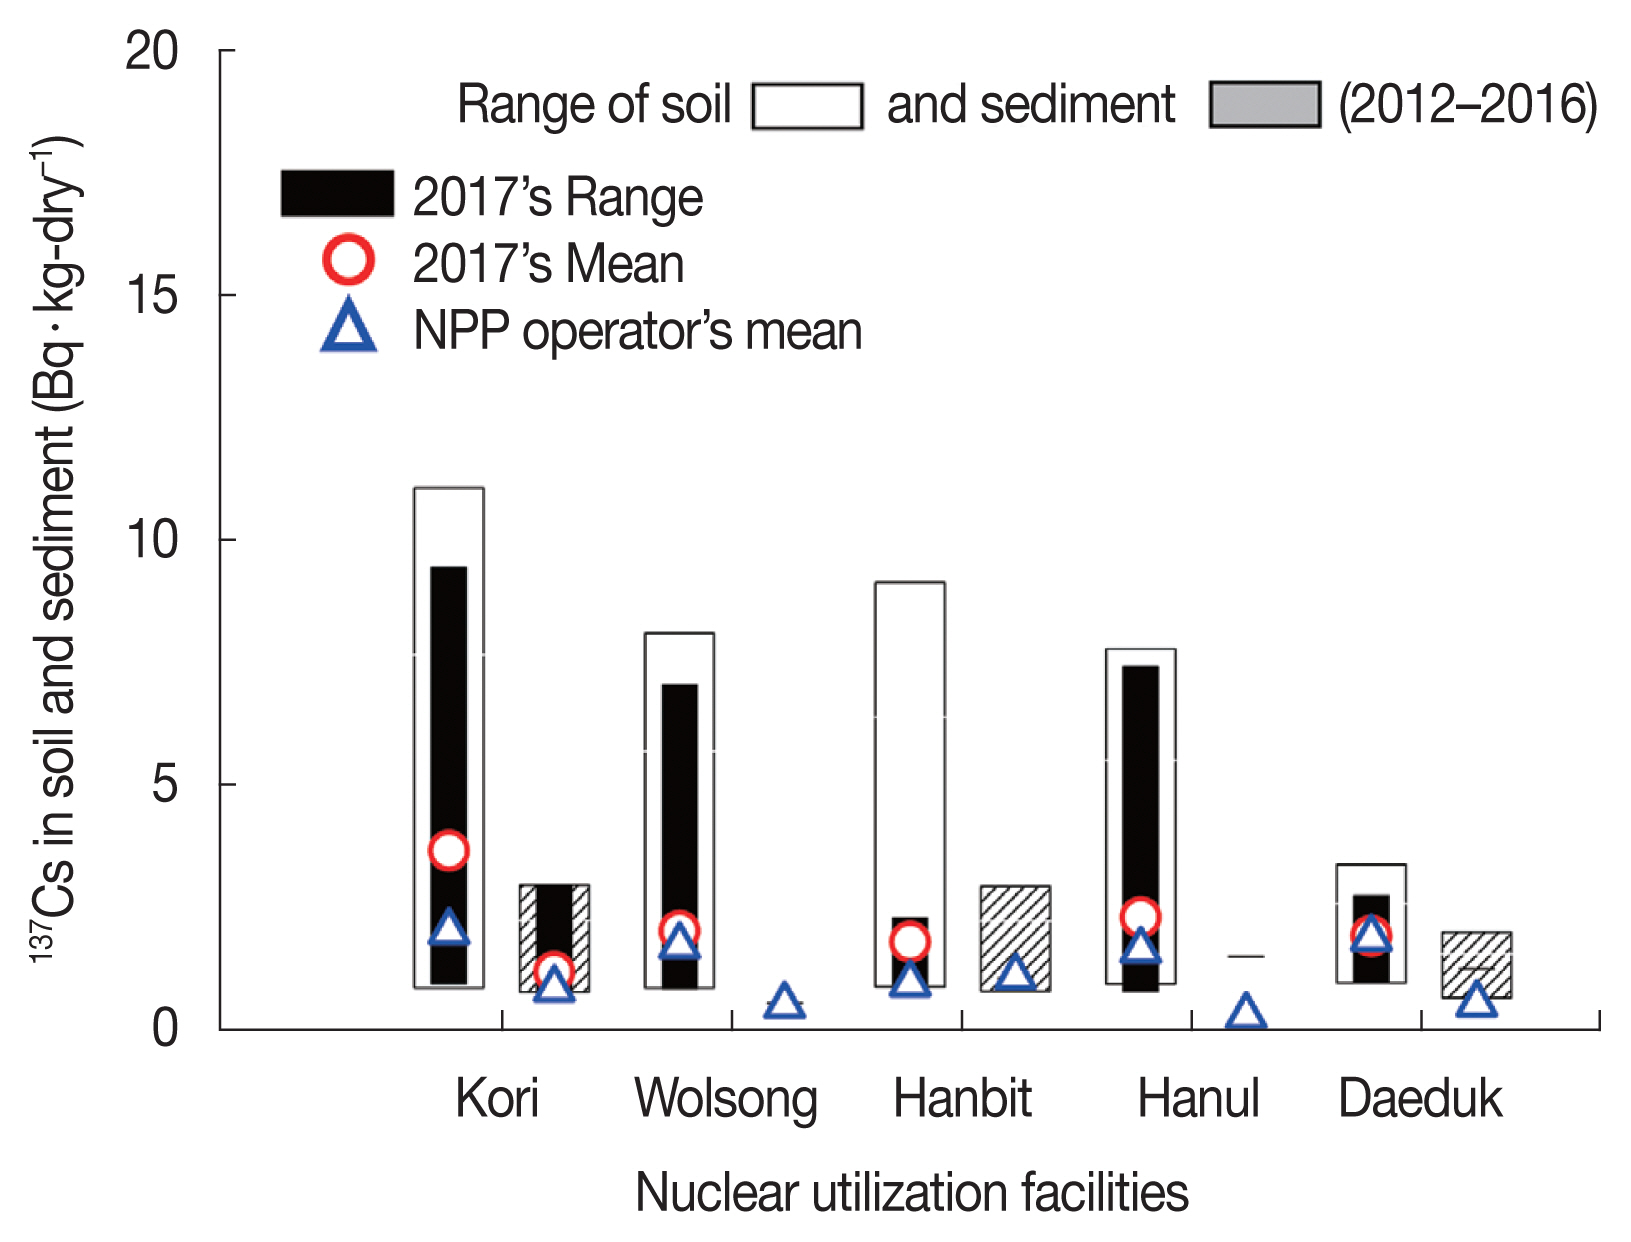
Fig.┬Ā2
Comparison of 137Cs concentration in fish and seawater samples with previous yearŌĆÖs data and NPP operatorŌĆÖs mean. 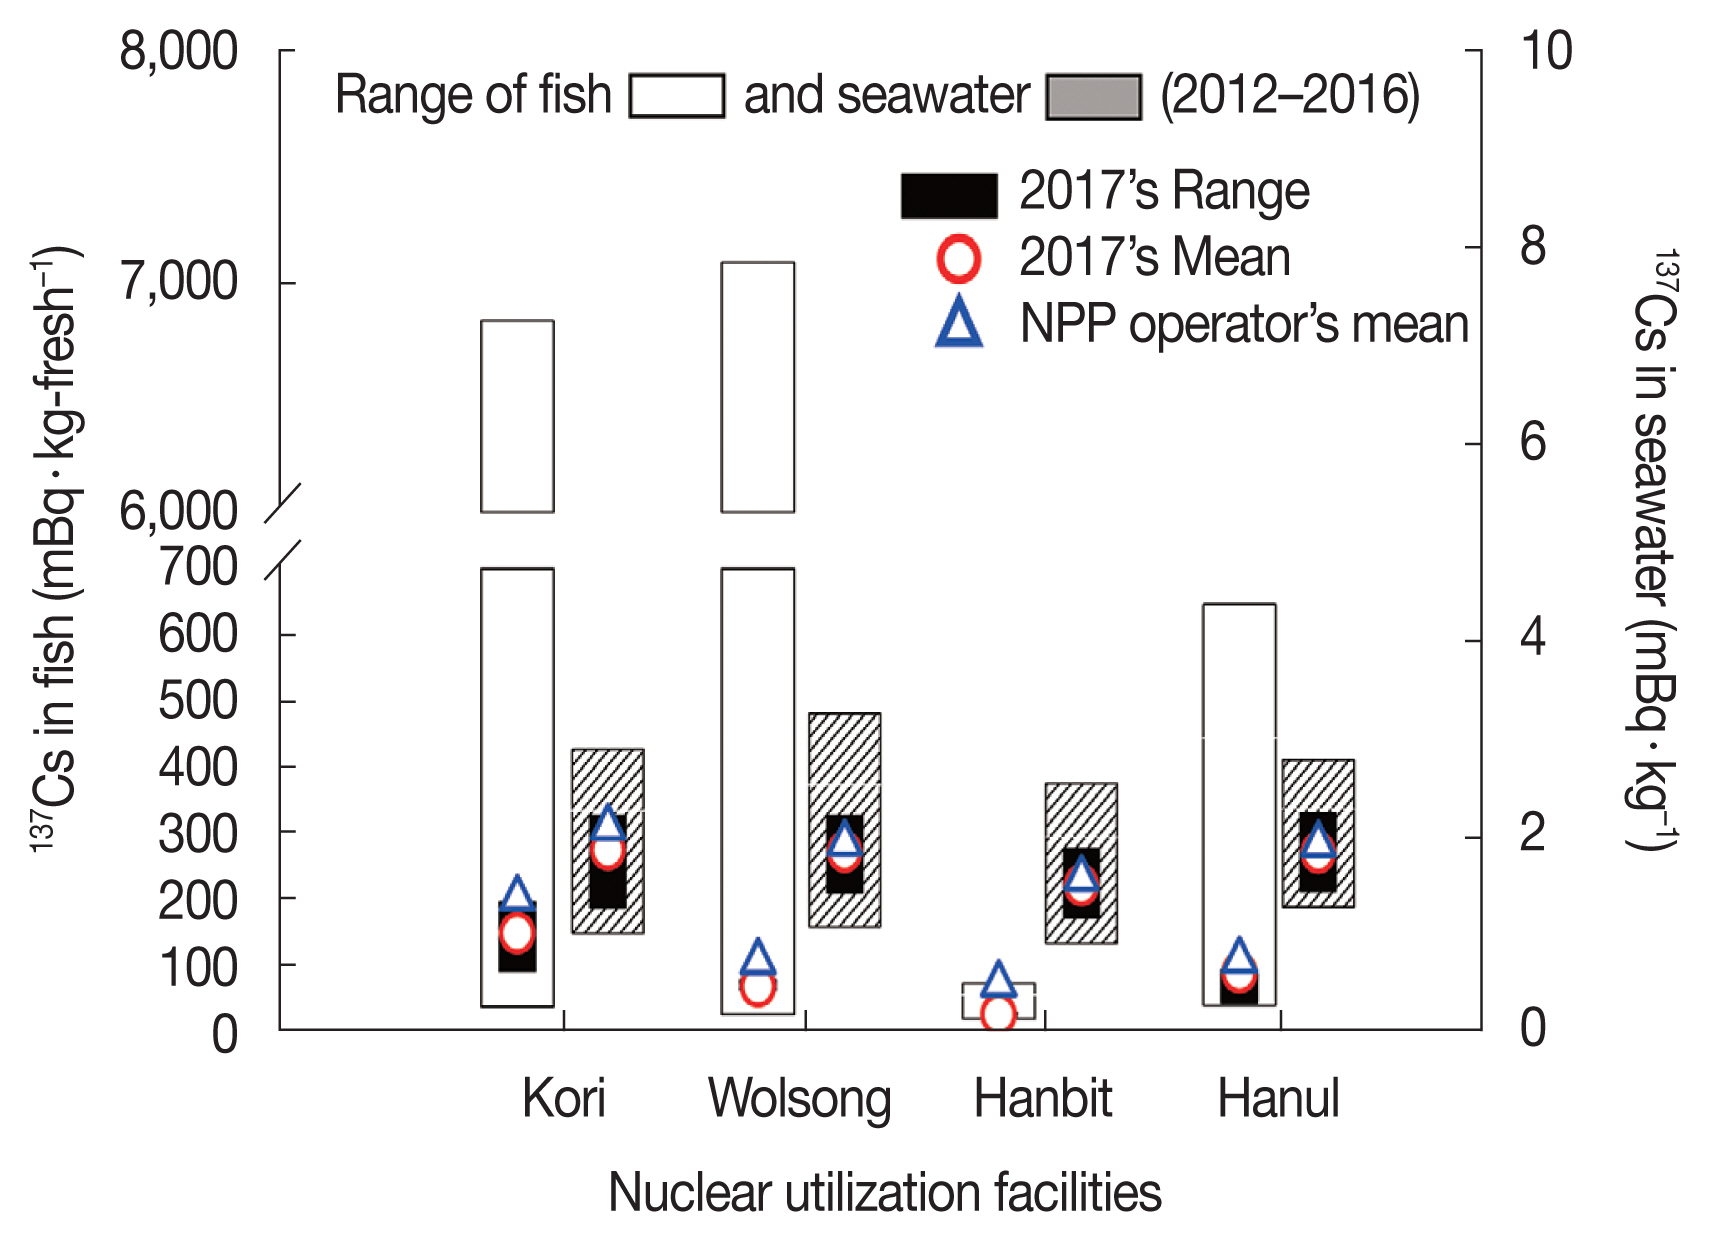
Fig.┬Ā3
Comparison of 90Sr concentration in soil and sediment samples with previous yearŌĆÖs data and NPP operatorŌĆÖs mean. 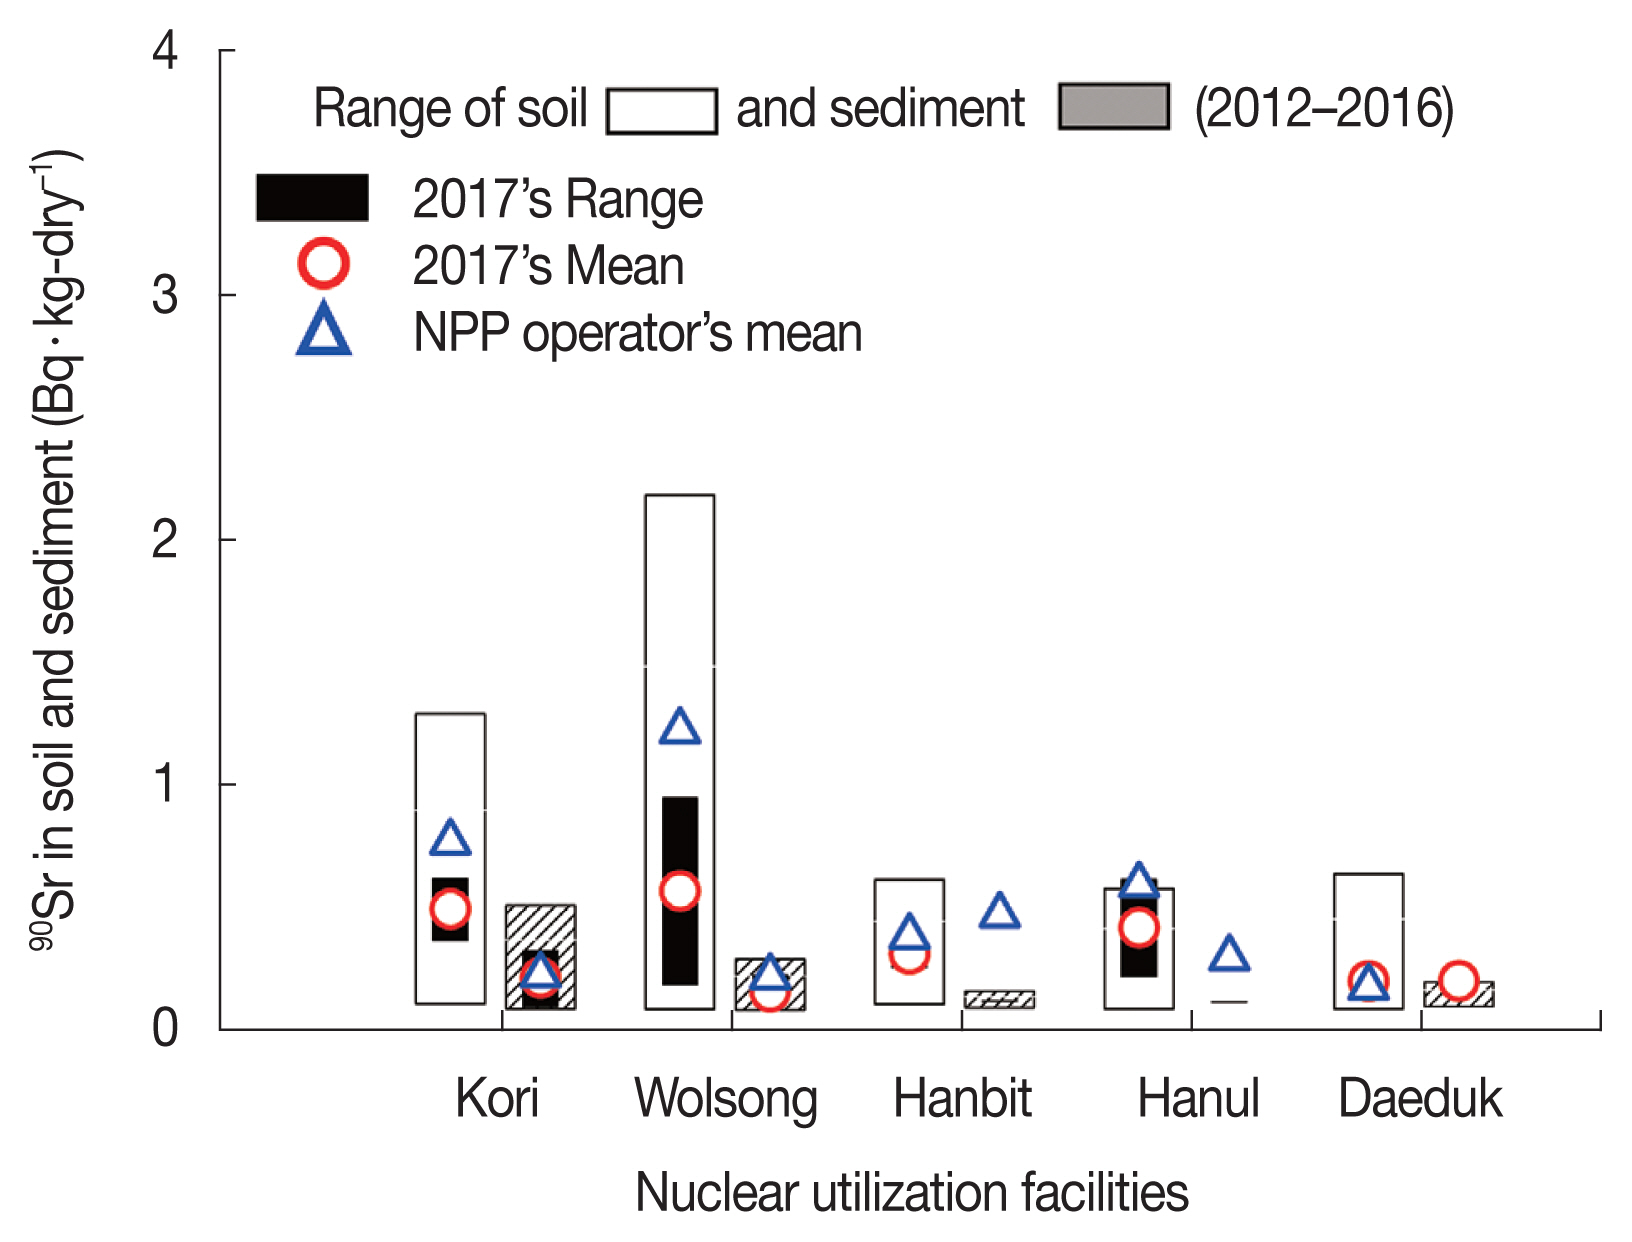
Fig.┬Ā4
Comparison of 239+240Pu concentration in soil and sediment samples with previous yearŌĆÖs data. 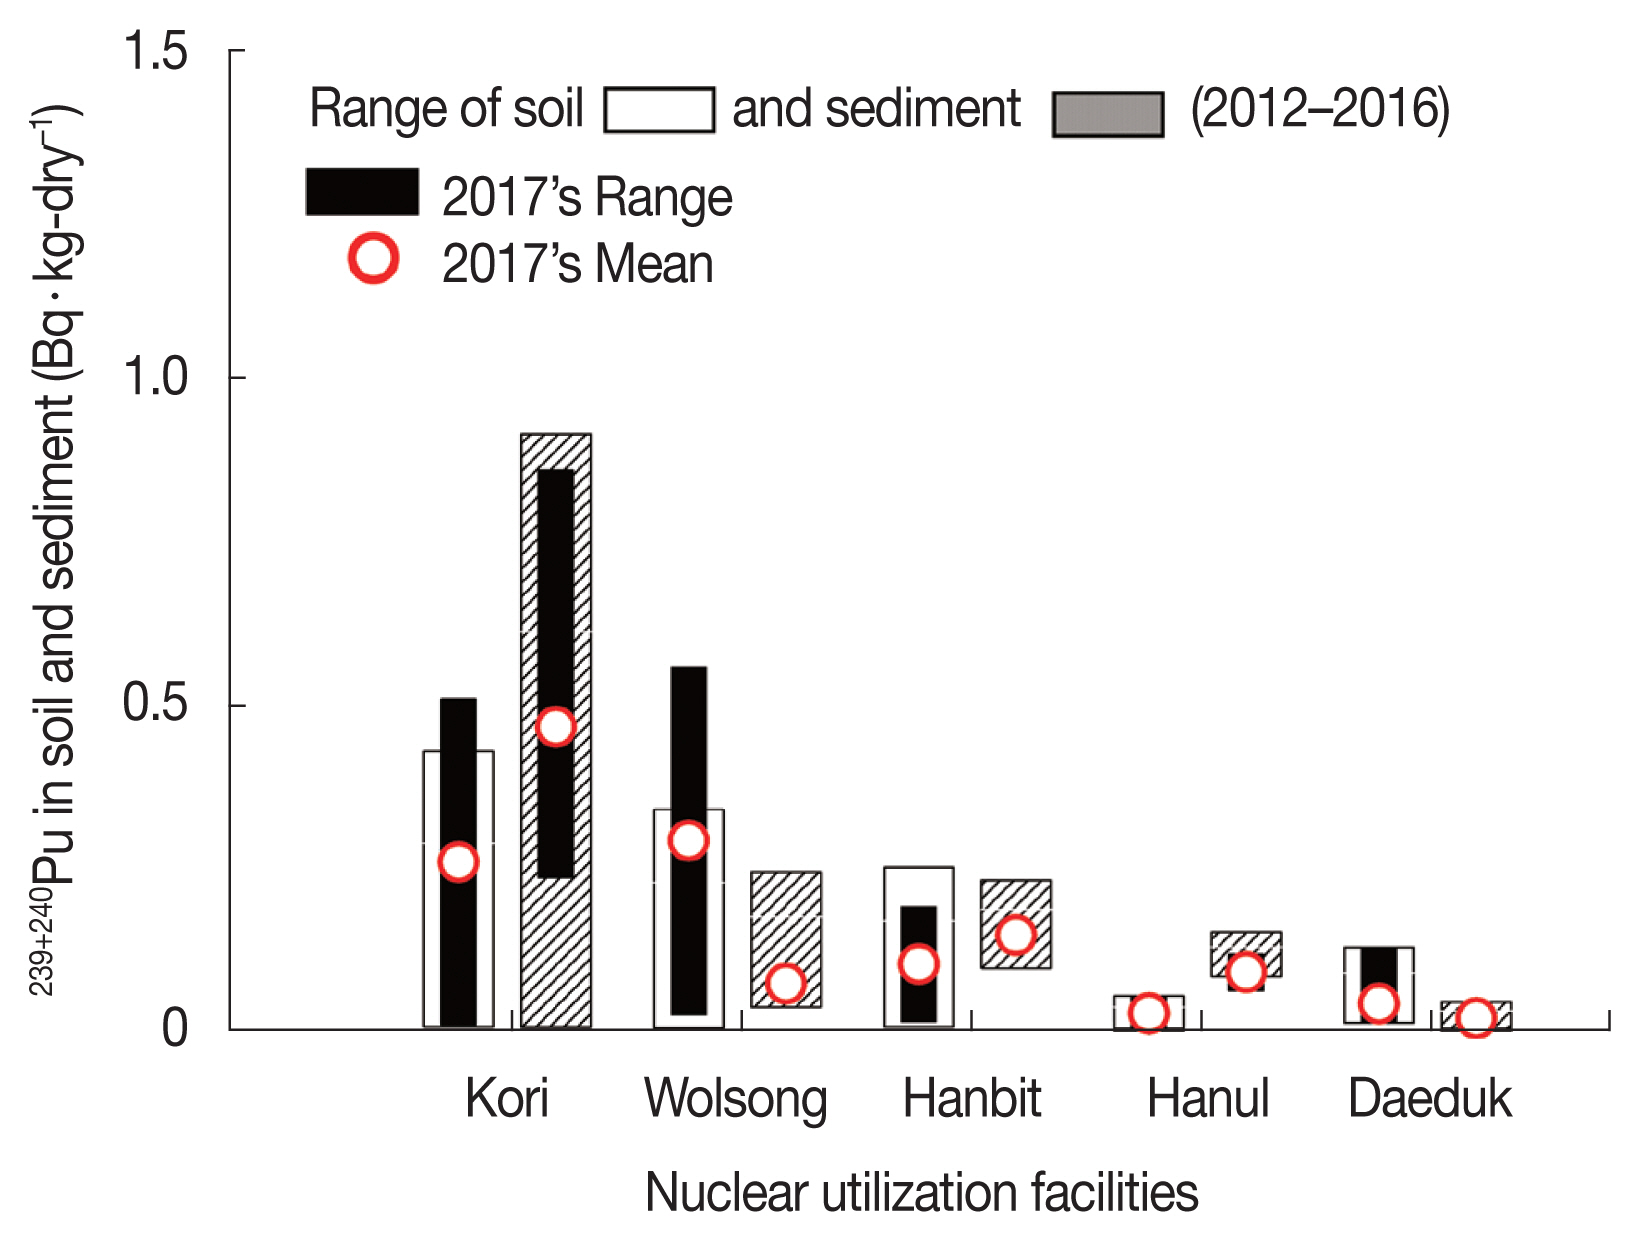
Fig.┬Ā5
Pu atom ratios variation with year in seawater samples collected around 6 nuclear facilities. 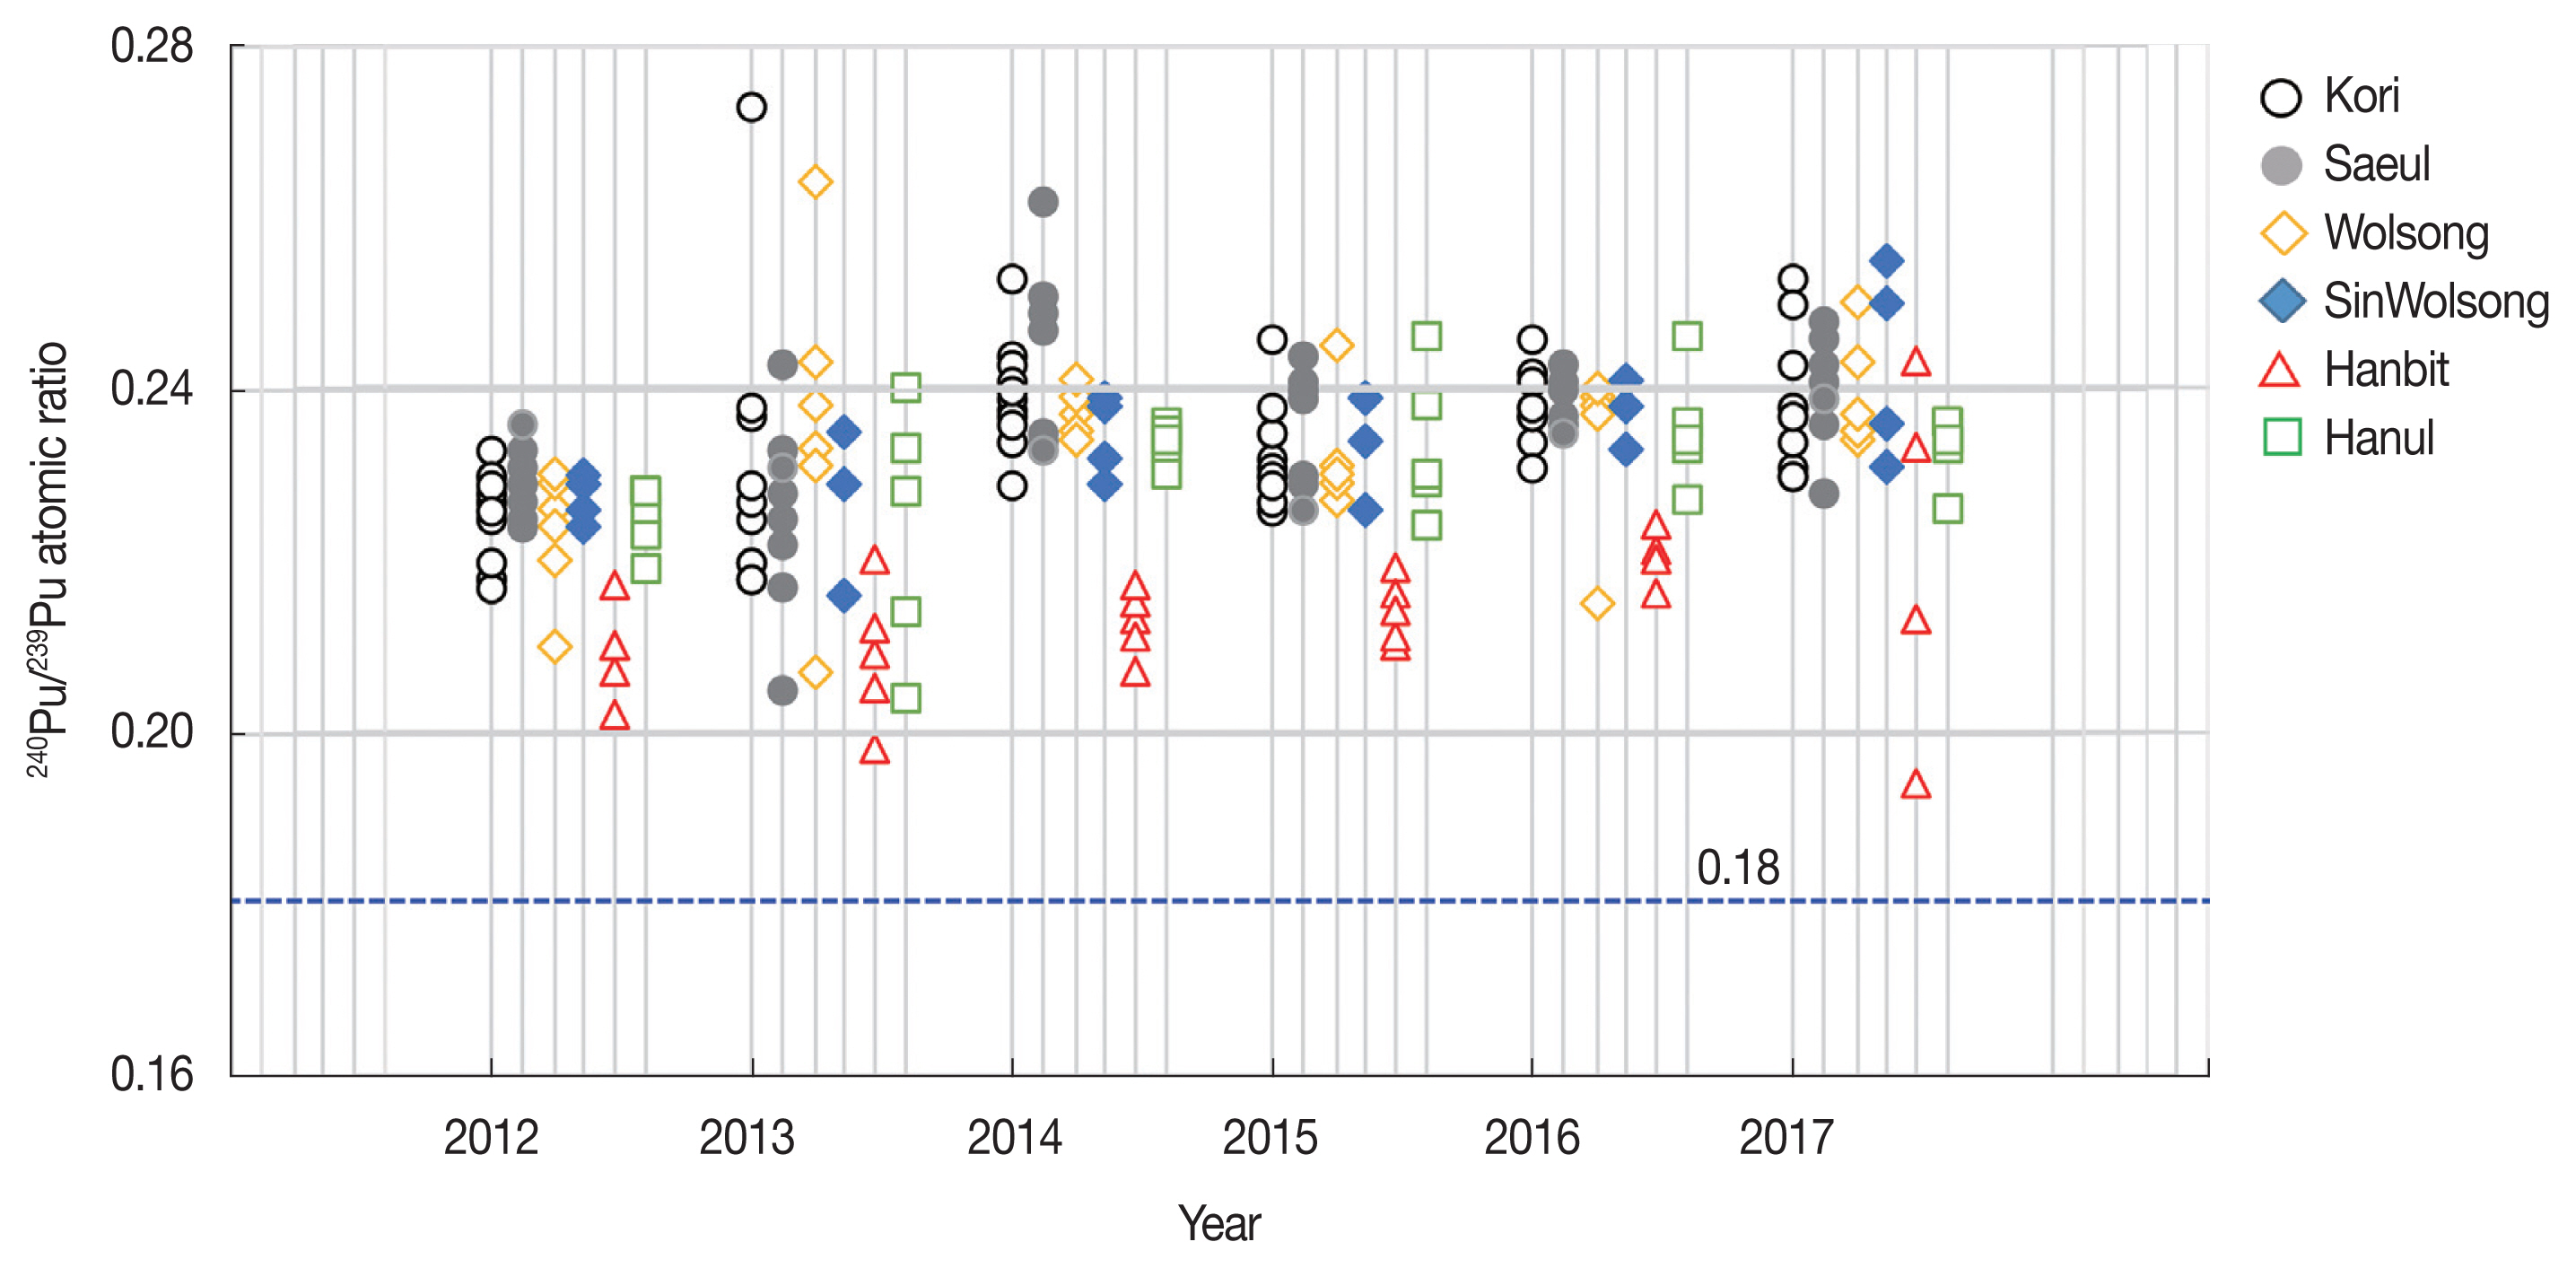
Fig.┬Ā6
131I concentration variation with year in seaweed collected near Kori and Wolsong NPP. 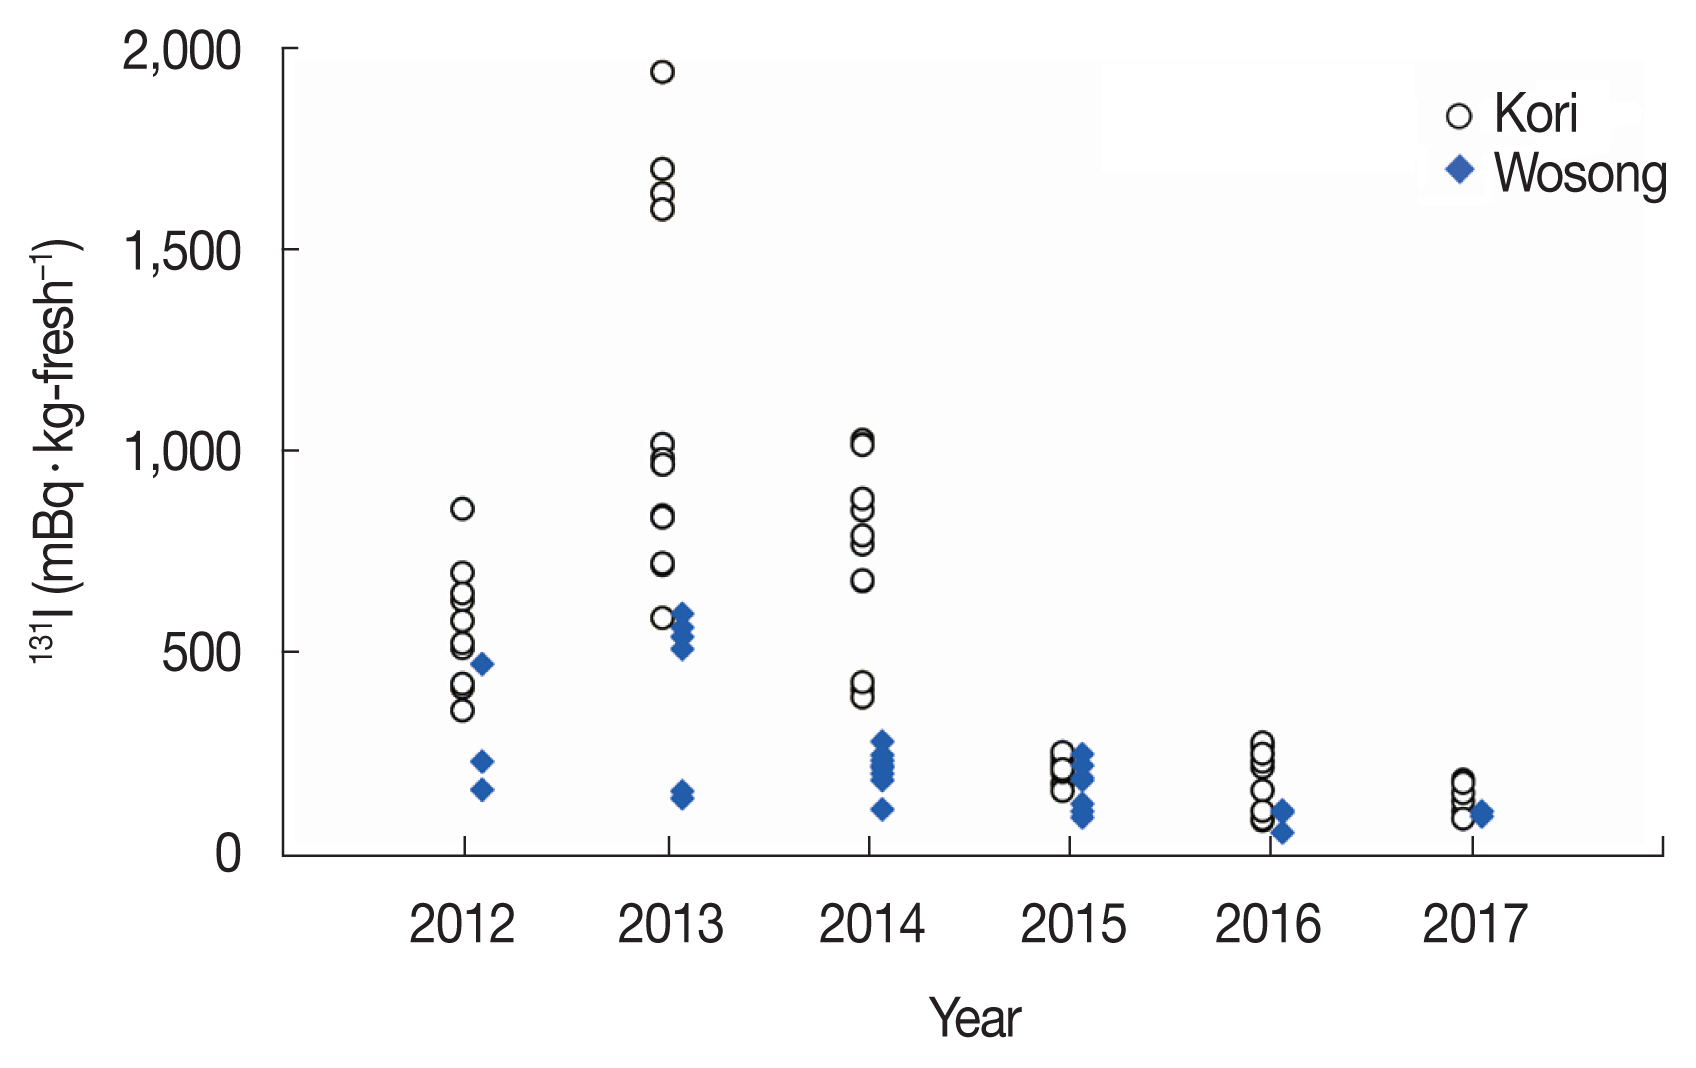
Fig.┬Ā7
Comparison of 3H and 14C in the air samples with previous yearŌĆÖs data and NPP operatorŌĆÖs mean. 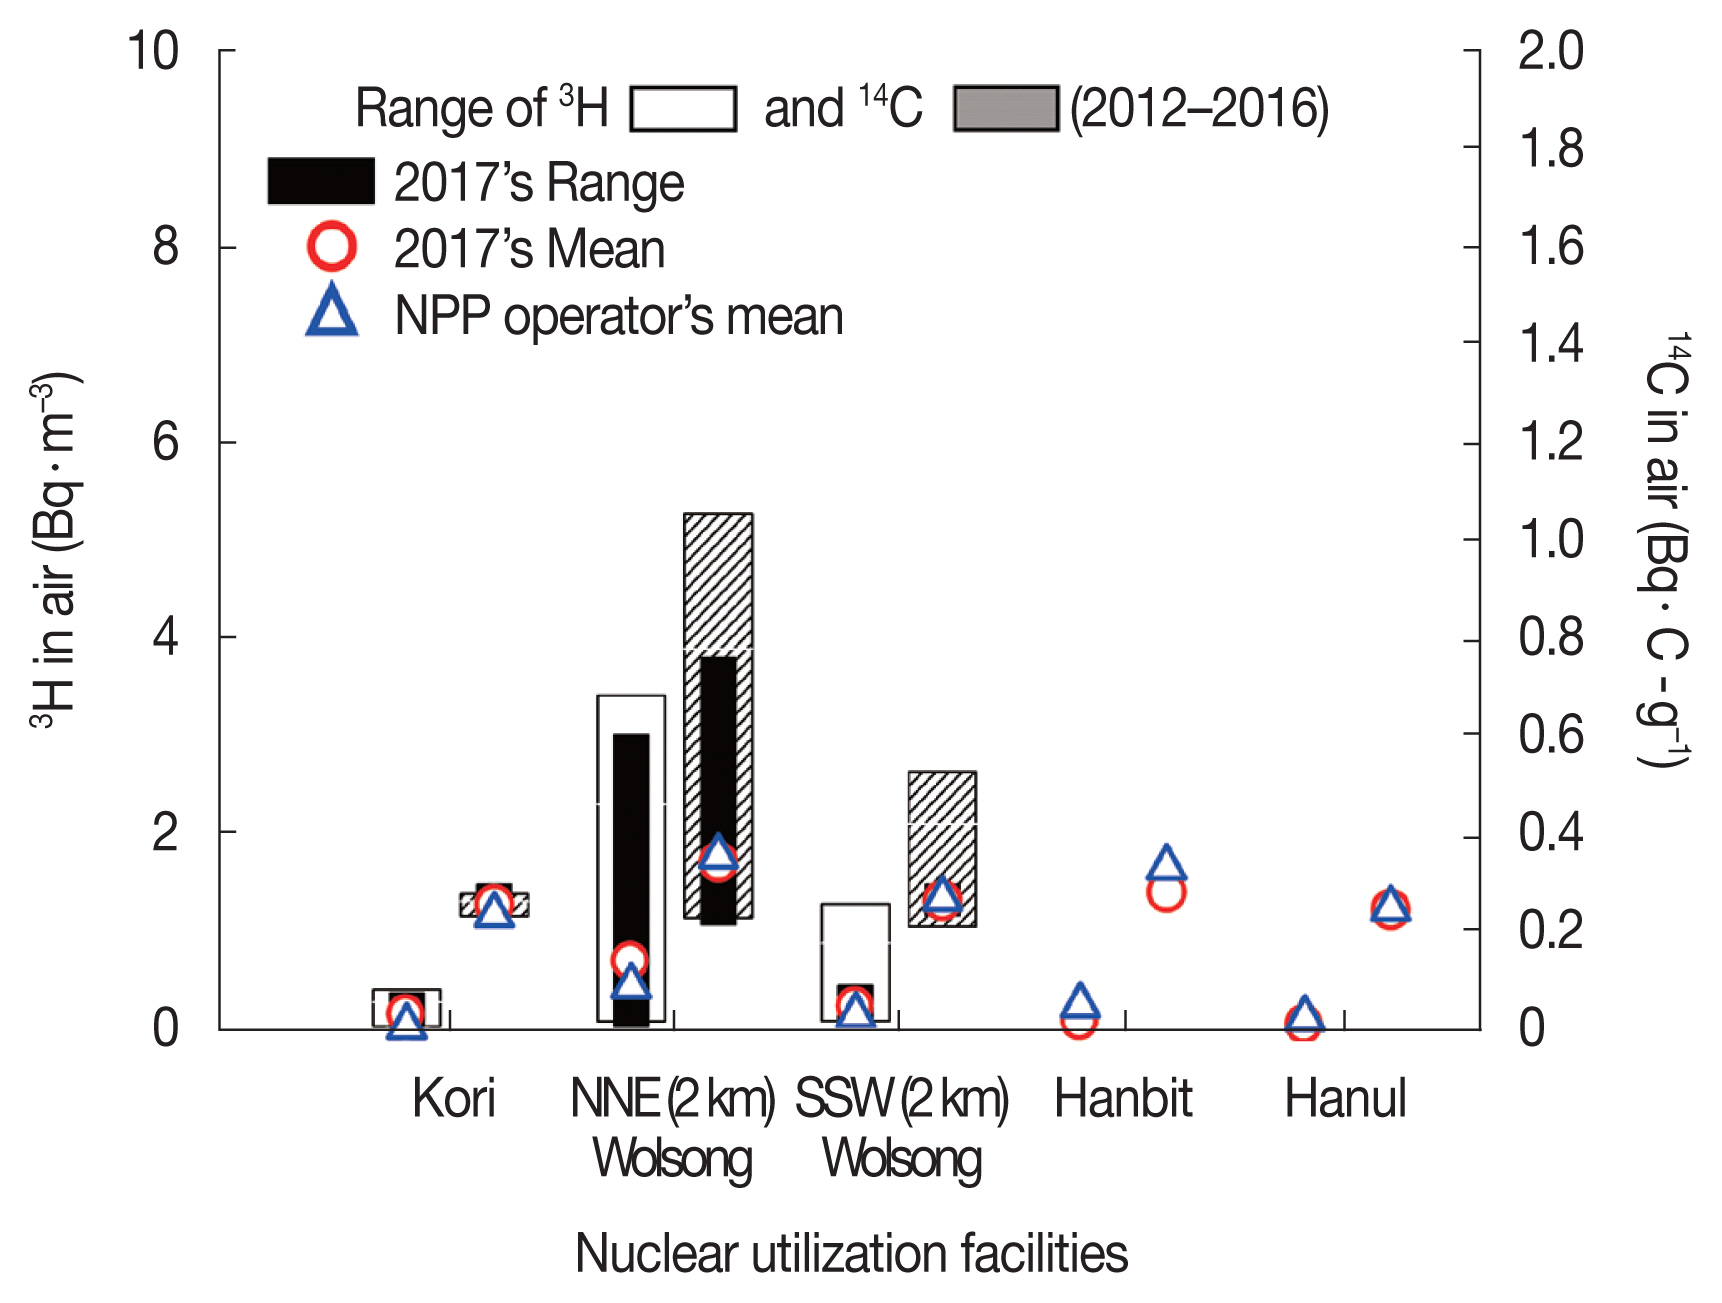
Fig.┬Ā8
Monthly variation of 3H and 14C in air samples with direction at Wolsong NPP. 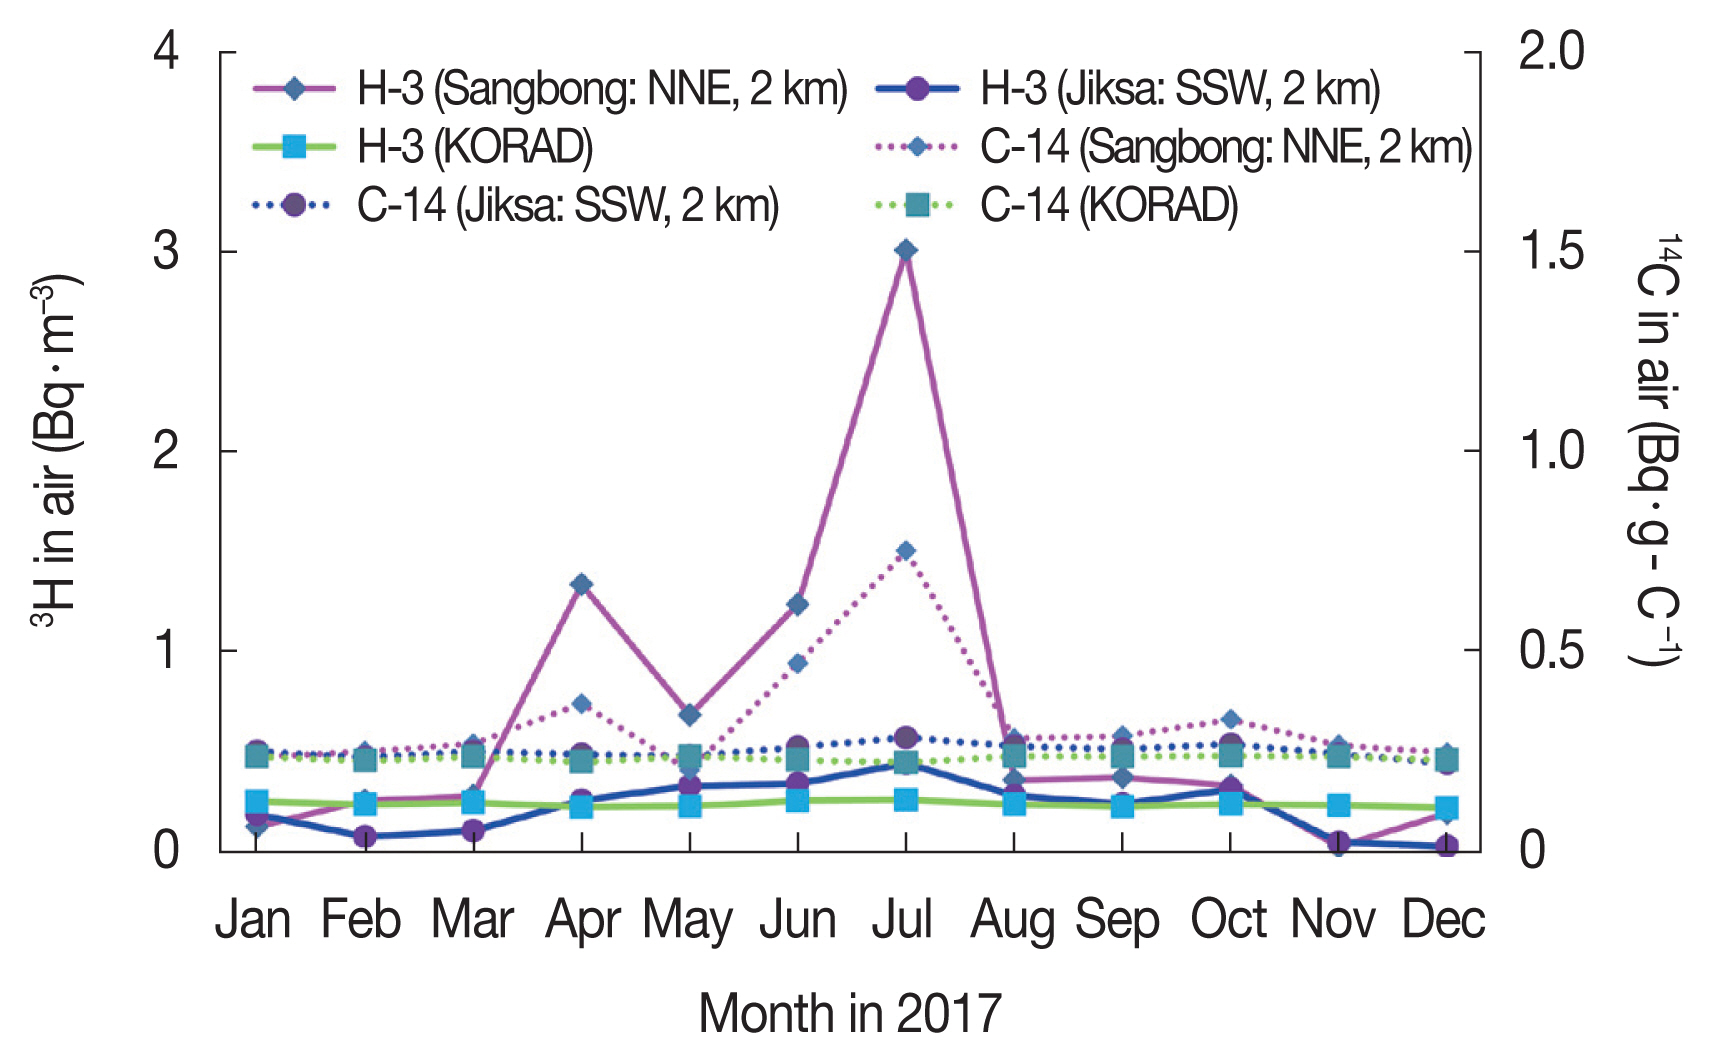
Fig.┬Ā9
3H concentration in the rainwater along distance from Wolsong NPP stack. 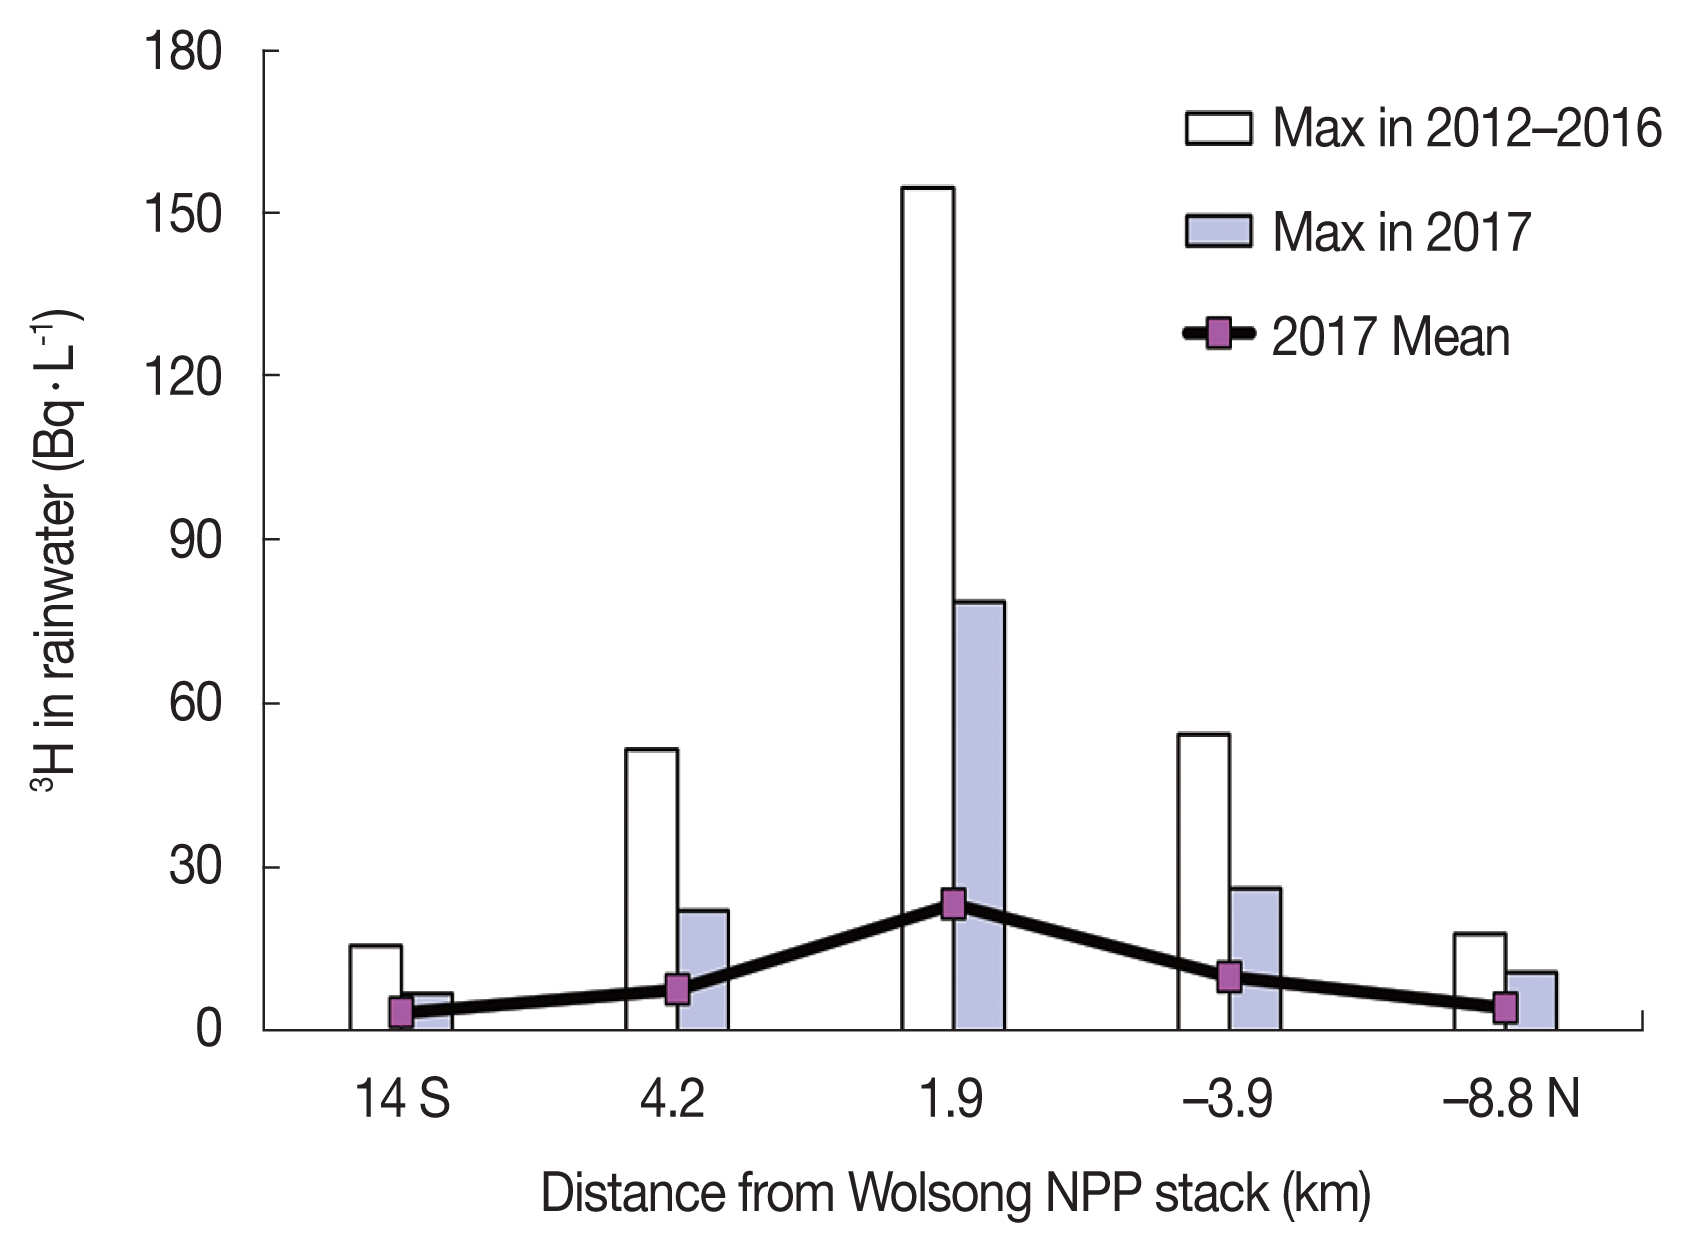
Fig.┬Ā10
Concentration ratios in anthropogenic radionuclides in soil (A), sediment (B), and seawater (C) samples in NPP sites. 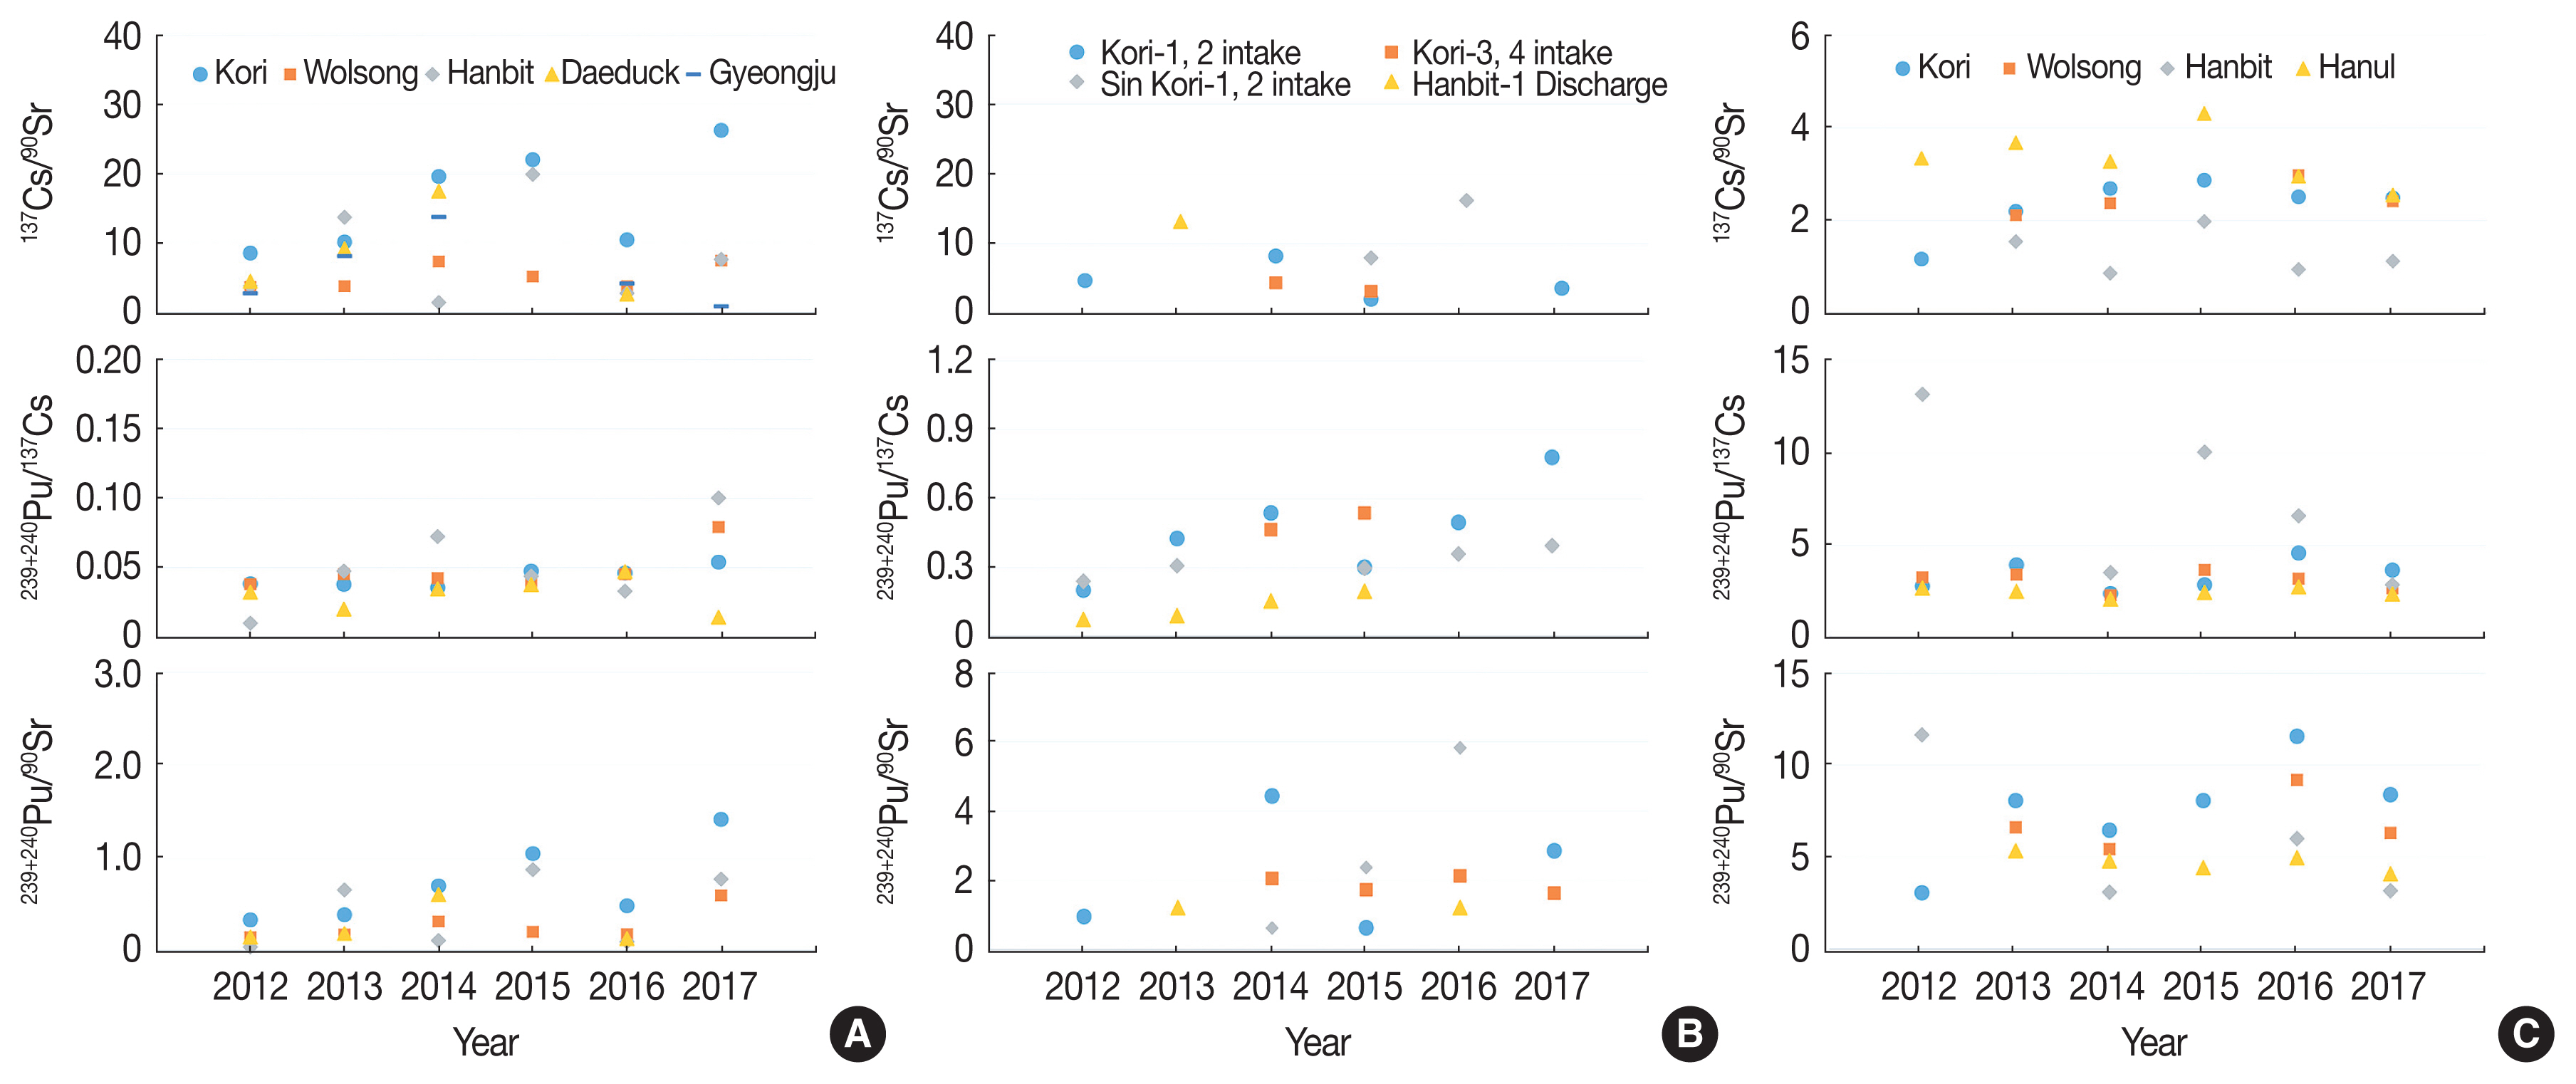
Table┬Ā1
Environmental Radioactivity Monitoring Program around Nuclear Power Utilization Facilities
|
Monitored constituents |
Analysis Items |
Frequency |
|
Air, deposition |
Soil |
Gamma RN |
Twice a year |
|
90Sr, 239Pu, 240Pu |
Yearly |
|
234U, 235U, 238U |
Yearly |
|
Sea and stream sediments |
Gamma RN |
Twice a year |
|
90Sr, 239Pu, 240Pu |
Yearly |
|
234U, 235U, 238U |
Yearly |
|
Air |
3H, 14C |
Monthly |
|
Pine Needle |
3H, 14C |
Monthly |
|
|
Water bodies |
Seawater |
Gamma RN, 3H |
Quarterly |
|
90Sr, 239Pu, 240Pu |
Twice a year |
|
Underground water |
Gamma RN, 3H, 90Sr, U, Pu isotopes, 99Tc |
Twice a year |
|
Surface water |
Gamma RN |
Quarterly |
|
Precipitation |
Gamma RN |
Monthly |
|
3H |
|
|
Foodstuffs |
Milk |
Gamma RN |
Quarterly |
|
Gamma RN |
Monthly |
|
90Sr |
Twice a year |
|
3H, 14C |
Monthly |
|
Leafy Vegetables |
Gamma RN |
Yearly |
|
Rice |
Gamma RN |
Yearly |
|
|
Marine Samples |
Fishes |
Gamma RN |
Twice a year |
|
Seaweeds |
Gamma RN |
Twice a year |
Table┬Ā2
240Pu/239Pu Atom Ratios in the Marine and Terrestrial Samples around Facilities
|
Site (Sample no.) |
Seawater |
Sediment (Sea/stream) |
Soil |
|
|
|
|
Mean |
Range |
Mean |
Range |
Mean |
Range |
|
Kori (9) |
0.239┬▒0.007 |
0.228ŌĆō0.253 |
0.243┬▒0.004 |
0.235ŌĆō0.249 |
0.181┬▒0.002 |
0.179ŌĆō0.182 |
|
|
Wolsong (5) |
0.241┬▒0.008 |
0.231ŌĆō0.255 |
0.244┬▒0.006 |
0.234ŌĆō0.250 |
0.174┬▒0.005 |
0.170ŌĆō0.177 |
|
|
Hanbit (2) |
0.220┬▒0.017 |
0.194ŌĆō0.243 |
0.209┬▒0.000 |
0.209 |
0.171┬▒0.001 |
0.170ŌĆō0.172 |
|
|
Hanul (2) |
0.233┬▒0.004 |
0.226ŌĆō0.236 |
0.240┬▒0.003 |
0.238ŌĆō0.242 |
0.181┬▒0.003 |
0.179ŌĆō0.183 |
|
|
Daeduck* (2) |
- |
- |
0.178┬▒0.001 |
0.177ŌĆō0.179 |
0.182┬▒0.001 |
0.181ŌĆō0.182 |
|
|
GyeongjuŌĆĀ (1) |
- |
- |
0.234┬▒0.007 |
- |
0.184┬▒0.020 |
- |
|
|