Optimization of Yonsei Single-Photon Emission Computed Tomography (YSECT) Detector for Fast Inspection of Spent Nuclear Fuel in Water Storage
Article information

Abstract
Background
The gamma emission tomography (GET) device has been reported a reliable technique to inspect partial defects within spent nuclear fuel (SNF) of pin-by-pin level. However, the existing GET devices have low accuracy owing to the high attenuation and scatter probability for SNF inspection condition. The purpose of this study is to design and optimize a Yonsei single-photon emission computed tomography version 2 (YSECT.v.2) for fast inspection of SNF in water storage by acquisition of high-quality tomographic images.
Materials and Methods
Using Geant4 (Geant4 Collaboration) and DETECT-2000 (Glenn F. Knoll et al.) Monte Carlo simulation, the geometrical structure of the proposed device was determined and its performance was evaluated for the 137Cs source in water. In a Geant4-based assessment, proposed device was compared with the International Atomic Energy Agency (IAEA)-authenticated device for the quality of tomographic images obtained for 12 fuel sources in a 14×14 Westinghouse-type fuel assembly.
Results and Discussion
According to the results, the length, slit width, and septal width of the collimator were determined to be 65, 2.1, and 1.5 mm, respectively, and the material and length of the trapezoidal-shaped scintillator were determined to be gadolinium aluminum gallium garnet and 45 mm, respectively. Based on the results of performance comparison between the YSECT.v.2 and IAEA’s device, the proposed device showed 200 times higher performance in gamma-detection sensitivity and similar source discrimination probability.
Conclusion
In this study, we optimally designed the GET device for improving the SNF inspection accuracy and evaluated its performance. Our results show that the YSECT.v.2 device could be employed for SNF inspection.
Introduction
Spent nuclear fuel (SNF) is a term representing uranium-bearing fuel elements that are no longer emitting enough energy to sustain a nuclear reaction but yet contain various highly radioactive fissile products such as 137Cs, 134Cs, 154Eu, 144Pr, and others. Most often, SNFs are temporarily maintained in a specially designed water storage facility at a reactor site before being transported to an independent interim storage facility.
After the Non-Proliferation Treaty (NPT) went into effect, the International Atomic Energy Agency (IAEA)’s authority to inspect the diversion of nuclear material to military purposes by non-nuclear-weapon NPT members grew. One of the IAEA’s safeguarding functions entails quantitative verification of nuclear material (e.g., SNF) amounts by various inspection techniques [1]. The IAEA has developed a number of verification techniques for SNF assemblies based on non-destructive analysis [1]. However, most of them suffer from technical problems and a high degree of uncertainty due to unfavorable inspection conditions, such as high-level background gamma and neutron radiation fields in water storage, as well as the high attenuation and scatter probabilities of gammas emitting from SNF.
Gamma emission tomography (GET) is a reliable and effective verification technique for the inspection of partial defects within SNF assemblies [2, 3]. GET offers intuitive tomographic imaging of SNF assemblies and discrimination of rod-by-rod radioactivity by rotatable-detector scanning. Passive gamma emission tomography (PGET), the first representative GET equipment that consists of CdZnTe detectors and a tungsten collimator, was authenticated by the IAEA in 2017 for partial-defect interrogation of SNF assemblies [4–6]. However, PGET has a drawback in the form of low detection efficiency due to the use of a small-sized semiconductor, which may incur inspection time delay, especially for densely arranged SNF assemblies maintained in water storage [6]. Therefore, the IAEA has attempted to develop different types of GET equipment with which SNF assembly inspection can be completed within 1–2 hours for all SNF assembly types [5, 6].
In our previous study, we designed a highly sensitive bismuth germanate (BGO) scintillator-based GET detector using Monte Carlo (MC) simulation [7]; later, we developed a machine-learning-based de-noised image reconstruction technique to improve poor tomographic image spatial resolution caused by utilization of larger-sized BGO scintillators instead of small-sized semiconductors [8]. Through both of these studies, we experimentally validated the feasibility of rod-by-rod verification of a test fuel assembly with our prototype GET system, named Yonsei single-photon emission computed tomography (YSECT), which consists of 64-channel trapezoidal-shaped BGO scintillator-based detectors with parallel-hole tungsten collimators [9]. Despite the successful proof-of-principle, these studies [7–9] also have limitations for the on-site application in nuclear power plants. As shown in our MC simulation study [7], it was difficult to discriminate the SNF source distribution in the central region of the assembly in water with the YSECT detector, due to the high attenuation and scatter probability of the emitted gammas and the lack of any correction technique. The aim of the present study, therefore, is to design a YSECT version 2 (YSECT.v.2) specialized for rod-by-rod SNF verification in water storage based on denoising algorithms, including attenuation correction and image reconstruction algorithm, with the following geometry optimization.
Materials and Methods
1. Performance Evaluation for Various Scintillator Materials
To increase detector sensitivity and SNF inspection speed, higher gamma-detection probability and higher energy resolution as potentiated by greater light (i.e., optical photon [OP]) generation in the scintillator are required. For effective OP-collection, the scintillator’s emitted OPs’ wavelength and the photo-sensor (e.g., silicon photomultiplier [SiPM])’s OP-collection characteristics should be considered [10]. The decay time of scintillation directly affects the count rate of the detector: a short decay time enables high-efficiency gamma detection over the course of the total inspection time for high-level radioactive SNF sources. Considering these characteristics, we selected BGO, gadolinium aluminum gallium garnet (GAGG), and lanthanum (III) bromide (LaBr3) as our three scintillator candidates; Table 1 shows their material properties.

Material Properties of the Three Scintillators: BGO, GAGG, and LaBr3
The Geant4 (Geant4 Collaboration) [11] and DETECT-2000 (BinMaster) [12] MC simulation programs were employed to assess the gamma-detection and OP-collection efficiencies of the scintillators [13] with the 137Cs source, which is the major nuclide of decades-cooled SNF. As illustrated in Fig. 1, a single trapezoidal-shaped scintillator encapsulated in a BaSO4 reflector and coupled with a SiPM was modeled in Geant4. In our previous study, the scintillator geometry of YSECT.v.1 was designed for high gamma-detection probability for the 137Cs source in air and for high OP-collection efficiency when coupled with a commercial 3 mm×3 mm SiPM. Based on the results, we determined the width, length, and front and back heights of the scintillators as 3, 40, 40, and 3 mm, respectively [7, 9]. The 30 mm×70 mm plane-shaped 137Cs source emitted 662 keV gammas toward the scintillator in a box filled with water. A total of 1.0×10⁸ gammas was delivered to the full area of the scintillator. The OP generation was determined by the light yield per deposited energy of each scintillator (Table 1). The energy-deposition distribution at the trapezoidal-shaped scintillator volume by 137Cs plane source was assessed at a given resolution with a voxel size of 3 mm×1 mm× 1 mm using the Geant4 toolkit.
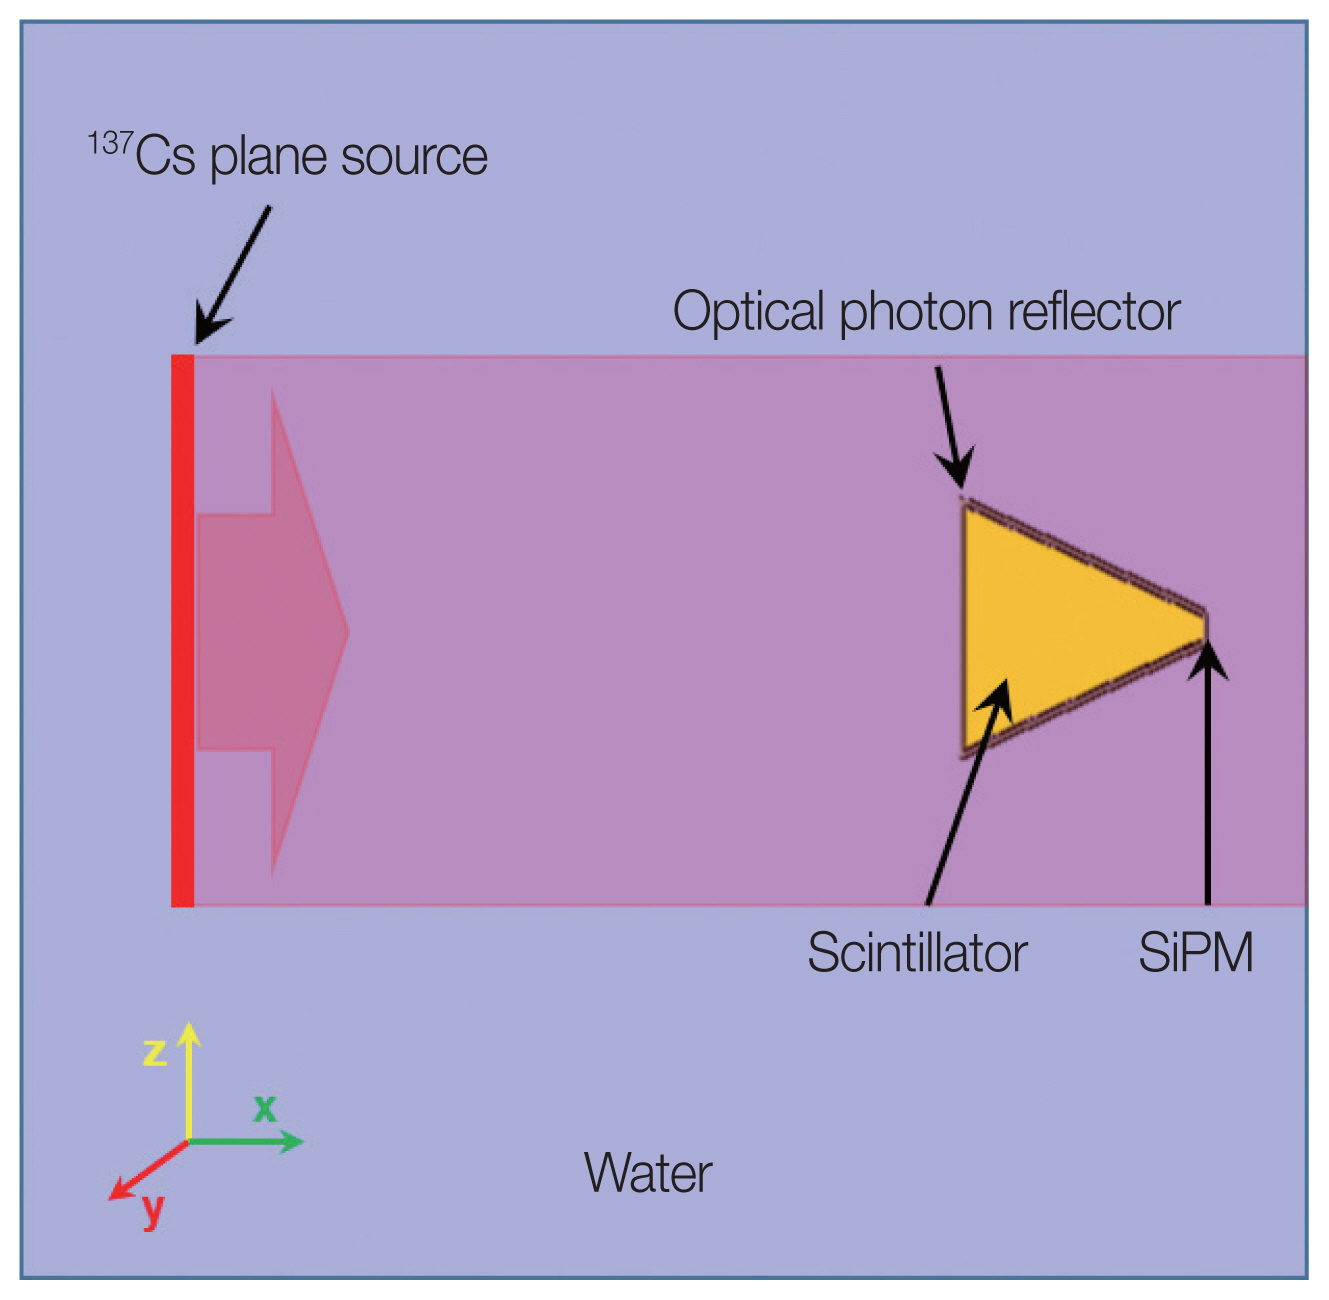
Geant4 simulation conditions for the evaluation of the gamma-detection performance of a trapezoidal-shaped scintillator encapsulated in BaSO4 reflector and coupled with photo-sensor for 137Cs plane source in water. SiPM, silicon photomultiplier.
DETECT-2000 simulation was performed to assess the OP-collection efficiency at the commissure between the scintillator and the SiPM. The DETECT-2000 assessed the transportation and absorption of the OPs at the scintillator, along with the reflection at the BaSO4 reflector, for the isotropic emitting OPs. To exclude the position dependency of the OP generation in the scintillator, 1.0×10⁸ OPs were generated at the center of each voxel at a given resolution with a voxel size of 3 mm×5 mm×5 mm for the trapezoidal-shaped scintillator volume. The ratio of the number of the OPs reached at the commissure between the scintillator and SiPM to the total number of OPs generated for this simulation (i.e., OP-collection efficiency) was evaluated for each scintillator material. Finally, the total number of OPs collected by SiPM was estimated by considering this OP-collection efficiency and the total number of generated OPs as obtained in the Geant4 simulation.
2. Performance Evaluation for Various Detector Geometries
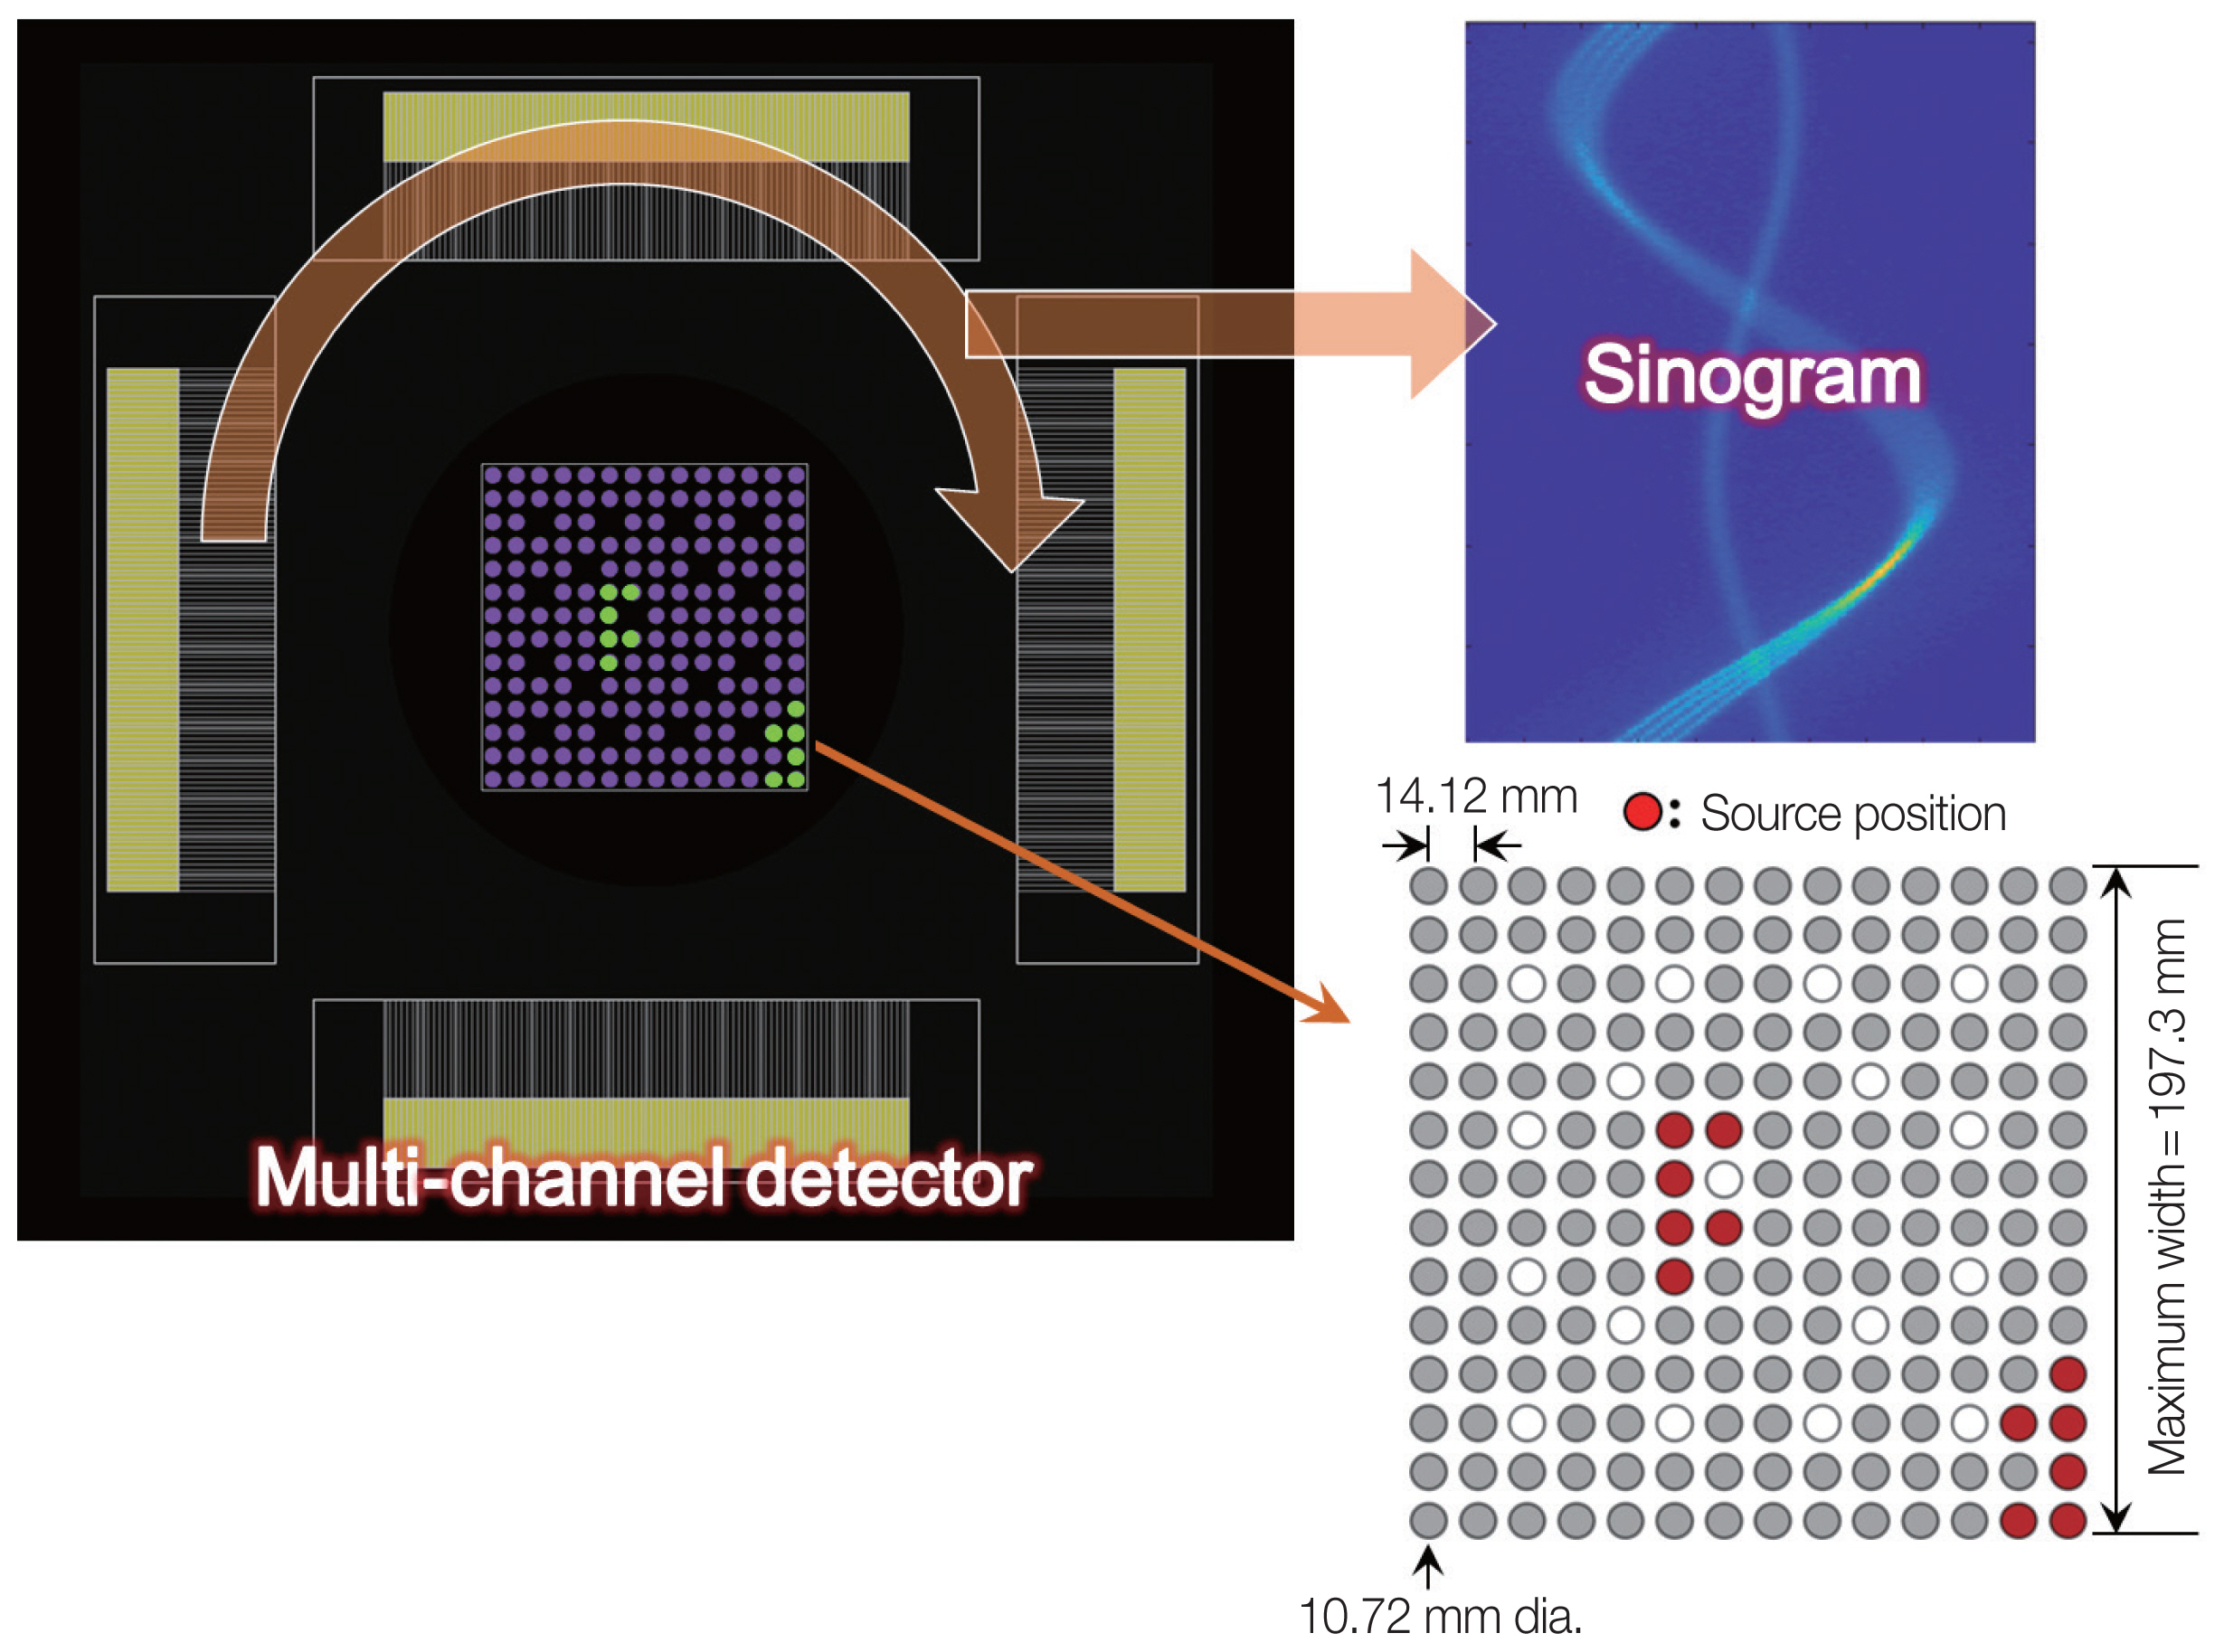
Tomographic images of an SNF assembly can be obtained by reconstructing sinograms, which are projection images acquired at every rotation angle using GET equipment. To obtain high-quality tomographic images, good sensitivity and good spatial resolution of each projection image are required. These two image-quality factors can be quantitatively evaluated by analyzing the projection image for a given point source. As illustrated in Fig. 2, therefore, the performance of the 64-channel GAGG-based detector was assessed by Geant4 simulation for the 137Cs point source at a distance of 250 mm from the detector surface in water, according to the different geometrical parameters of the detector. A total of 109 gammas of 662 keV were emitted with a cone-shaped beam covering the entire area of the detector from the point source. The spatial resolution and sensitivity of the projection image were evaluated based on the full width at half maximum (FWHM) and the net peak count (i.e., the peak count subtracted from the noise count) of the point spread function (PSF), respectively.

(A) Geant4 simulation conditions for the evaluation of the imaging performance of the 64-channel gadolinium aluminum gallium garnet detector for 137Cs point source in water; (B) geometrical parameters of the multi-channel detector; (C) projection image acquired for 137Cs point source with illustrated image-quality assessing parameters. FWHM, full width at half maximum.
The geometrical parameters affecting the spatial resolution and sensitivity of a projection image include the length, slit width, and septal width of the collimator and the length and width of the scintillator (Fig. 2). The height of the collimator slit, the height of the frontal surface of the scintillator, and the scintillator width were fixed at 40, 40, and 3 mm, respectively. In this optimization study, the length and the slit width of the collimator were varied between 30 and 70 mm at 5 mm intervals, and between 2 and 3 mm at 0.1 mm intervals, respectively. The collimator septal width was determined by Equation (1), which represents the minimum septal width (t) necessary to reduce the septal wall transmittance of gammas obliquely incident on the collimator to 5% or less [14]:
where t is the collimator septal width, d is the collimator slit width, μ is the linear attenuation coefficient for tungsten at 662 keV gammas, and lc is the collimator length. The linear attenuation coefficient (μ) was obtained from the National Institute of Standards and Technology via their online XCOM database [15]. The scintillator length was varied between 35 and 55 mm at 5 mm intervals. The total deposited energy in the scintillator was obtained by Geant4 simulation, and the OP-collection efficiency was estimated by generating 1.0×10⁶ OPs at each 3 mm×5 mm×5 mm voxel in the trapezoidal-shaped scintillator volume by DETECT-2000 simulation.
3. Performance Evaluation of the Reconstruction Algorithms
To assess the performance of the reconstruction algorithms with the YSECT.v.2 detector, tomographic images for a 14×14 Westinghouse (WH)-type fuel assembly in water were obtained by the YSECT.v.2 and the PGET models in Geant4 (Fig. 3), and compared from the perspective of image quality and the discrimination accuracy for the fuel rods in the assembly. As illustrated in Fig. 3, the 197.3 mm×197.3 mm× 400 mm WH-type fuel assembly consists of 179 UO2 fuel rods with a density of 10.52 g/cm3 and 17 guide tubes. The diameter of each fuel rod is 10.72 mm, and the pitch size between the two fuel rods is 14.12 mm. Of the 12 sources emitting gammas, six of them are located near the center of the assembly, and the rest of them are located in the outer regions of the assembly. The sinograms were acquired by rotating the YSECT.v.2 and PGET detectors 200 mm from the center of the assembly. Each source emitted 1.0×10⁸ gammas with the energy spectrum reported by Pacific Northwest National Laboratory in 2016 [5] for 10 years-cooled SNF after 45,000 megawatt-days per metric ton of uranium (MWd/MTU) burnup. With a longer cooling time, the predominant energy in the energy spectrum converges to 662 keV. This is due to the fact that the significant radionuclide of the spent fuel becomes 137Cs, owing to its long half-life (about 30 years). Therefore, in the data acquisition systems of the YSECT.v.2 and PGET detectors, the energy window was fixed at around 662 keV, taking into consideration the energy resolutions of 5.2% (644.79–679.21 keV) and 3.2% (651.41–672.59 keV) for GAGG and CdZnTe, respectively. The projection images were obtained at every 1° of rotation through the full 360° rotation. Tomographic images of the assembly were reconstructed by a maximum-likelihood expectation maximization (MLEM) algorithm, which is an iterative statistical reconstruction method [16]. This algorithm predicts pixel intensity using maximum-likelihood estimation to approximate the physical process of radiation in the tomographic image using Equation (2), which can also be expressed as Equation (3):
Geant4 simulation conditions for sinogram acquisition by multi-channel detectors rotating around 12 radioactive sources in 14×14 Westinghouse-type assembly fully filled with fuel rods, with geometrical details of the assembly.
where Im is the intensity at the mth measured position in the detector, W is a system matrix that transforms real SNF source distribution data into projection image data acquired with the detector, Wmn represents each contribution coefficient of the nth pixel to the mth measured position in the detector, and An is the gamma emission intensity at the nth pixel in the real SNF source distribution.
To reduce the complexity of the image reconstruction process, in this study, we assumed that the gamma-detection system is set up under ideal conditions, ignoring the gamma-scattering effect, and considering the real SNF source distribution to be two-dimensional. Following this assumption, the system matrix can be expressed as Equation (4),
where Adet,mn is the exposed area of the nth pixel as seen from the mth position in the detector, Rmn is the distance between the nth pixel and the mth position in the detector, e−∑iμ idi,mn is the attenuation factor of gammas passing through UO2 fuel rods and water, μi is the attenuation coefficient of the ith material, and di,mn is the travel distance in each ith material while gammas penertrate from the nth pixel to the mth position in the detector. Finally, the MLEM algorithm iteratively estimated A based on the well-designed model of the tomographic imaging system for the SNF assembly.
Results and Discussion
1. Determination of the Scintillator Material
With the Geant4 simulation, the total energies deposited in the BGO (ρ=7.13 g/cm3), GAGG (ρ=6.63 g/cm3), and LaBr3 (ρ=5.2 g/cm3) scintillators for the plane-shaped 1.0×10⁸ 662 keV gammas were assessed as 2.26×10⁸, 1.18×10⁸, and 1.06×10⁸ keV, respectively. We assumed that these results were almost in proportion to the densities of the scintillator materials. As illustrated in Fig. 4, most of the gammas delivered the higher dose to the surface region of the scintillator, and the lower scintillator density made for a wider region of high energy deposition, as colored with yellow and orange, to the depth direction. When we assumed that the light yields of BGO, GAGG, and LaBr3 were 9, 50, and 63 γ/keV, respectively (Table 1), the total numbers of OP emissions in the scintillator for 1.0×10⁸ gammas were estimated as 2.04×10⁹, 5.90×10⁹, and 6.65×10⁹, respectively, and their normalized values to that of LaBr3 were 0.31, 0.89, and 1.00, respectively (Fig. 5A).
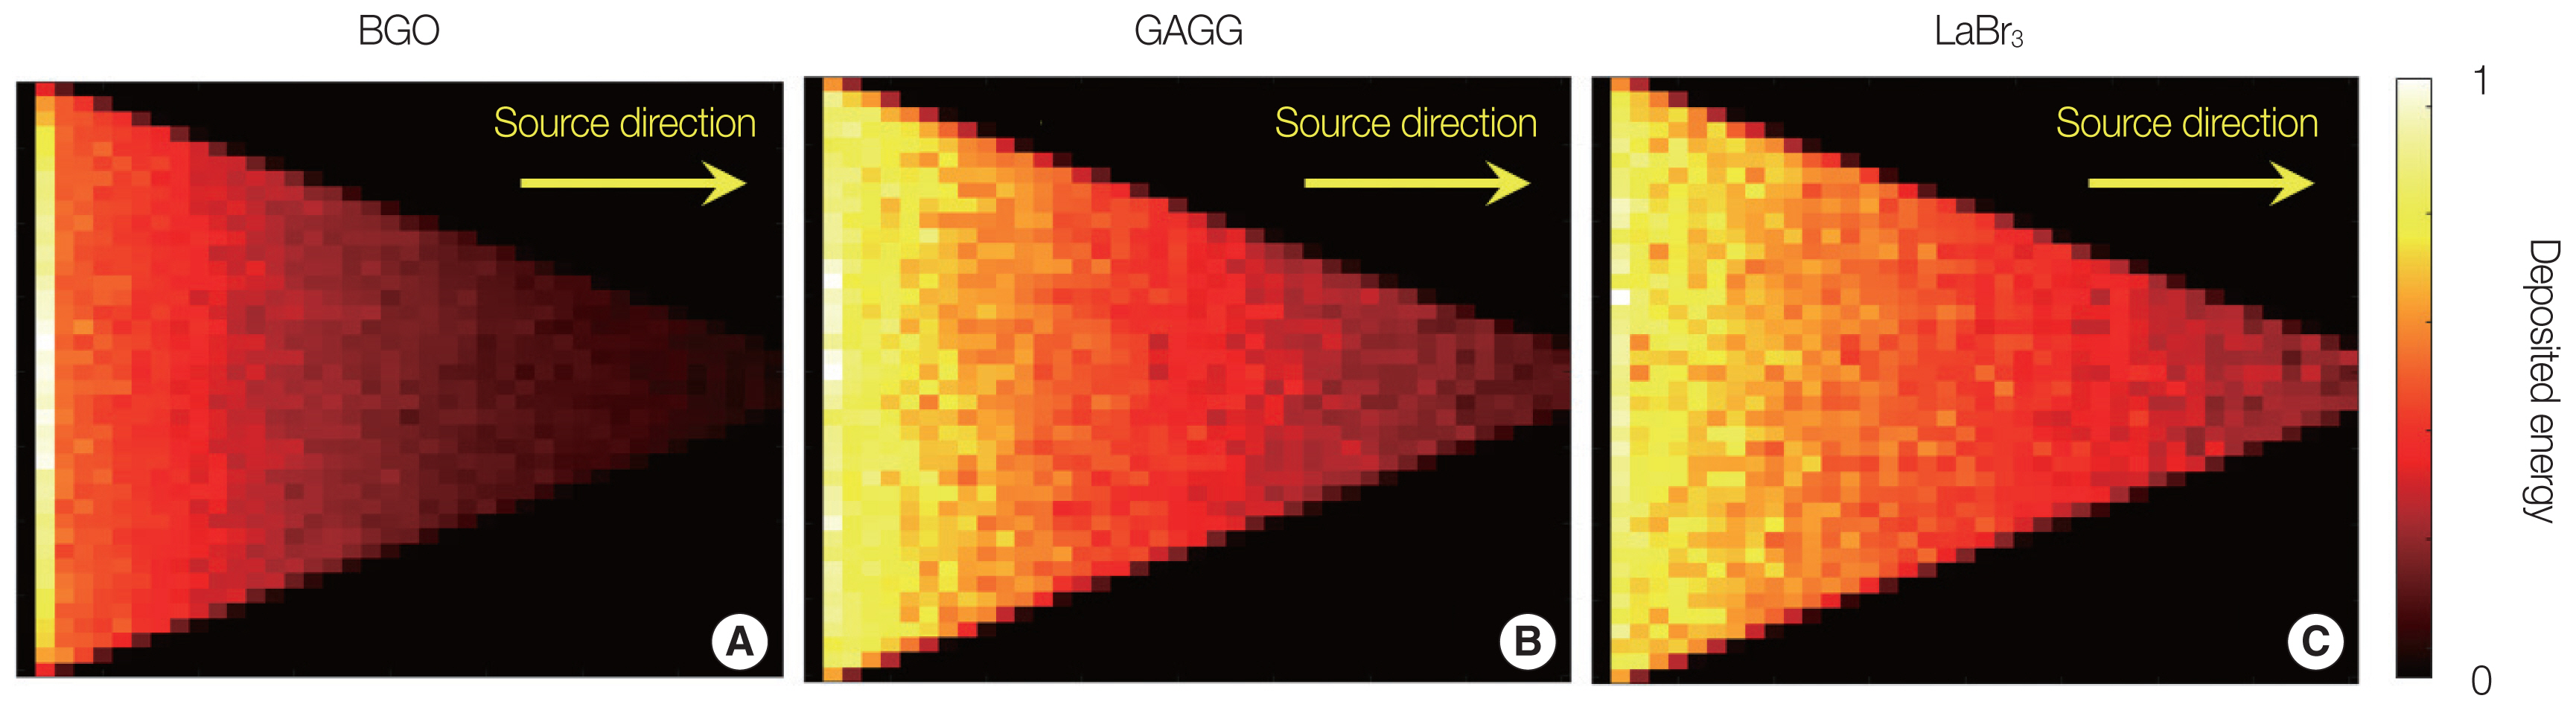
Deposited energy distribution in trapezoidal-shaped (A) bismuth germanate (BGO), (B) gadolinium aluminum gallium garnet (GAGG), and (C) lanthanum (III) bromide (LaBr3) scintillators for 137Cs plane source.
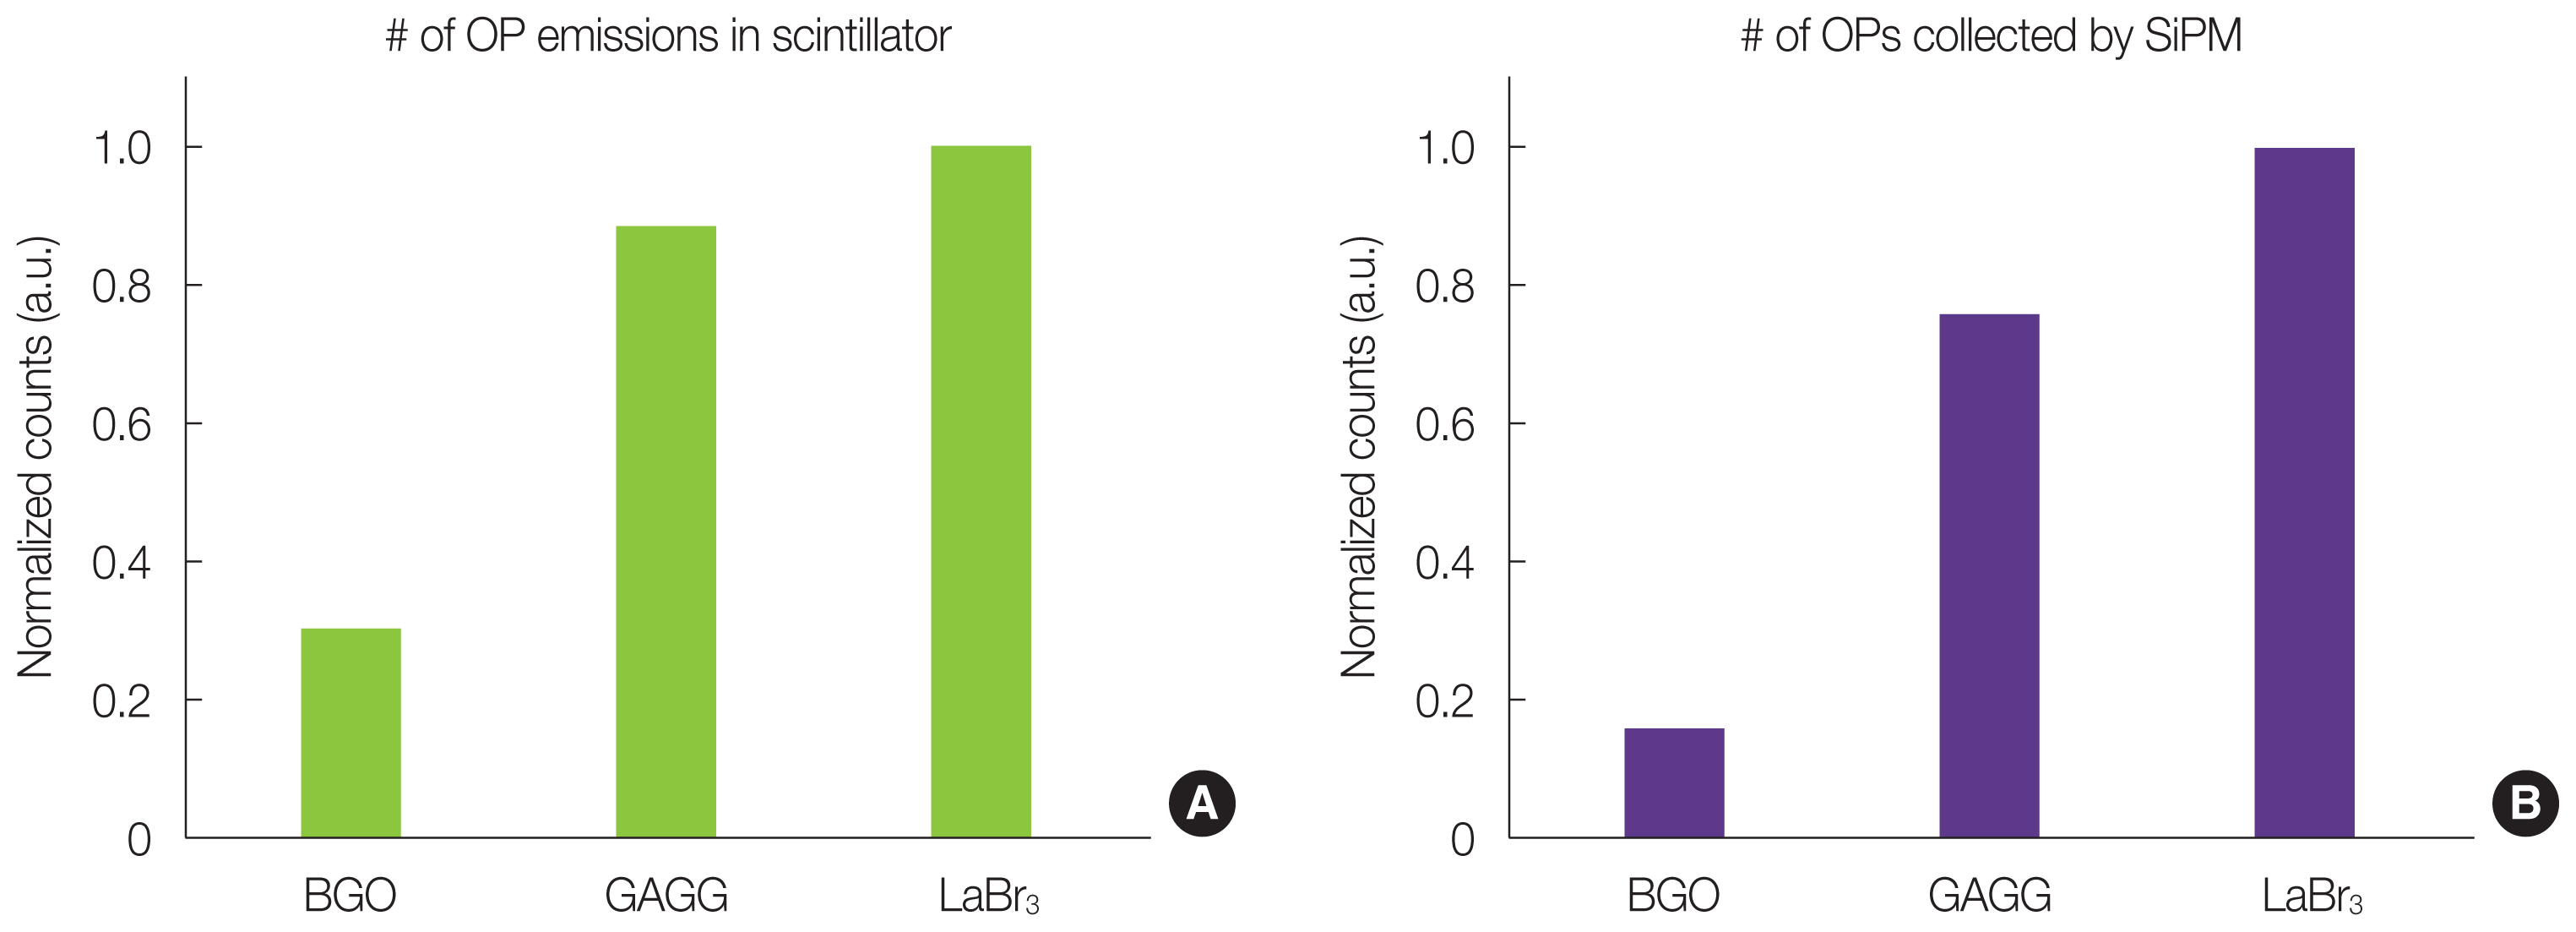
Comparison of (A) total number of optical photon (OP) emissions in bismuth germanate (BGO), gadolinium aluminum gallium garnet (GAGG), and lanthanum (III) bromide (LaBr3) scintillators based on interaction with 662 keV, and (B) averaged number of OPs collected by photo-sensor attached to rear side of scintillators. SiPM, silicon photomultiplier.
As for the results of the DETECT-2000 simulation, the averaged numbers of OPs reaching the surface of the SiPM in the BGO, GAGG, and LaBr3 scintillators were 3.77×10⁶, 1.75×10⁷, and 2.31×10⁷, respectively, and their normalized values to those of LaBr3 were 0.16, 0.76, and 1.00, respectively (Fig. 5B). Based on these Geant4 and DETECT-2000 simulation results, the OP-collection efficiencies of SiPM coupled with the BGO, GAGG, and LaBr3 scintillators were assessed as 0.19%, 0.30%, and 0.35%, respectively, reflecting the different refractive characteristics and the self-absorption probabilities of the OPs according to the scintillators.
Considering these simulation results, the LaBr3, and GAGG materials showed good performance compared with BGO; however, LaBr3 has a disadvantage when applied to a detector operating in water, due to its hygroscopic property. To utilize LaBr3 for the detector, therefore, not only high-level manufacturing techniques but also additional sealing of the scintillator are necessary. In fact, detector sensitivity can be degraded as a result of scintillator volume shrinkage with the same spatial resolution (i.e., fixed pitch size) of a multi-channel detector. On the other hand, the GAGG scintillator showed comparable performance and decay time to those of LaBr3 and better energy resolution than that of BGO. Therefore, we determined GAGG as the proper scintillator material for the YSECT.v.2 detector.
2. Determination of Detector Geometry
The PSF distributions of the projection images acquired for the various detector geometries with the 137Cs point source in water were analyzed according to the FWHM and net peak count in order to evaluate the spatial resolution and sensitivity of the detector. Fig. 6 shows the FWHM and net peak count according to varying collimator lengths and slit widths for a 250 mm source-to-detector surface distance (SDD), a 3 mm scintillator width, and a 70 mm length. A similar tendency was obtained with slit width variations from 2.3 to 2.7 mm; that is, the FWHM and the net peak count were reduced with increasing collimator length, and these curves crossed at about the 40 mm length point.
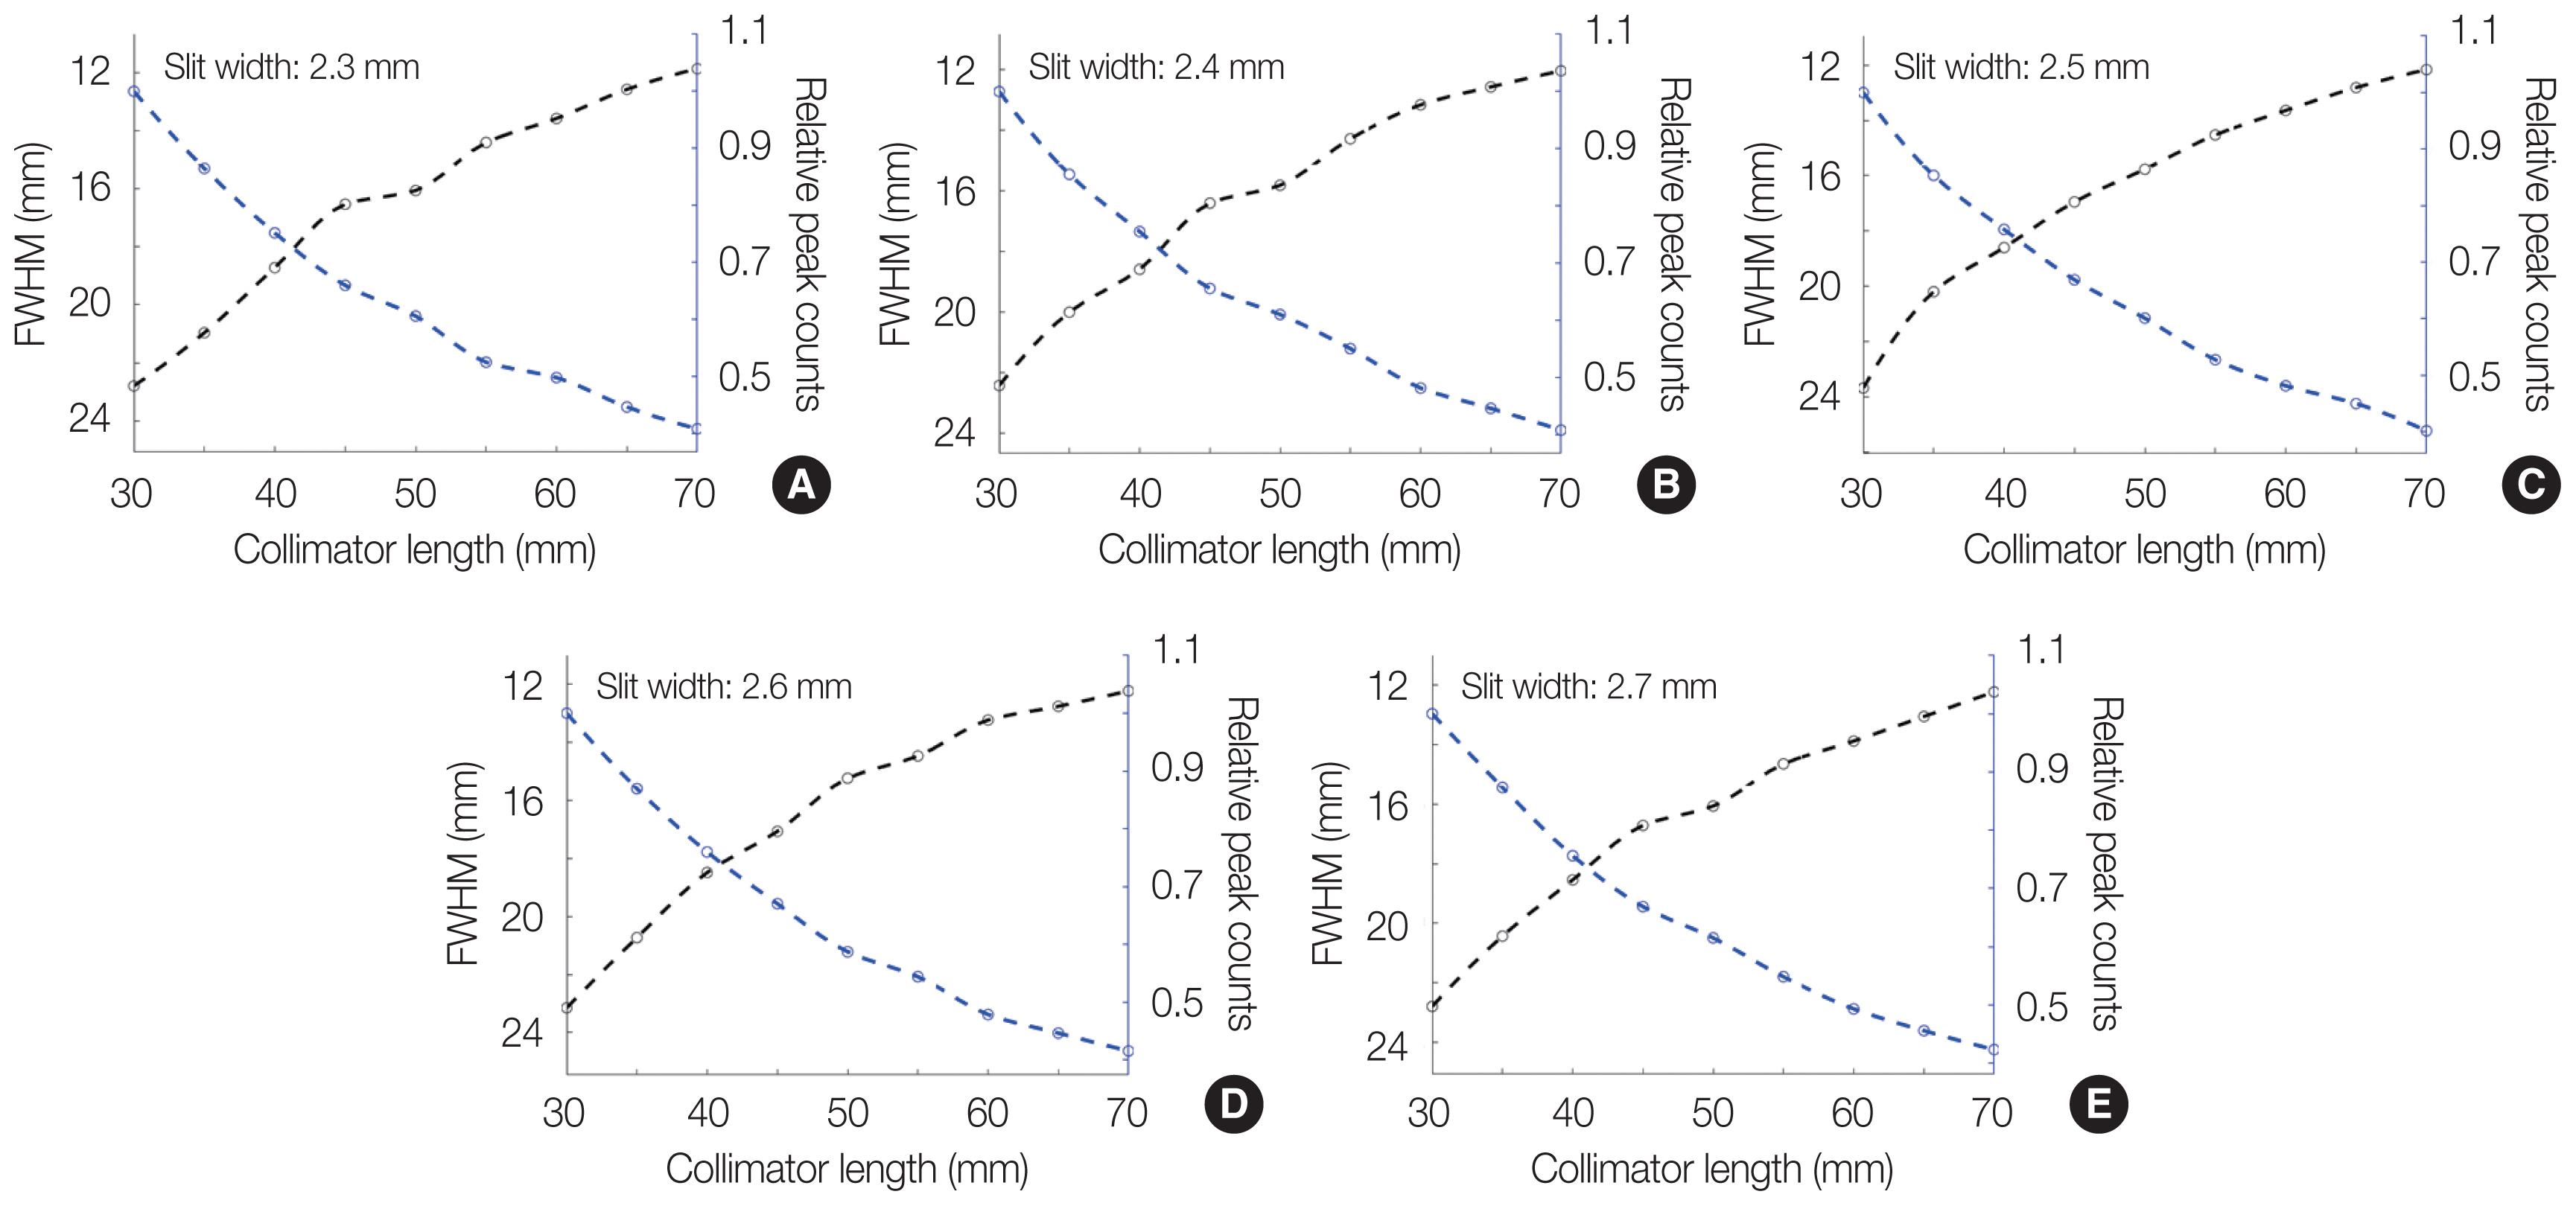
(A–E) Full width at half maximum (FWHM) and net peak count according to varying collimator length and slit width for 250 mm source-to-detector surface distance with 3 mm scintillator width and 70 mm length.
Among the various types of SNF assemblies, we are currently considering 16×16 Combustion Engineering [7], 14× 14 WH (Fig. 3), and 16×16 WH-type SNF assemblies as the target assemblies for inspection with the YSECT.v.2 system. The smallest rod-to-rod pitch of these assemblies was about 12.32 mm for the 16×16 WH-type assembly; therefore, the FWHM of the PSF might be less than 12.32 mm in order to clearly discriminate individual fuel rods well in a tomographic image. According to this prerequisite, the collimator length is suggested to be over 65 mm. Additionally, if we change the SDD to 150 mm and 200 mm for the same conditions as shown in Fig. 6, the collimator lengths should be over 40 mm and 55 mm, respectively, to meet that prerequisite. The shorter collimator length makes for poorer spatial resolution of the detector due to the wider angle of incidence of gammas reaching the scintillator; however, it also increases the total amount of gamma detection, resulting in higher detector sensitivity. In the present study, we determined the optimal collimator length to be 65 mm, because it showed a relatively higher peak count than that of the 70 mm length, which helps to shorten the inspection time for an SNF assembly as much as possible.
Fig. 7 indicates the FWHM and net peak count according to varying slit widths for the 65 mm collimator length, 250 mm SDD, 3 mm scintillator width, and 70 mm length. In order to meet the condition under which the FWHM is less than 12.32 mm, the slit width should be 2.1 mm or less, and we determined the optimal slit width to be 2.1 mm. Based on these results, the minimum septal width was determined to be 1.5 mm using Equation (1) for the 65 mm collimator length, 2.1 mm slit width, and the linear attenuation coefficient for tungsten at 662 keV gammas. Fig. 8 shows the number of OPs generated in the scintillator (Fig. 8A), the OP-collection efficiency of the SiPM coupled with the scintillator (Fig. 8B), and the total number of OPs collected at the SiPM (Fig. 8C) according to the varying trapezoidal-shaped GAGG scintillator length. A longer scintillator length enables a higher number of OPs to be generated with a higher gamma-detection probability and increasing scintillator volume; the value for the 55 mm length was the highest (Fig. 8A). Since the SiPM is attached to the end of the scintillator, the OP-collection efficiency of the SiPM decreases as the scintillator length increases, and is relatively most efficient at the 35 mm length (Fig. 8B). The result plotted in Fig. 8C was derived by multiplying the result of Fig. 8B by the result of Fig. 8A, for each scintillator length, considering both the gamma-detection sensitivity and the inherent OP-collection efficiency of the SiPM according to different scintillator lengths. Based on these results, we determined the optimal scintillator length to be 45 mm.
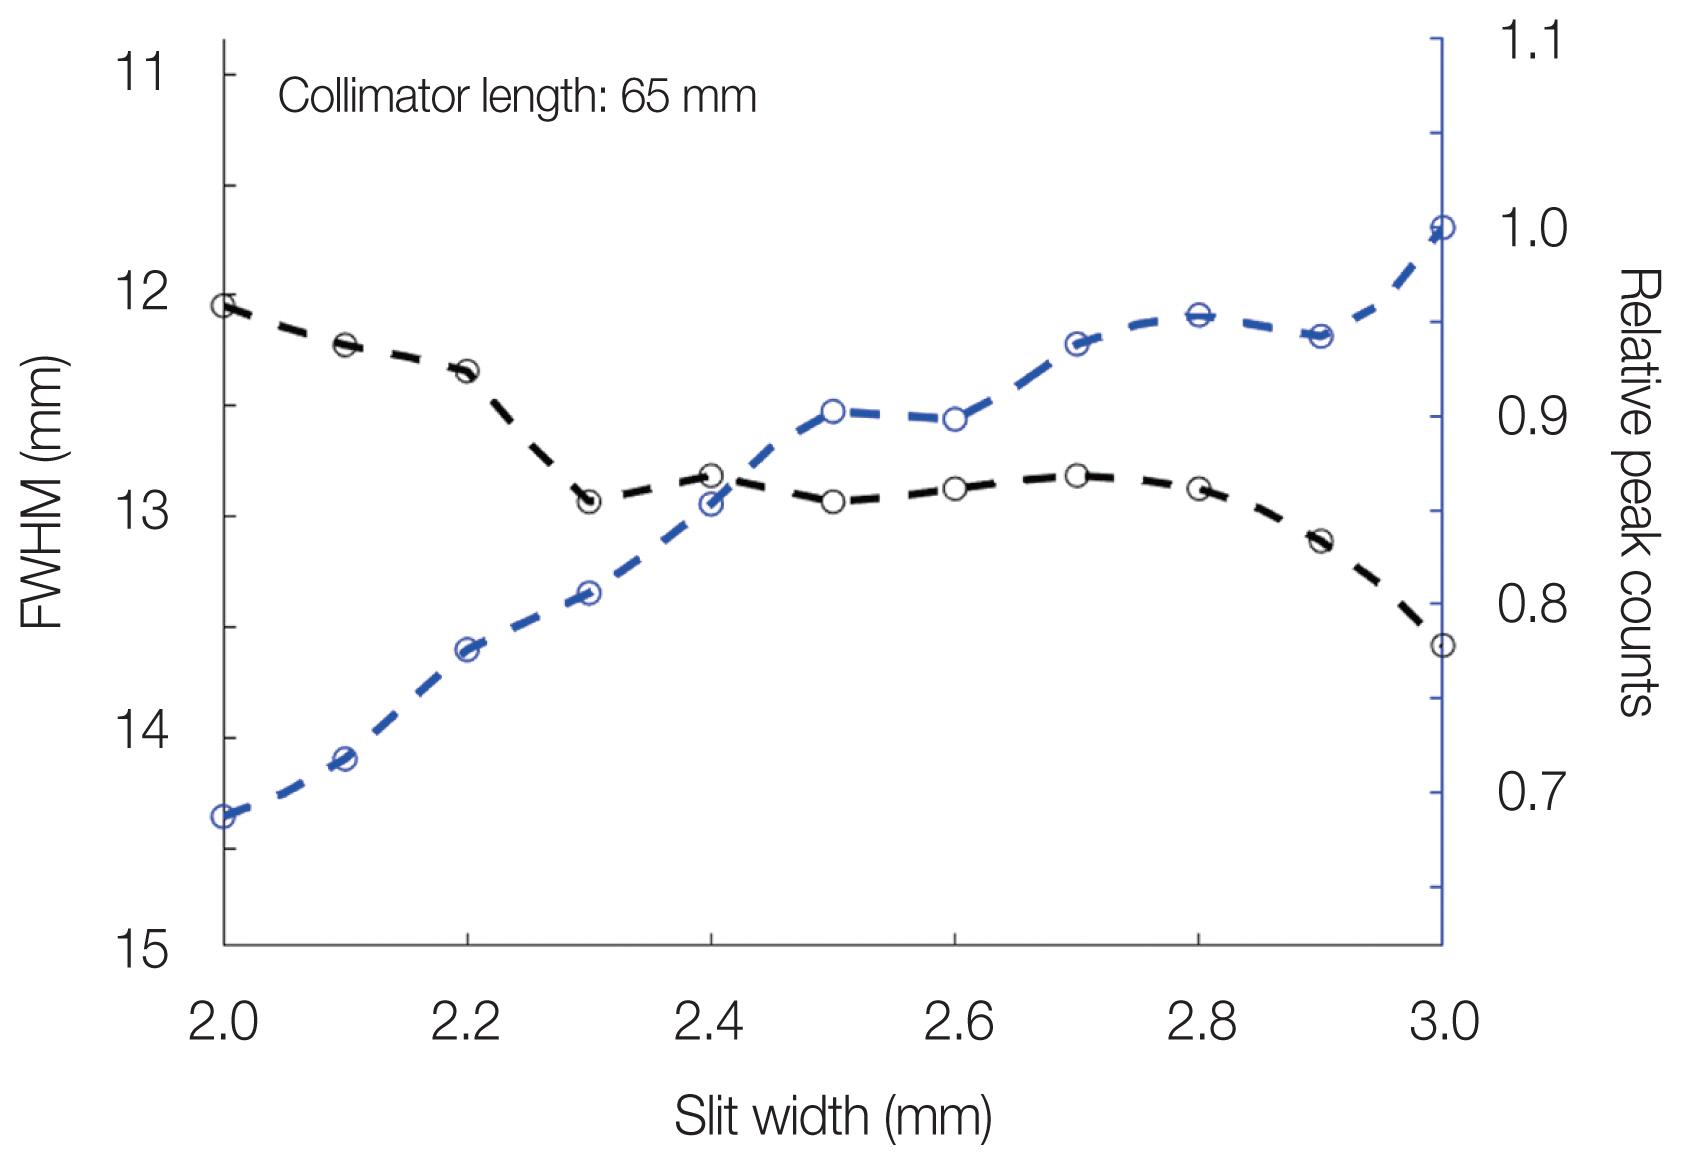
Variation of full width at half maximum (FWHM) and net peak count according to varying slit width for 65 mm collimator length, 250 mm source-to-detector surface distance, 3 mm scintillator width, and 70 mm length.
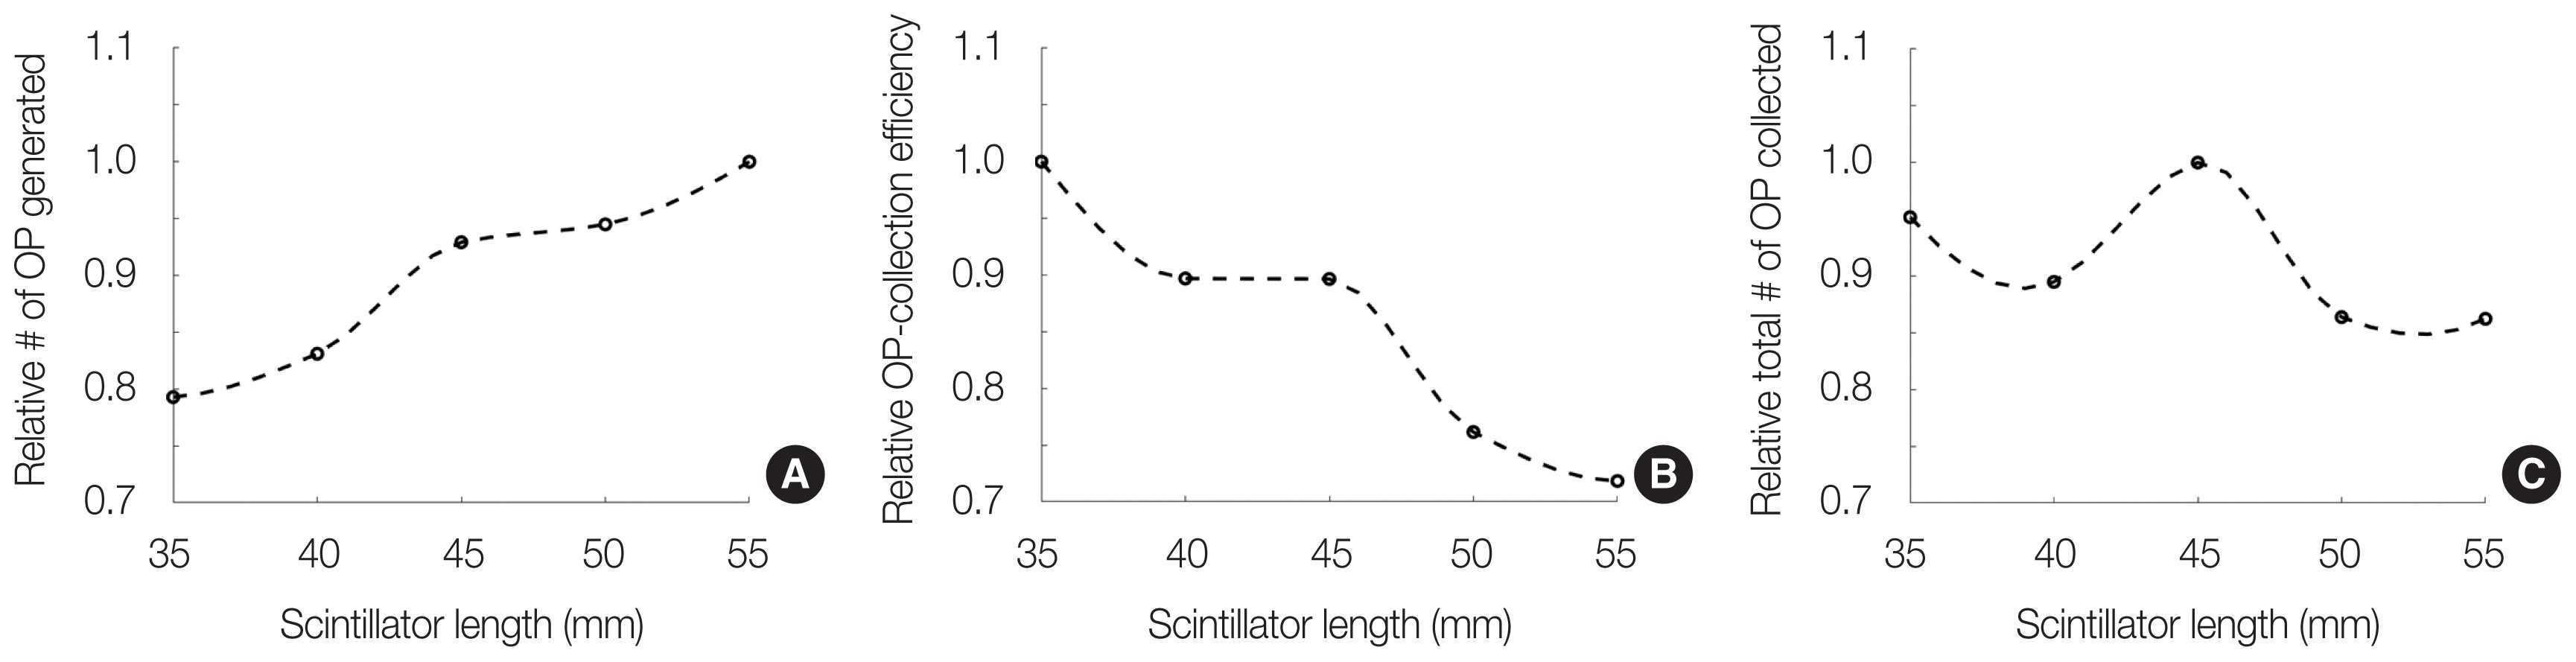
(A) Number of optical photons (OPs) generated in the scintillator, (B) OP-collection efficiency of the photo-sensor coupled with the scintillator, and (C) total number of OPs collected at the photo-sensor according to varying gadolinium aluminum gallium garnet scintillator lengths for 137Cs plane source.
In summary, we determined the length, slit width, and septal width of the collimator to be 65, 2.1, and 1.5 mm, respectively. The material and length of the trapezoidal-shaped scintillator were also determined to be GAGG and 45 mm, respectively. These parameters allowed for the best detector performance based on the tomographic imaging of the 137Cs source in water storage.
3. Image Reconstruction Evaluation with the YSECT.v.2 Detector
The sinograms, illustrated in Fig. 9, were acquired by PGET and YSECT.v.2 modeled in Geant4. According to the sinogram comparison, the sinograms of YSECT.v.2 for the same source activity showed much more prominent source distributions at every projection relative to PGET. This was owed to the gamma-detection probability of the YSECT.v.2 detector being much higher with the larger-sized scintillator and the box-shaped collimator slit relative to PGET’s small-sized semiconductor and trapezoidal-shaped collimator slit. When comparing the maximum intensity of sinograms, that of YSECT.v.2 was about 200 times higher than that of PGET.
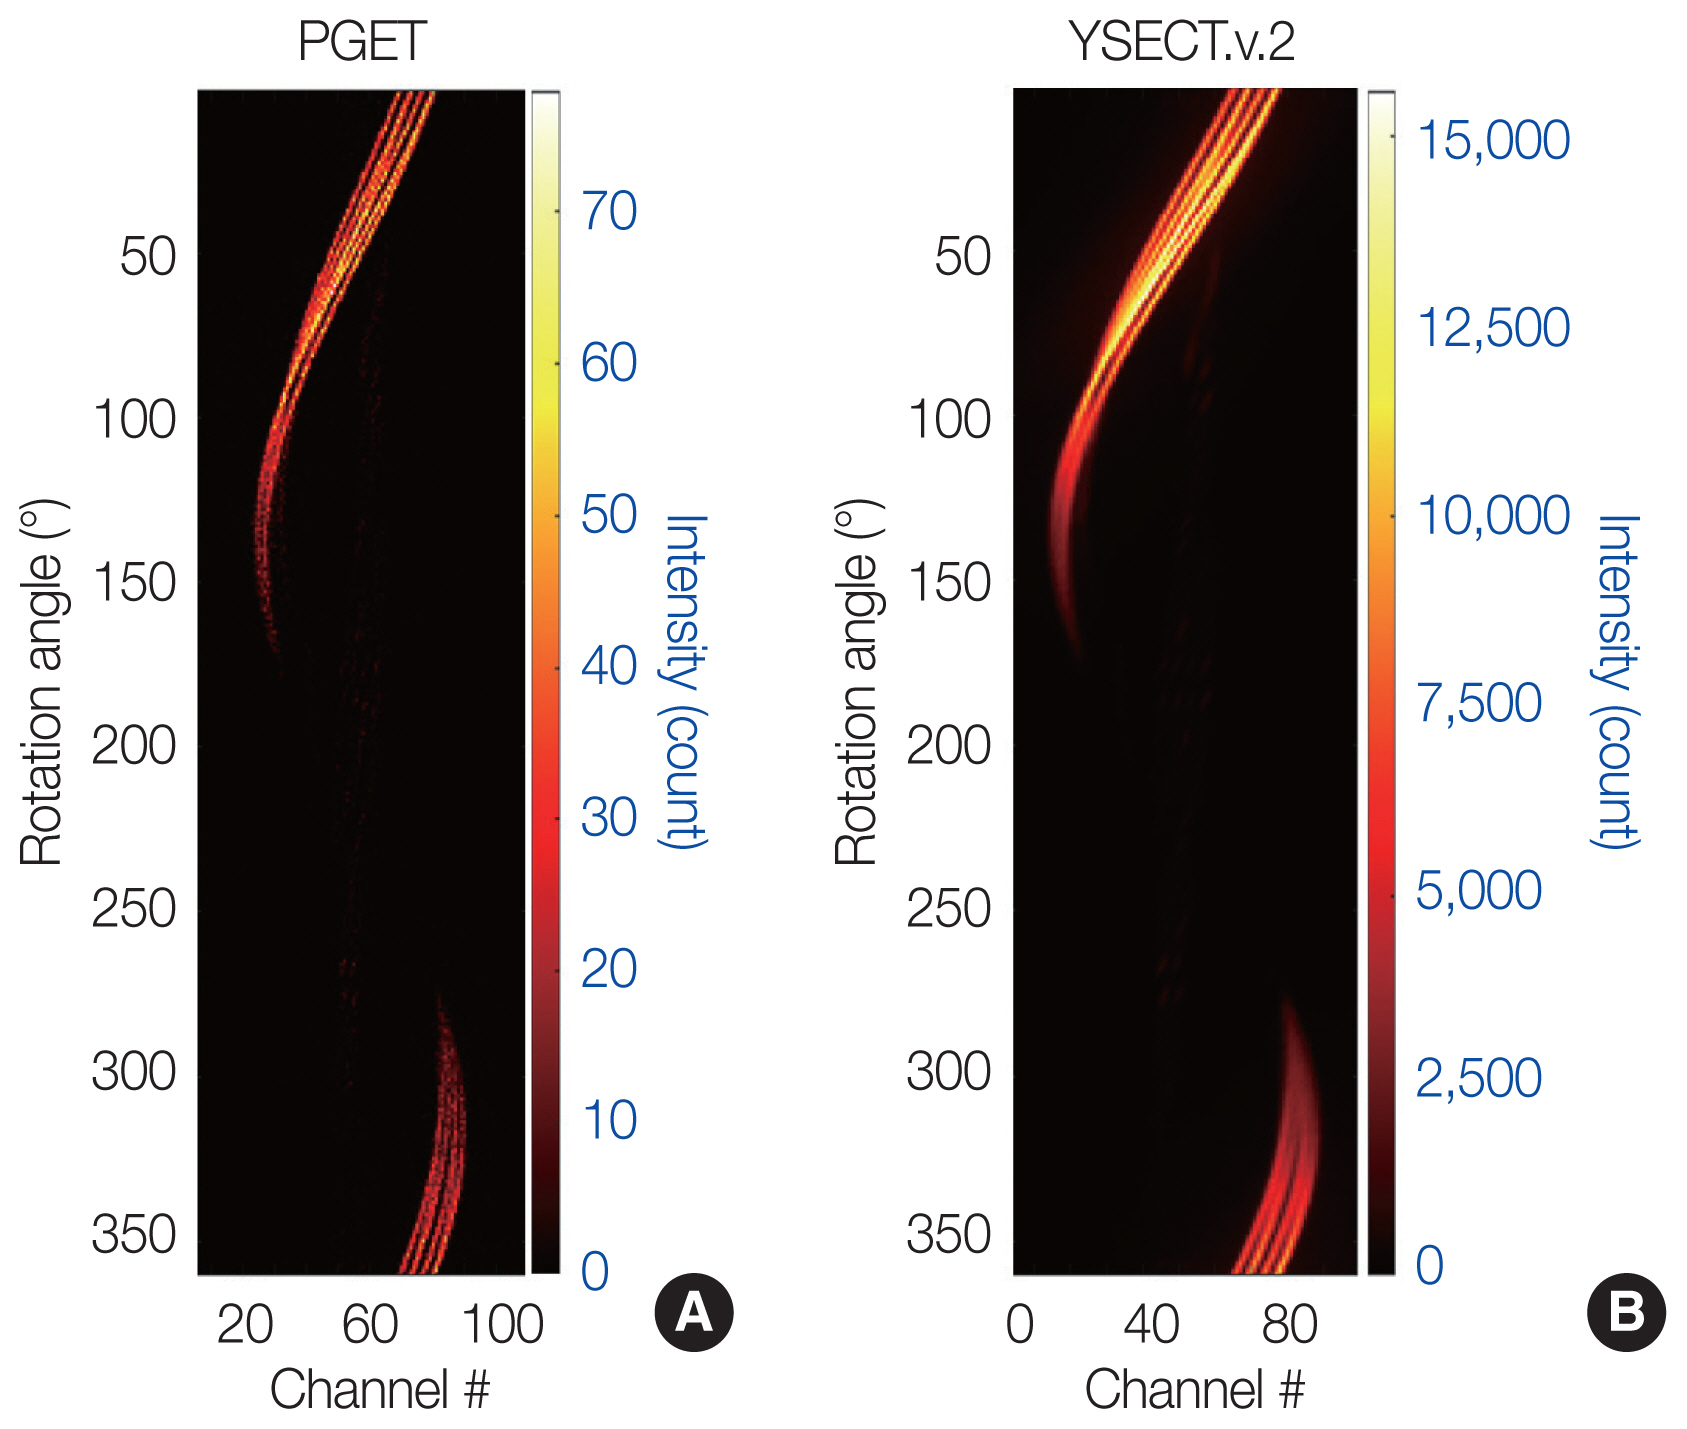
Image-intensity comparison of sinograms obtained by (A) the passive gamma emission tomography (PGET) and (B) Yonsei single-photon emission computed tomography version 2 (YSECT.v.2) detectors in Geant4.
Fig. 10 shows the tomographic images reconstructed by the MLEM algorithm and the attenuation-corrected MLEM algorithm (MLEM+AC) from the sinograms acquired by the PGET and YSECT.v.2 detectors for the 12 radioactive sources in the WH-type assembly fully filled with 179 fuel rods (Fig. 3). Without the attenuation correction, the tomographic images reconstructed with the MLEM algorithm was not able to detect the sources located near the center of the assembly. In fact, however, this was due to that the image intensities of the outer regions were much higher than those near the center of the assembly: 23.0 and 58.5 times higher intensities for PGET and YSECT.v.2, respectively. This outcome was due to the outer sources being closer to the detector than the inner sources and self-absorption of emitting gammas by high-density fuel rods. Accordingly, the image intensities were uneven, even though the 12 sources emitted the same number of gammas. Meanwhile, when comparing tomographic images, the maximum image intensity obtained with YSECT.v.2 was about 157.9 and 401.4 times higher than that of PGET for the inner and outer sources, respectively.

Comparison of tomographic images reconstructed by the maximum-likelihood expectation maximization (MLEM) algorithm and the attenuation-corrected MLEM algorithm (MLEM+AC) from sinograms acquired by passive gamma emission tomography (PGET) and Yonsei single-photon emission computed tomography version 2 (YSECT.v.2) detectors for 12 radioactive sources in 14×14 Westinghouse-type assembly, six of which are located (a) near center of the assembly and others in (b) outer regions of the assembly.
On the other hand, with the attenuation correction, the tomographic images reconstructed with MLEM+AC were able to clearly detect the sources located near the center of the assembly. It owes to successful corrections of the position dependency of the sources and the gamma attenuation by high-density fuel rods and water. Accordingly, the image intensities of all 12 sources were similar to each other. When comparing the detector performances of PGET and YSECT.v.2, however, the image intensities in the PGET images were relatively heterogeneous than those in the YSECT.v.2, for the same source activity, even with the successful image corrections. This can be explained by the fact that YSECT.v.2’s relatively large amount of detection data helps to reduce statistical uncertainty in image-intensity estimation during reconstruction. In this regard, in the YSECT.v.2 images, we could find dimly visible intensities in unexpected source positions near the six inner sources. It might be due to the relatively poor image spatial resolution caused by the utilization of larger-sized GAGG scintillators instead of small-sized semiconductors. However, we expect that these unexpected image intensities visible near the true source positions can be removed by applying the machine-learning-based de-noised image reconstruction technique or a threshold method that displays pixels only for intensities higher than a specific threshold, as proposed in our previous study [8, 9]. With the present results, we confirmed that YSECT.v.2 can be employed for much-higher-speed inspection of SNF assemblies in water than would be possible with PGET while providing similar source discrimination probability.
Conclusion
In this study, the YSECT.v.2 detector was designed and optimized for high-speed inspection of an SNF assembly in the water storage context. With the Geant4 and DETECT-2000 MC simulations, the length, slit width, and septal width of the collimator as well as the material and length of the trapezoidal-shaped scintillator were optimally determined to acquire high-quality tomographic images for the major radioactive nuclide of SNF (i.e., the 137Cs source) in water storage. Also, with the optimally designed YSECT.v.2 detector, we confirmed that the tomographic images reconstructed with MLEM+AC can clearly discriminate individual pins within the water-stored SNF assembly, even for the sources located near the center of the assembly. We believe that the highly sensitive YSECT.v.2 detector can be effectively employed with our previously developed machine-learning-based partial-defect discrimination technique to inspect SNF assemblies with high accuracy within the IAEA’s goal time.
In the future, we will perform an experimental evaluation of YSECT.v.2 performance with a mock-up water storage facility and mock-up SNF. Additionally, we will seek to further improve inspection speed by additionally developing a three-dimensional image reconstruction algorithm for sinograms acquired with YSECT.v.2’s spiral scanning.
Notes
Conflict of Interest
Kyunghoon Cho and Hakjae Lee serves ARALE Co. Ltd.; however, no potential conflict of interest relevant to this article was reported.
Ethical Statement
This article does not contain any studies with human participants or animals performed by any of the authors.
Author Contribution
Conceptualization: Chung YH, Yeom YS, You SH, Min CH. Methodology: Chung YH, Yeom YS, You SH, Min CH. Formal analysis: Choi HJ (Hyung-Joo Choi), Cho K, Lee H. Funding acquisition: Min CH. Project administration: Choi HJ (Hyung-Joo Choi), Choi HJ (Hyun Joon Choi), Min CH. Visualization: Choi HJ (Hyung-Joo Choi), Park H, Cheon BW, Choi HJ (Hyun Joon Choi). Writing - original draft: Choi HJ (Hyung-Joo Choi). Writing - review and editing: Choi HJ (Hyung-Joo Choi), Min CH. Approval of final manuscript: all authors.
Acknowledgements
This research was supported by the Nuclear Safety Research Program through the Korea Foundation Of Nuclear Safety (KoFONS) using financial resources granted by the Nuclear Safety and Security Commission (NSSC) of the Republic of Korea (No. 2106073); the Basic Science Research Program through the National Research Foundation of Korea (NRF) funded by the Ministry of Education (NRF-2021R1I1A1A010 5987512); the Korea Institute of Energy Technology Evaluation and Planning (KETEP), and the Ministry of Trade, Industry & Energy (MOTIE) of the Republic of Korea (No. 2021400000 0070).