1. INTRODUCTION
The decommissioning project for the Korea Research Reactor 1 (KRR-1) and KRR-2 was started in 1997 and has been carried out successfully. The release of the site and buildings from the regulations and non-nuclear purpose was a final goal of KRR decommissioning project. The assessment of residual radioactivity is to demonstrate in accordance with the established release criteria [1].
In situ gamma spectrometry has been used several situations and environments which has proven to be a powerful tool in demining the residual radioactivity in soil. When it is used to measure environmental radiation, assumptions are usually made about the depth distribution of the radionuclides of interest in the soil, in order to derive their activity concentration from the spectrum. The main limitation of in situ gamma spectrometry lies in determining the depth distribution of radionuclides [2]. For the radionuclides that have a depth dependent distribution in the soil, the distribution is assumed to three simple cases: homogeneous with depth such as natural radionuclides, contamination deposit on the surface such as the early stage of accident and exponential decreasing distribution. The contamination was deposited on the surface and migrated to the deeper layer during that time.
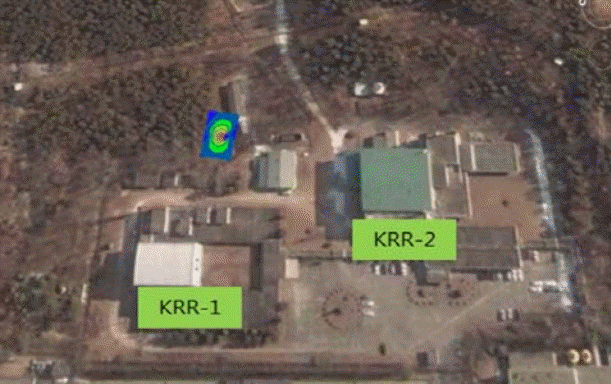
In this study, peak to valley method based on the ratio of counting rate between the full energy peak and Compton region was applied to identify the depth distribution of 137Cs. This concept of method was introduced [3] and proven to work in stationary in situ gamma spectrometry [4]. Using peak to valley method with single parameter (Q) made a correlation with exponential depth distribution and initial activity using calibration pad in the laboratory. The correlation results were applied to evaluate a residual radioactivity after remediation in decommissioning KRR site. The scoping and characterization survey was carried out to identify contamination levels and hot spots. The levels of contamination in most area were around background level, but the area around waste treatment facility was contaminated and removed. Figure 1 shows KRR site and contaminated area, a maximum contamination level was 9 Bq┬Ęg-1 with 137Cs.
2. MATERIALS AND METHODS
Soil samples were collected and analyzed to provide information on radionuclides ratios and depth distributions with laboratory based gamma spectrometry. We made an in situ gamma spectrometry of the 137Cs activity depth distribution, the different activity calibration pads were made and analyzed correlation with spectrum characterization with depth distribution. There have been several methods proposed to describe the activity depth variation from in situ measurement models. The peak to valley method only yields information about a single depth parameter. The technique can only be effectively applied to simple profile shape such as exponential distribution. For in situ gamma spectrometry, we used ISOCS (GC4019, Canberra, Meriden, CT) for evaluate the depth distribution for KRR site before remediation.
2.1 Evaluation method of depth distribution
This study, peak to valley method based on the ratio of counting rate between the photoelectric peak and Compton region was applied to identify the depth distribution of 137Cs. The procedure relies on a spectrally derived coefficient Q with depth activity distribution. The extension of the forward scattering of gamma ray is related to the interaction probability associated with the photon trajectory between sources and detector providing a measurement of source burial. The gamma photon flux in soil is a function of the soil density (Žü) in additional to source depth (z) the preference may be to quantify source burial in terms of mass depth of mass per unit area, which is given by Žüz.
where Q is spectrally derived coefficient, A is the area of the full energy peak, and BT is difference between the integrals of the immediately preceding and following regions (620-650 keV and the 670-700 keV). The Q value could calculate using region integrals, and corrected the contribution of 665 keV of 214Bi which is a number of series of the 238U. The Q value could calculate using the ration of full energy peak with the scattering region. In situ measured spectrum for calculation of the Q values shows in Figure 2.
The typical depth profiles of radioactive cesium can be fitted with an exponential function, indicating that the cesium concentration exponentially decreases with mass depth [4]. The vertical activity distribution can be described by the relaxation mass per unit area (╬▓) given by Equation 2. The soil depth profiles collected and analyzed by conventional gamma spectrometry, we determined the initial activity concentration (Ao) and relaxation mass per unit area (g┬ĘŃÄØ-2), which is defined as the reciprocal of the relaxation length of the exponential distribution, by fitting expression to the activity concentrations found in each layer as a function of the mass depth. The relaxation mass per unit area approaches infinity for a source with constant activity distribution and it approaches zero for a source distribution on the soil surface. The specific activity distribution with depth A(╬Š) is given in Eq. 2. The vertical activity distribution can be described by the relaxation mass per unit area (╬▓) given by Equation 3.
where ╬Š is the mass depth (g┬ĘŃÄØ-2) and A(╬Š) is the activity per unit mass (Bq┬Ęg-1).
2.2 In situ calibration correction
The observation result of relaxation mass per unit area around Fukushima area was reported main value is from 0.8 g┬ĘŃÄØ-2 to 1.2 g┬ĘŃÄØ-2 [5]. The activity depth distribution was demonstrated using the calibration pad sources. The exponential distributions from 0.5 g┬ĘŃÄØ-2 of surface contamination to 7.0 g┬ĘŃÄØ-2 of homogeneous distribution. The calibration pad source contaminated with 137Cs was made to demonstrate the depth distribution using in situ measurement. The size of the sources was 50ŃÄØ by 50ŃÄØ with 1ŃÄØ thickness and density was about 1.0 g┬ĘŃÄØ-3. The PE solution (PAA + PDADMAC) were applied to the contaminated soil for fixing contaminated soil. The calibration sources were made 800 ml of each solution with 2.2 kg of soil and dried at room temperature.
ISOCS system consists HPGe portable detector and a data collection with processing system. For in situ gamma spectrometry, we used ISOCS system with 40% relative efficiency, a 1.9 keV resolving power, and a peak to Compton ratio is 58:1 for the 1332.5 keV. The detector was fixed 50 ŃÄØ for measuring the depth distribution without shield in laboratory. The soil depth was change exponential distribution, surface contamination and homogeneous distribution from the surface to 5 cm depth with every 1 cm interval depth. To demonstrate the variety depth distribution, manufactured calibration pads was place pre-determined depth distribution. The calibration sources and experimental set up are show in Figure 3. We made an in situ gamma spectrometry of the activity and vertical profile in the contaminated area of decommissioning KRR site. In order to compare the depth distribution and contamination level the soil sample was analysis by conventional gamma spectrometry in laboratory.
3. RESULTS AND DISCUSSION
3.1 Laboratory measurement and simulation results
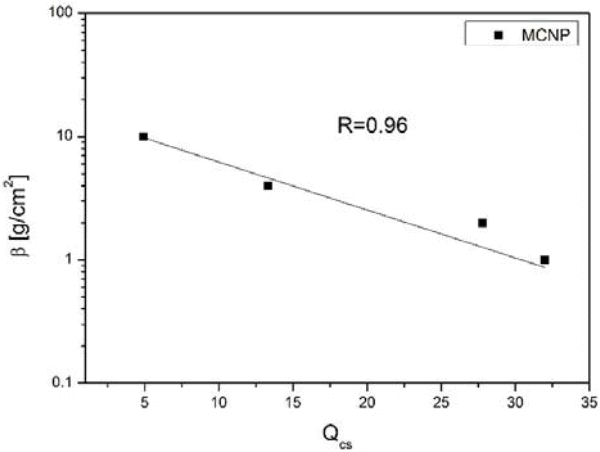
In order to simulate the scattering contributions due to the depth profile, a laboratory experiment and Monte Carlo simulation was conducted with the calibration sources. The peak to valley method could be applied to establish the relation between the spectrally derived coefficients (Q) with relaxation mass per unit area (╬▓) for various depth distribution in soil. The in situ measurement results and MCNP simulation results with correlation equation are shown in Figure 5. The simulation relationship between Q and source burial for the source layers have exponential relationship for a variety depth distributions. The statistical error on Q was calculated from measured spectrum for each depth distribution. The observation ranged from 10% to 17%. The correlation equation can be estimate the depth distribution without core samples measurement. The in situ measurement results and MCNP simulation results with correlation equation are shown in Fig. 5.
3.2 Field measurement results
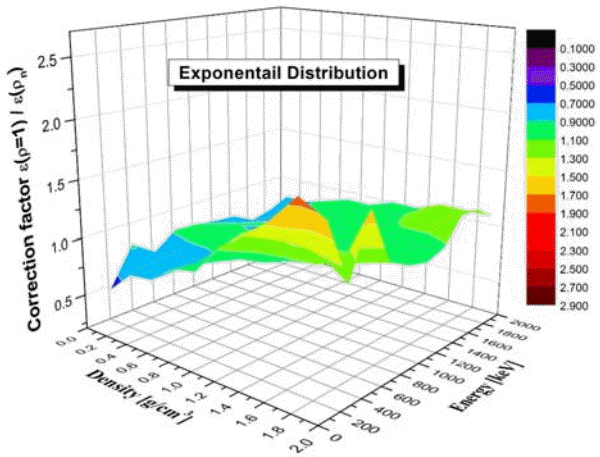
In case of recent deposition, 137Cs will be confined in the top layer of soil and diffusion would lead to a depth profile. We applied the peak to valley method to contaminated decommissioning KRR site to determine a depth distribution and initial activity without sampling. The in situ measurement results were compared with sampling results of core boring samples. The spectrally derived coefficients (Q) with relaxation mass per unit area (╬▓) and surface radioactivity was calculated for field measurement. It is required to calculate using Monte Carlo simulation due to the change of field of view (detected area). In this study the diameter of detected area was considered 100m with variety depth distribution. The results are given in Figures 6 and 7. For each depth distribution with different density and energy, 1├Ś108 photon histories were simulated the distributions for in situ gamma-ray measurement. The calculation result of the correction factor is shown in Figures 8 and 9. Application of peak to valley methods allows to establish a relationship the factor Q and the relaxation mass per unit area in Equation 4. The relationship factor Q and the radioactivity of the surface soil layer could express in Equation 5.
where N is the net count per second and Ao is initial activity (Bq┬Ęg-1).
The results applied in decommissioning KRR site show in Table 1. The observed results has a good correlation, relative error between in situ measurement with sampling result is around 7% for depth distribution and 4% for initial activity.
Different environmental soil samples usually have different densities. The investigation by simulation of soil matrix with different densities in the range from 0.2 to 2.0 g┬ĘŃÄØ-3 was carried out to figure out the dependence of detector efficiency as a function of the density and energy with different depth distributions. The photon transport from sources in the soil to the detector was simulated for self-absorption correction various depth distributions using MCNP6 code. The composition of soil and air was taken from ICRU report 53 [6]. For each depth distribution with different density and energy, 1├Ś108 photon histories were simulated the distributions for in situ gamma-ray measurement. The calculation result of the correction factor show in Figures 8 and 9.
The homogeneous distribution have more large correction factor than exponential distribution because self-absorption increase in deeper layer. The maximum correction factor for exponential distribution has 1.80 but homogeneous distribution has 2.67 at 59.5 keV with density 2.0 g┬ĘŃÄØ-3.
4. CONCLUSION
The radiological survey and evaluation technology are required to secure reliability of results and easily applied in field measurement. It is required a variety technology to verify that the residual contamination levels satisfied with the release criteria for site reuse after decommissioning. Korea Atomic Energy Research Institute (KAERI) has been developing in situ measurement technology to identify radioactivity depth profile in the field. In situ measurement provides techniques with rapid, cost-effective and spatially representative mapping contamination distributions.
In this study, the vertical activity distribution and initial activity of 137Cs could be identifying directly through in situ measurement. The evaluation results have an acceptable precision and calculated the self-absorption correction of exponential and homogeneous distribution. Therefore, the peak to valley method demonstrated good potential for assessment of the residual radioactivity in decommissioning and contaminated site.


