A Study of Shielding Properties of X-ray and Gamma in Barium Compounds
Article information
Abstract
Background
Ionizing radiation is known to be harmful to human health. The shielding of ionizing radiation depends on the attenuation which can be achieved by three main rules, i.e. time, distance and absorbing material.
Materials and Methods
The mass attenuation coefficient, linear attenuation coefficient, Half Value Layer (HVL) and Tenth Value Layer (TVL) of X-rays (32 keV, 74 keV) and gamma rays (662 keV) are measured in Barium compounds.
Results and Discussion
The measured values agree well with the theory. The effective atomic numbers (Zeff) and electron density (Ne) of Barium compounds have been computed in the wide energy region 1 keV to 100 GeV using an accurate database of photon-interaction cross sections and the WinXCom program.
Conclusion
The mass attenuation coefficient and linear attenuation coefficient for BaCO3 is higher than the BaCl2, Ba(No3)2 and BaSO4. HVL, TVL and mean free path are lower for BaCO3 than the BaCl2, Ba(No3)2 and BaSO4. Among the studied barium compounds, BaCO3 is best material for x-ray and gamma shielding.
Introduction
Ionizing radiation is known to be harmful to human health. The shielding of ionizing radiation depends on the attenuation which can be achieved by three main rules, i. e. time, distance and absorbing material. Shielding is the most effective technique and it is required against X-rays and gamma rays, which are very penetrating [1, 2]. Gamma radiation is best absorbed by dense materials consisting of heavy atoms such as lead and barium [3]. Barium is a dense alkaline earth metal in Group IIA- (alkaline earth metals) of the periodic table that occurs in nature as a divalent cation in combination with other elements. Two commonly found forms of barium are barium sulfate and barium carbonate, often found as underground ore deposits.
Shielding aprons manufactured from environmentally-friendly barium sulfate as a potential substitute for the lead aprons. Barium sulfate shielding can be processed easily to any type, with the same shielding ability as lead. Barium sulfate has long been utilized for in-vivo tests by employing the difference in density between soft tissues in radiology, and it is one of the most economic environment-friendly shielding materials [4]. Hubbell-Seltzer [5] tabulated the mass attenuation co-efficient for elements of atomic number Z=1 to 92 and for energy range 1 kev–100 GeV. Berger-Hubbell [6] developed a XCOM program to calculate a mass attenuation coefficients and it is based on the Hubbell-Seltzer theoretical data. Later, Gerward et al. [7, 8] transformed XCOM program to the Windows platform under the name WinXCom.
It is necessary to search for new radiation shielding materials to replace more toxic and dense shielding materials such as lead. Barium is less toxic and cost effective material compared to lead. Due to the importance of Barium compounds in radiation shielding, the study of an interaction of gamma radiation in these compounds becomes important. Hence in the present work, we have studied radiation shielding properties of Barium compounds. The photon attenuation coefficients (linear and mass attenuation coefficients), effective atomic number and electron density are basic quantities required in determining the attenuation of X-rays and gamma photons in matter. The aim of the present work is to measure the X-ray (32 keV, 74 keV) and Gamma (662 keV) shielding parameters such as mass attenuation coefficient, and linear attenuation coefficient, Half Value Layer (HVL) and Tenth Value Layer (TVL) in Barium compounds such as BaCl2, BaCO3, Ba(No3)2 and BaSO4. The effective atomic numbers (Zeff) and electron density (Ne) of Barium have been computed in the wide region 1 keV to 100 GeV using an accurate database of photon-interaction cross sections and the WinXCom program.
Meterials and Methods
1. Present work
1) Theoretical calculation of effective atomic number and electron density
In the present work, the mass attenuation coefficients and photon interaction cross sections in the energy range from 1 keV to 100 GeV are generated using WinXCom [7, 8]. The total molecular cross section σm [milli barn], is computed from the following equation using the values of mass attenuation coefficients [(μ/ρ)c]
where ni is the number of atoms of ith element in a given molecule, (μ/ρ)c is the mass attenuation coefficient of biomolecule, N is the Avogadro’s number, and Ai is the atomic weight of element i. The effective (average) atomic cross section for a particular atom in the compound σa [milli barn] is estimated using the equation,
The effective electronic cross section σe [milli barn] is computed from mass attenuation coefficient (μ/ρ)i of ith element in the given molecule using following equation,
where, fi is the fractional abundance (a mass fraction of the ith element in the molecule) and Zi is the atomic number of the ith element in a molecule. Finally the Zeff is estimated as
The effective electron density, Ne, expressed in terms of number of electrons per unit mass is closely related to the effective atomic number. For an element, the electron density is given by Ne=NZ/A [electrons/g]. This expression can be generalized for a compound,
In the present work, Ne and Zeff of Barium compounds are computed from Equations (4) and (5).
2) Measurement of mass attenuation coefficient of gamma and other derived gamma attenuation parameters
Transmission experiments with the narrow beam (good-geometry) setup were used for measuring the incident and transmitted intensities, and hence calculating the attenuation coefficient. The narrow geometry experimental setup used in the present measurement is as shown in Figure 1. We have used a NaI(Tl) crystal detector mounted on a photomultiplier tube housed in a lead chamber and a sophisticated PC based MCA for a detection purpose, gamma source such as 137Cs (661.6 keV) and Barium compounds such as BaCl2, BaCO3, Ba(No3)2 and BaSO4 as target samples. The sample was directly attached to the opening of the lead shield where source is placed. The integral intensities, I0 and I of the beam before and after passing through the sample are measured for sufficient time. (μ/ρ)c of the sample is then estimated using the relation.
Schematic diagram of the Experimental Setup. S: Source position, T: Target sample, L: Lead shielding, D: Detector, PM: Photomultiplier.
Where, t and ρ are the thickness and density of the sample respectively. Experimental values of Ne and Zeff of Barium compounds are obtained by substituting the measured values of (μ/ρ)c in Equations (1)-(5). Some of the earlier workers measured the mass attenuation coefficient of photons using alternate to transmission experiments [9, 10]. The high-purity Germanium spectrometers having poor efficiency but high resolution, NaI scintillation detectors have a poor energy resolution but high efficiency [11]. For intensity measurements, efficiency of the detector should be high rather than resolution. Many previous [12–15] workers used the NaI scintillation detectors for the measurement of mass attenuation coefficients. Hence we have used the NaI scintillation detectors for the measurements.
Results and Discussion
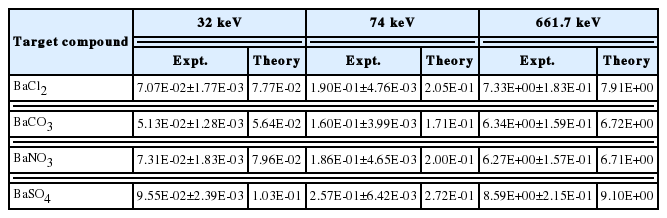
The measured 137Cs gamma spectrum in different thickness of target samples such as BaCl2, BaCO3, Ba(No3)2 and BaSO4 are shown in the Figures 2–5. The experimental mass attenuation coefficients are compared with the theoretical values and it is shown in the Table 1. This comparision shows that the measured values agree well with the theoretical values.
The measured 137Cs spectrum in different thickness of BaCl2 sample.
The measured 137Cs spectrum in different thickness of Ba(CO3)2 sample.
The measured 137Cs spectrum in different thickness of Ba(NO3)2 sample.
The measured 137Csspectrum in different thickness of BaSO4 sample.

Comparison of Measured Mass Attenuation Coefficients (cm2/g) with Theoretical Values
The total linear attenuation coefficient (μ) can be evaluated by multiplying density of compounds to mass attenuation coefficients.
The total linear attenuation coefficient (μ) is used in the calculation of HVL. HVL is the thickness of a shield or an absorber that reduces the radiation level by a factor of 2 that is to half the initial level and is calculated by the following equation
The total linear attenuation coefficient (μ) is also used in the calculation of TVL. It is the thickness of a shield required for attenuating a radiation beam to 10% of its radiation level and is computed by
The average distance between two successive interactions is called the relaxation length (λ). It is also called the photon mean free path which is determined by the equation:
The measured linear attenuation coefficients (cm−1), HVL (in cm), TVL (in cm) and mean free path (in cm) are compared with the theoretical values. This comparison is as shown in the Tables 2–5. The theoretical mass attenuation coefficients for the given compounds are computed for wide energy range 1 keV–100 GeV. These values are used in the calculation of linear attenuation coefficients (cm−1), HVL (in cm), TVL (in cm) and mean free path (in cm) for wide energy range 1 keV–100 GeV. Figures 6–8 show that the variation of HVL, TVL and mean free path for different barium compounds with energy. From these figures, it is found that for all compounds the values of HVL, TVL and mean free path remains constant from 1 keV to 10 keV. These parameters increase sharply up to few MeV and thereafter shows decreasing trend. From these figures it is observed that the HVL, TVL and mean free path increases up to the Epe and then decreases [16]. Here Epe is the energy value at which the photo electric interaction coefficients matches with Compton interaction coefficients. The variation of these parameters with energy is due to dominance of photoelectric absorption in the lower end and dominance of pair production in the higher photon energy region. In the lower energy end photoelectric absorption is dominant, hence these values are minimum. As the energy of incident photon increases, Compton scattering overtakes the photoelectric absorption. It results multiple Compton scattering events which increases these values up to the Epe and becomes maximum at Epe. Thereafter (above Epe), pair production starts dominating (absorption process) which reduces these parameters to minimum value.

Comparision of Measured Linear Attenuation Coefficients (cm−1) with Theoretical Values

Comparision of HVL (cm) with Theoretical Values
Comparision of TVL (cm) with Theoretical Values

Comparision of Photon Mean Free Path (cm) with Theoretical Values

The variation of Half Value Layer (HVL) with energy for different barium compounds.

The variation of Tenth Value Layer (TVL) with energy for different barium compounds.

The variation of Tenth Value Layer means free path or relaxation length with energy for different barium compounds.
The variation of Zeff with photon energy for total photon interactions is as shown in the figure 9 and this variation is because of dominance of different photon interactions. Zeff increases and becomes maximum and decreases sharply in the energy region 0.002–035 MeV. The variation of Zeff with energy is constant for 0.5 MeV to 2 MeV, From 2 MeV to 70 MeV increases and thereafter remains constant. The effective electron density shows similar trend as that of Zeff. The errors in the experiment came from two major sources; the counting rate error and the uncertainties on the thickness of target. The maximum errors in the total mass attenuation coefficients were calculated from errors in incident (I0) and transmitted (I) intensities and a real density (t) by using the propagation of error formula,
The variation of Zeff with energy for different barium compounds.
where ΔI0, ΔI, and Δt are the errors in the intensities I0, I, and thickness t of the sample, respectively. The error occurred in measured (μ/ρ)c is 2–3%.
Conclusion
We have studied the x-ray and gamma radiation shielding properties of Barium compounds such as BaCl2, BaCO3, Ba(No3)2 and BaSO4. The mass attenuation coefficient and linear attenuation coefficient for BaCO3 is higher than the BaCl2, Ba(No3)2 and BaSO4. HVL, TVL and mean free path are lower for BaCO3 than the BaCl2, Ba(No3)2 and BaSO4. Among the studied barium compounds, BaCO3 is best material for X-ray and gamma shielding.