Reduction of Outdoor and Indoor Ambient Dose Equivalent after Decontamination in the Fukushima Evacuation Zones
Article information
Abstract
Background
One of the most urgent issues following the accident at the Fukushima Daiichi nuclear power plant (FDNPP) was the remediation of the land, in particular, for residential area contaminated by the radioactive materials discharged. In this study, the effect of decontamination on reduction of ambient dose equivalent outdoors and indoors was evaluated. The latter is essential for residents as most individuals spend a large portion of their time indoors.
Materials and Methods
From December 2012 to November 2014, thirty-seven Japanese single-family detached wooden houses were investigated before and after decontamination in evacuation zones. Outdoor and indoor dose measurements (n=84 and 114, respectively) were collected based on in situ measurements using the NaI (Tl) scintillation surveymeter.
Results and Discussion
The outdoor ambient dose equivalents [H*(10)out] ranged from 0.61 to 3.71 μSv h−1 and from 0.23 to 1.32 μSv h−1 before and after decontamination, respectively. The indoor ambient dose equivalents [H*(10)in] ranged from 0.29 to 2.53 μSv h−1 and from 0.16 to 1.22 μSv h−1 before and after decontamination, respectively. The values of reduction efficiency (RE), defined as the ratio by which the radiation dose has been reduced via decontamination, were evaluated as 0.47±0.13, 0.51±0.13, and 0.58±0.08 (average±σ) when H*(10)out <1.0 μSv h−1, 1.0 μSv h−1 <H*(10)out <2.0 μSv h−1, and 2.0 μSv h−1<H*(10)out, respectively, indicating the values of RE increased as H*(10)out increased. It was found that the values of RE were 0.53±0.12 outdoors and 0.41±0.09 indoors, respectively, indicating RE was larger outdoors than indoors.
Conclusion
Indoor dose is essential as most individuals spend a large portion of their time indoors. The difference between outdoors and indoors should be considered carefully in order to estimate residents’ exposure dose before their returning home.
Introduction
The Great East Earthquake of magnitude 9.0 and the tsunami on 11 March 2011 in Japan resulted in major damage to the Fukushima Daiichi nuclear power plant (FDNPP). Following plural hydrogen explosions, a large amount of radioactive material was released into the environment and moved as a radioactive plume with the wind [1, 2].1),2), Due to the wind direction and the rainfall, large amounts of radionuclides were deposited northwest of the FDNPP.3), The environmental pollution caused by radioactive materials discharged by the accident has made it an urgent issue to promptly reduce the impact of this pollution on human health and the living environment. In August 2011, the “Act on Special Measures Concerning the Handling of Radioactive Pollution” was enacted in response to the unprecedented situation of radioactive pollution, and fully entered into effect starting in January 2012.4)
In this study, we evaluated the effect of decontamination on reduction of ambient dose equivalent outdoors and indoors for thirty-seven Japanese single-family detached wooden houses in Fukushima nuclear exclusion zones (the Special Decontamination Area) by conducting measurements before and after implementing decontamination. Indoor measurements and results are essential for residents as most individuals spend a large portion of their time indoors. The results of outdoor and indoor reduction efficiency were compared and the difference between them was discussed.
Materials and Methods
1. Measures for Decontamination of Radioactive Materials Discharged by TEPCO’s Fukushima Daiichi NPP accident
By 8 August 2013, the areas to which evacuation orders were issued were rearranged into three areas of Areas 1, 2 and 3, responding to the annual cumulative dose. Areas 1, 2 and 3 were those to which the evacuation orders were ready to be lifted (~20 mSv y−1), in which the residents were not permitted to live (20~50 mSv y−1), and where it is expected that the residents will have difficulty returning for a long time (50 mSv y−1~), respectively.5), The annual additional exposure dose, Dy was calculated using an equation as follows, assuming outdoor and indoor staying time is 8 h and 16 h, respectively.6)
, where DN is the air dose rate due to natural radiation from the earth, SF is the shielding factor. The SF values of 1 and 0.4 are applied for outdoors and indoors, respectively.7)
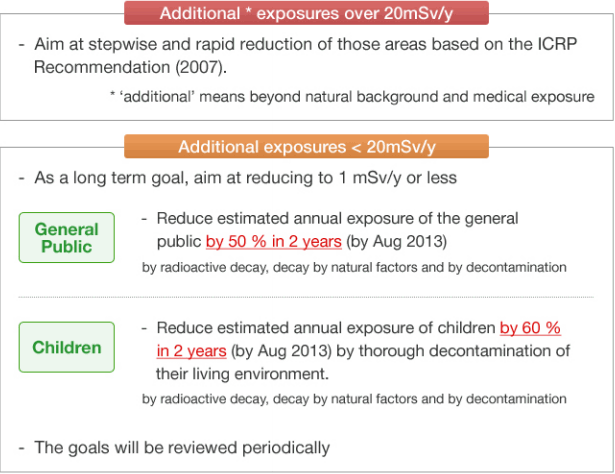
There are two categories of contaminated areas under the Act. The first one is the “Special Decontamination Area, SDA”, (<20 km from the FDNPP, or additional annual cumulative dose is >20 mSv) where decontamination is implemented by the national government. It includes 11 municipalities in Fukushima Prefecture. The second one is the “Intensive Contamination Survey Area, ICSA”, where decontamination is implemented by each municipality with financial and technical supports by the national government. The goals of decontamination, announced in the website of Ministry of the Environment (MOE) 5),, are described in Figure 1.
The MOE has formulated Decontamination Guidelines5),8), to explain these processes and provide concrete descriptions on each process of decontamination works. Proposed decontamination methods for residential area in the SDA is washing the roof and wall by high-pressure washing and brushing, cleaning gutter, topsoil (up to 5 cm of the soil layer) removal within 20 m radius from the house and vegetation removal at yard. The MOE reviewed the progress of decontamination in the SDA and recently announced that decontamination of residential area was completed in 6 municipalities and almost completed in Iitate village.9), In Odaka district in Minamisoma, it is aimed to complete the decontamination of the residential area within FY 2015.9), The MOE described the summary on decontamination effect based on their major results by national and local governments9), as shown in Figure 2.
Reduction effect is described as reduction rate (%) of air dose rate. The reduction rate expresses the percentage by which the radiation dose has been reduced via decontamination using the following formula.
The results indicate that the reduction rate increased as air dose rate increased.
2. Locations of Measurements
From December 2012 to November 2014, outdoor and indoor measurements for thirty-seven Japanese single-family detached wooden houses were conducted before and after decontamination in Iitate village (28 houses) and Odaka district in Minami-Soma (9 houses), Fukushima Prefecture, where both of the administrative districts have been designated as an evacuation zones. Iitate village is approximately 39 km northwest of the FDNPP, and Odaka district is within a 20 km radius of the FDNPP that used to be designated as a restricted area. Both areas were designated as SDA. The locations of the measurements are shown in Figure 3 as closed circles. The size of the circles depends on the numbers of the houses that were investigated at each location. Fifteen houses are in Area 1 and twenty-one in Area 2. The decontamination started from October in 2013 for houses investigated and was completed at November in 2014.
3. Outdoor and Indoor Measurements
The ambient dose equivalents were measured outdoors and indoors using the 1″ϕ×1″ NaI(Tl) scintillation surveymeter TCS-172B (Hitachi Aloka Medical, Ltd., Tokyo, Japan) at a height of 1 m above the ground or the floor. At each point, measurements were collected by changing the direction of the probe of the survey meter to the four directions of east, west, north, and south, and each measurement was repeated three times. An average of twelve data points was used for the calculations. The outdoor measurements were collected from one to three locations in an open field in an uncovered yard. These locations were selected from the front side of the main house because the backyard was small and quite close to the skirt of a hill or a mountain facing the soil surface of the slope in most houses, especially those in Iitate village. The location of each measuring point was recorded and the same points were investigated again after decontamination works were completed. Outdoor and indoor data set (n=84 and 114, respectively) before and after decontamination were collected. The indoor measurements were collected from two to four rooms where the residents spend much of their time, such as a living room, a bedroom, and a child’s room.
The gamma ray energy spectra were measured outdoors and indoors in the same way using the 3″ϕ×3″ NaI (Tl) scintillation spectrometer JSM-112B (Hitachi Aloka Medical, Ltd., Tokyo, Japan). The counting time was set to 900 s at every measurement. The obtained gamma-ray pulse height distributions were unfolded with the 22×22 response matrix method for the evaluation of concentrations of potassium, uranium, and thorium [3]. The absorbed dose rate in the air, obtained as nGy h−1, due to natural radiation sources in the environment was estimated using the conversion factors (13.0 nGy h−1 per % for potassium, 5.4 nGy h−1 per ppm for uranium, and 2.7 nGy h−1 per ppm for thorium) as evaluated by Beck et al.10) Then, the absorbed dose rate due to natural radiation sources was subtracted from total flux density, separating scattered gamma rays from mixed radiations to take the ratio of the scattered dose rate to the residual (the uncollided dose rate). This ratio (S/U) indicates gamma ray energy spectrum shape.
Results and Discussions
1. Dose Rates due to Natural Radiation Sources in the Environment
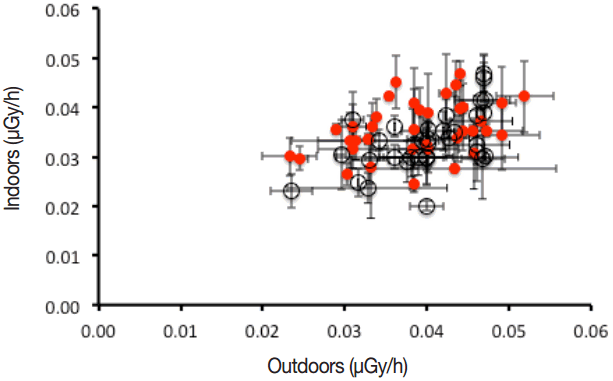
The values of the outdoor and indoor gamma-ray dose rate due to natural radiation sources in the environment before decontamination were compared with those taken after decontamination in Figure 4. In Figure 4, black circle and red circle indicate results before and after decontamination, respectively. The average values of the outdoor and indoor dose rates were 0.04±0.006 and 0.03±0.006 μGy h−1 with one standard deviation, respectively before decontamination. Those after decontamination were 0.04±0.007 and 0.04± 0.005 μGy h−1 with one standard deviation, respectively. The values of the gamma-ray dose rate before and after decontamination seemed to be similar. These values were the same level with that which was measured before the nuclear accident (30–40 nGy h−1) [4].
2. Outdoor and Indoor Ambient dose equivalent before decontamination
The values of the outdoor and indoor ambient dose equivalents for all of the data before and after decontamination are shown in Figure 5. A moderate linear relationship was observed, resulting in slope=0.43 and 0.52 (SE=0.49 and 0.21), respectively, for the outdoor and indoor values before and after decontamination when the linear fit was established for the data. This was due to artificial radionuclides which were released after the FDNPP accident as no clear relationship is usually observed between the indoor and outdoor gamma-ray dose rate due to natural radiation sources in the environment [5] as shown in Figure 4. The slope indicates SF, the shielding factor and the value of 0.43 before decontamination is similar with the representative value of 0.4 for wooden houses given in the IAEA-TECDOC-2257), and is consistent with the previous report [6].
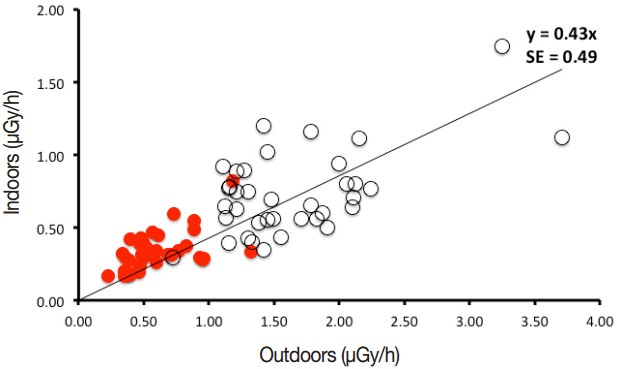
Values of the outdoor and indoor ambient dose equivalents before decontamination (○ circle) and after decontamination (● circle).
The outdoor ambient dose equivalents [H*(10)out] ranged from 0.61 to 3.71 μSv h−1 and from 0.23 to 1.32 μSv h−1 before and after decontamination. The indoor ambient dose equivalents [H*(10)in] ranged from 0.29 to 2.53 μSv h−1 and from 0.16 to 1.22 μSv h−1 before and after decontamination.
3 Reduction Efficiency
Reduction efficiency, RE was obtained by the same formula with Equation 2. The results of outdoor RE were shown in Table 1 for each outdoor ambient dose equivalents range. The results are better, compared with those (0.32–0.51) shown in Figure 2. The results in Figure 2 included the data in ICSA, where decontamination is implemented by each municipality and not every proposed decontamination method was applied for ICSA. This is considered to be the reason of the worse results in Figure 2, compared with those in Table 1. The results also indicate that the reduction rate increased as air dose rate increased. This is the same tendency observed in Figure 2. When H*(10)out is low, the effect of the dose rate due to natural radiation on the values of RE becomes large, as the dose rate due to natural radiation does not change before and after decontamination as shown in Figure 4. Net RE was obtained by subtracting the dose rate due to natural radiation from the dose rate as shown in the following Equation 3 and the results were shown in Table 1.
The values of net RE in Table 1 indicate that no significant difference in the values of net RE between H*(10)out<1.0 μSv h−1 and 1.0<H*(10)out<2.0, however, the value of net RE becomes large when H*(10)out exceeds 2.0 μSv h−1.
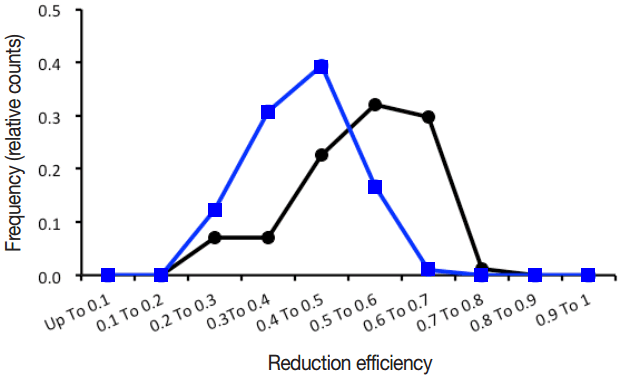
The frequency distribution of the outdoor and indoor reduction efficiency for 84 and 114 results, respectively, calculated using Equation 2 is shown in Figure 6. The average values of the outdoor and indoor RE were 0.53±0.12 and 0.41±0.09 with one standard deviation, respectively, indicating RE was larger outdoors than indoors. The average values of the outdoor and indoor net RE were 0.55±0.12 and 0.45± 0.09 with one standard deviation, respectively, calculated using Equation 2, indicating the same tendency with that obtained in RE. The relationship between the average values of outdoor and indoor reduction efficiency for each house was shown in Figure 7 (n=37), indicating the average values of the indoor RE were smaller than those of the outdoor RE for 31 houses.
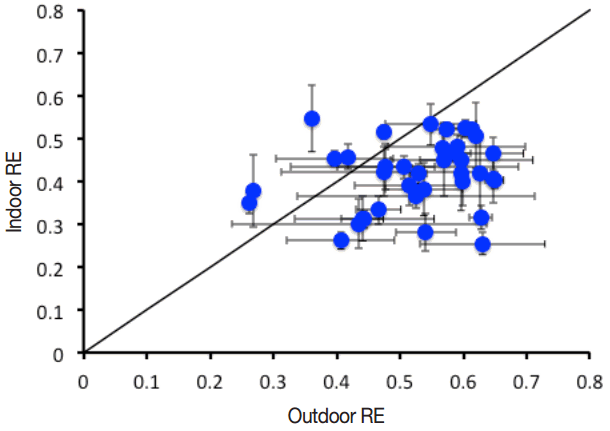
Relationship between the outdoor and indoor reduction efficiency for each house. The linear line with the slope of 1 indicate the value of outdoor RE is equal to that of the indoor RE. Error bars indicate one standard deviation.
The average values of S/U are shown in Figure 8. The results are divided into two groups of outdoor and indoor data for houses before and after decontamination. The values of the S/U were larger indoors than outdoors, indicating radiations are largely scattered indoors because of attenuation by the house structures such as walls, roofs, and windows. The both outdoor and indoor values of the S/U became larger for houses after decontamination, compared with those before decontamination. The increase of the S/U is larger outdoors than indoors. The outdoor S/U is smaller than the indoor S/U before decontamination, as the uncollided radiation emitted from radiocaesium in the contaminated soil around the house dominates outdoors. After removing topsoil around the house, the contribution from the uncollided radiation becomes small and that from the scattered radiation from the area beyond decontaminated area oppositely becomes large. The difference in the values of S/U between outdoors and indoors is considered to be one of the causes of the larger outdoor reduction efficiency than indoor reduction efficiency.
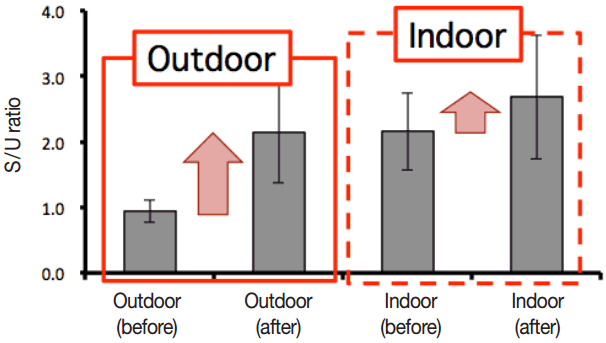
Average values of S/U in each group of outdoor and indoor data for houses before and after decontamination. Error bars indicate one standard deviation.
Outdoor and indoor RE was calculated using a Monte Carlo method by Dr. Kurosawa (National Institute of Advanced Industrial Science and Technology). Assuming topsoil (up to 5 cm of the soil layer) within 10-m radius from the house was removed, outdoor and indoor RE was estimated to be 0.65 and 0.39, respectively, indicating the same tendency with the measured results in this study.
Conclusion
We reported indoor and outdoor staying time (home and school) for children [7]. We found that children spent most time (14–15 hours a day) at the inside of their houses for all ages investigated and they stay at the inside of their houses and school about 21 hours a day in a total. In this study, we showed that RE was larger outdoors than indoors. The Japanee government is planning to lift evacuation order by the end of FY 2016 in Area 1 and 2. For estimating exposure dose, outdoor air dose rate and outdoor reduction efficiency are used, however, there is a difference in air dose rate and reduction efficiency between outdoors and indoors as shown in this study. Indoor dose is essential as most individuals spend a large portion of their time indoors. The difference between outdoors and indoors should be considered carefully in order to estimate residents’ exposure dose before their returning home.
Notes
Nuclear Emergency Response Headquarters of Government of Japan. Report of the Japanese Government to the IAEA Ministerial Conference on Nuclear Safety—The Accident at TEPCO’s Fukushima Nuclear Power Stations. 2011. http://japan.kantei.go.jp/kan/topics/201106/iaea_houkokusho_e.html
Nuclear Emergency Response Headquarters of Government of Japan. Additional Report of the Japanese Government to the IAEA—The Accident at TEPCO’s Fukushima Nuclear Power Stations—(Second Report). 2011. https://www.iaea.org/sites/default/files/japanreport120911.pdf#search=%272%29+Nuclear+Emergency+Response+Headquarters+of+Government+of+Japan.+Additional+Report+of+the+Japanese+Government+to+the+IAEA-The+Accident+at+TEPCO+Fukushima+Nuclear+Power%27
Nuclear Regulation Authority of Japan, Monitoring information of environmental radioactivity level, Results of Airborne Monitoring by the MEXT and the U.S. Department of Energy. 2011. http://radioactivity.nsr.go.jp/en/contents/4000/3180/view.html
Website of Ministry of the Environment. http://josen.env.go.jp/en/
Website of Minister of Economy, Trade and Industry. http://www.meti.go.jp/english/earthquake/nuclear/roadmap/pdf/20130807_01.pdf
Website of Ministry of the Environment. http://www.env.go.jp/press/file_view.php?serial=18437&hou_id=14327
International Atomic Energy Agency. Planning for off-site response to radiation accidents in nuclear facilities.1979. IAEA-TECDOC-225. http://www.iaea.org/inis/collection/NCLCollectionStore/_Public/11/531/11531386.pdf
Website of Ministry of the Environment. http://josen.env.go.jp/material/pdf/josen-gl-full_ver2_supplement1412.pdf
Website of Ministry of the Environment. http://josen.env.go.jp/en/pdf/progressseet_progress_on_cleanup_efforts.pdf?150601
Beck H L, et al. In-situ Ge(Li) and NaI(Tl) gamma-ray spectrometry. Health and Safety Laboratory Report HASL-258. 1972. http://www.osti.gov/scitech/servlets/purl/4599415
