Detailed Analysis of the KAERI nTOF Facility
Article information
Abstract
Background:
A project for building a neutron time-of-flight (nTOF) facility is progressing. We expect that the construction will start in early 2016. Before that, a detailed simulation based on the current architectural drawings was performed to optimize the performance of our facility.
Materials and Methods:
Currently, several parts had been modified or changed from the original design to reflect requirements such as the layout of the electron beam line, shape of the vacuum chamber producing a neutron beam, and the underground layout of the nTOF facility. Detailed analysis for these modifications has been done with MCNP simulation.
Results and Discussion:
An overview of our photo-neutron source and KAERI nTOF facility were introduced. The numerical simulations for heat deposition, source term, and radiation shielding of KAERI nTOF facility were performed and the results are discussed.
Conclusion:
We are expecting that the construction of the KAERI nTOF facility will start in early 2016, and these results will be used as basic data.
1. INTRODUCTION
To measure the neutron cross sections, the time-of-flight method is widely used. The project for building a neutron time-of-flight (nTOF) facility is progressing [1-5]. We are expecting that the construction will start in early 2016 at the Korea Atomic Energy Research Institute (KAERI). The main idea of the time-of-flight method is very simple. The speed of a neutron is proportional to its energy. If we know the length of the flight path and flight time, we can calculate its energy. In Figure 1, a pulsed electron beam incident at time t0 and the generated neutron fly distance L and provide a signal to the detector at time ts. Considering the uncertainty of the flight time, Δt, the total elapsed time of the neutron can be calculated using Equation (1). The speed of the neutron is calculated with Equation (2) and can be converted to energy using Equation (3).
A schematic view of the time-of-flight method.
where L is the length of the flight path, mn is the mass of the neutron, and c is the speed of light. The design of the nTOF facility at KAERI is shown in Figure 2. The electron beam is extracted from the next building and is bent 90° downward to the photo-neutron source which is located at the underground floor. Neutrons are produced at the photo-neutron source and are emitted toward the 4π directions. We can get the neutron beam to measure the neutron cross sections through the collimator.
The design of nTOF facility at KAERI.
Main purpose of this facility is measuring nuclear data in fast energy range. Expecting performances of this facility are listed in the Table 1.

Expecting Performance of KAEI nTOF Facility
2. MATERIALS AND METHODS
2.1 Photo-neutron source
To produce a neutron, we use the photonuclear reactions in liquid lead. The mechanism for neutron production is shown in Figure 3. An incident electron beam produces bremsstrahlung photons in the liquid lead. The produced bremsstrahlung photons have a photonuclear reaction with liquid lead and produce neutrons with a white spectrum.
The mechanism for neutron production.
The photo-neutron source that will be installed at the KAERI nTOF facility is shown in Figure 4. The electron beam is incident to the molybdenum tube where liquid lead flows inside of it.
The photo-neutron source for the nTOF facility at KAERI.
2.2 Heat analysis
To have a good time resolution, multiple scattering in the target should be avoided. Let’s consider big and small targets like Figure 5. If the target is big, produced neutron will undergo multiple scattering before escaping the target and this may increase the uncertainty, Δt, in Equation 1. However, if the target is small, produced neutron will have less scattering than when big target is used.
The neutron scattering; (left) big target, (right) small target.
The simplest way to minimize multiple scattering is minimizing the size of the target. However, a small target causes a cooling problem because an electron beam is incident to the small target. This is why we prefer to use liquid lead as the target material. Using the liquid lead for the target material to produce neutrons is not new. At the Helmholtz Zentrum Dresden Rossendorf (HZDR) [6], they use a liquid lead target to produce a neutron beam and produce a good performance in the nuclear data measurement field. An electron beam is incident at the molybdenum tube, which is located inside the vacuum chamber shown in Figure 6. The layout of our photo-neutron source loop is shown in Figure 7. To see the energy deposition profile in the molybdenum tube, a Monte Carlo simulation was performed. The profile of the incident electron beam is assumed to have a Gaussian distribution, which is shown in Figure 8.
The vacuum chamber of photo-neutron source.
The layout of the photo-neutron source loop.
Profile of the incident electron beam.
In the MCNP simulation, 10,240 cells are used to tally the deposited energy as shown in Figure 9, and the parameters of the heat analysis are listed in Table 2.
MCNP modeling for Mo-tube.
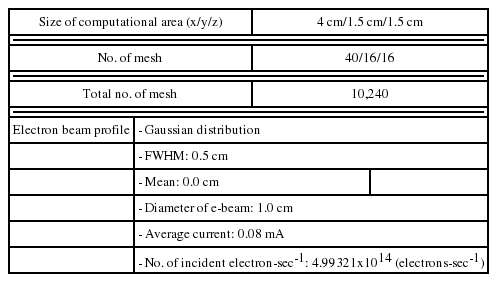
Parameters for Heat Analysis
In the photo-neutron source, heat is produced not by conduction but by a reaction inside of a Mo-tube. The simulation was done where the Mo-tube is located as shown in Figure 10. The maximum heat position is shown in Figure 11. The total power of the electron beam is 1.36 kW. About 71% is absorbed in the computational zone. The maximum heat generation position is at a 0.2 cm depth from the Mo-tube surface. Detailed results are listed in Table 3.
The location where heat analysis was done and overall heat deposition profile.
Maximum heat generation position (0.2 cm depth from the Mo-tube).
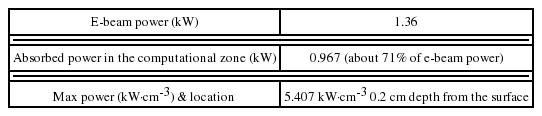
The Results of Heat Analysis
2.3 Source term analysis
The characteristics of a bremsstrahlung photon and neutron produced from the photo-neutron source are analyzed. The MCNP model for the source term is shown in Figure 12. The vacuum chamber is consists of SS316 and liquid lead is inside of Mo-tube. The simulation was performed using an incident electron beam on the Mo-tube, and the resulting gamma and neutron flux distributions are shown in Figure 13. Neuron and gamma outgoing fluxes are tallied on the six faces of the Mo-tube, and the yields of gamma and neutron are listed in Table 4.
MCNP modeling for source term analysis (Mo-tube and vacuum chamber).
Three dimensional flux distribution; (left) gamma, (right) neutron.
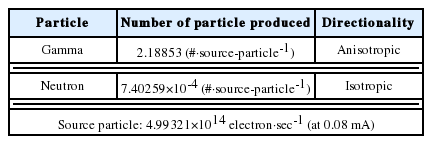
Yield of Gamma and Neutron Produced
The number of neutrons per one-source particle is much smaller than the number of gammas. However, the directionality of a neutron is isotropic. For this reason, running two separate Monte Carlo simulations is more efficient.
The first one is modeling from the electron beam to the bremsstrahlung gamma because a bremsstrahlung gamma is very anisotropic and its yield for one-source particle is 2.18853. The other one is modeling a neutron as a point source with the energy spectrum in Figure 14 because a neutron is produced isotropically and its yield for a one-source particle is very small.
Spectra of outgoing neutron flux on the Mo-tube.
2.4 Shielding analysis of nTOF facility
The outside of the nTOF facility at KAERI is a public area such that we should apply a public dose limit for a shielding analysis. Considering that the public dose limit is 1 mSv·year-1, with a 2,000 hours·year-1 operation time, and a safety factor of 1/2, the dose limit for our facility is 0.25 μSv·h-1. The xy layout of the nTOF facility is shown in Figure 15. Monte Carlo simulations were performed with the results of the source term analysis and architectural drawings. The simulated dose profiles are shown in Figures 16 and 17.
The xy layout of nTOF facility (underground floor).
Dose profile on xy plane.
Dose profile on xz plane.
The dose outside of radiation zone is satisfied with our dose limit, which is 0.25 μSv·h-1 in Figures 16 and 17. However, a lot of radiation is leaked out through the vertical hole (r=2.5 cm) where the electron beam passes though. The shielding material used to cover the ditch for the electron beam line is not considered in Figure 17. To cover the ditch, 100 cm thick concrete is added and shown in Figure 18.
Layout to cover the electron beam line ditch.
The calculated dose profile on the xz plane with a 100 cm concrete cover is shown in Figure 19. We can see that the radiation leakage in Figure 17 is fully stopped. The thickness of the cover of the ditch is not optimized yet. In a real facility, in view of maintenance of the electron beam line, stacking of the concrete bars might be used.
Dose profile on xz plane with 100cm concrete cover.
3. CONCLUSION
The KAERI nTOF facility consists of two main parts. One is the photo-neutron source and the other one is the nTOF facility itself. For the photo-neuron source, an overview, heat analysis, and source term analysis are presented. For the nTOF facility itself, shielding analysis results are covered in this paper. We are expecting that the construction of the KAERI nTOF facility will start in early 2016, and these results will be used as basic data.