Kwon, Hwang, and Jae: Ingestion Dose Evaluation of Korean Based on Dynamic Model in a Severe Accident
Abstract
Background
In terms of the Level 3 probabilistic safety assessment (Level 3 PSA), ingestion of food that had been exposed to radioactive materials is important to assess the intermediate- and long-term radiological dose. Because the ingestion dose is considerably dependent upon the agricultural and dietary characteristics of each country, the reliability of the assessment results may become diminished if the characteristics of a foreign country are considered. Thus, this study intends to evaluate and analyze the ingestion dose of Korean during a severe accident by completely considering the available agricultural and dietary characteristics in Korea.
Materials and Methods
This study uses COMIDA2, which is a program based on dynamic food chain model. It sets the parameters that are appropriate to Korean characteristics so that we can evaluate the inherent ingestion dose of Korean. The results were analyzed by considering the accident date and food category with regard to the 137Cs.
Results and Discussion
The dose and contribution of the food category depicted distinctive differences based on the accident date. Particularly, the ingestion dose during the first and second years depicted a considerable difference by the accident date. However, after the third year, the effect of foliar absorption was negligible and exhibited a similar tendency along with the order of root uptake rate based on the food category.
Conclusion
In this study, the agricultural and dietary characteristics of Korea were analyzed and evaluated the ingestion dose of Korean during a severe accident using COMIDA2. By considering the inherent characteristics of Korean, it can be determined that the results of this study will significantly contribute to the reliability of the Level 3 PSA.
Keywords: Ingestion dose, Level 3 PSA, Dynamic model, Severe accident, COMIDA2
Introduction
An ingestion dose assessment is performed to assess the intermediate- and long-term radiological dose of the Level 3 probabilistic safety assessment (Level 3 PSA). While the ingestion dose assessment is excluded from the evaluation of initial period of a severe accident due to its minimal effect, it can be a quantitative rationale to establish the intermediate- and long-term public health policy following a severe accident.
Ingestion dose may appear large differences by the diet of each country or the characteristics of the agricultural environment. Especially, the diet considerably depends on the country. For example, main diet of Korean includes rice and kimchi while that of Japanese includes a diverse range of fish dishes; further, that of American includes bread and salads. Agricultural characteristics may include cultivation environment such as rice paddies, differences in growth characteristics, or different sowing or harvest periods based on the climate of each country; thus, each country shows meaningful differences in the ingestion dose assessment.
However, most studies on Level 3 PSA in Korea often employ the agricultural and dietary characteristics of foreign countries. They generally use MELCOR accident consequence code system 2 (MACCS2) code, and MACCS2 uses COMIDA2 code [ 1] based on a dynamic food chain model to evaluate the ingestion dose. Most of Level 3 PSA studies neglect the food ingestion dose assessment based on the inherent characteristics of Korean, resulting in degradation of the reliability of their results. Therefore, to obtain reliable results from Level 3 PSA studies, it is important to evaluate an ingestion dose by considering the inherent agricultural and dietary characteristics of one’s own country. Further, this study analyzed the inherent agricultural and dietary characteristics of Korean, evaluated the ingestion dose using COMIDA2 along with multiple accident dates, and examined the contribution of each food category.
Materials and Methods
1. Food Chain Model
This study used COMIDA2 code to evaluate the ingestion dose by contaminated food consumption of Korean. COMIDA2 is a dynamic food chain model to connect the COMIDA and MACCS2 codes developed in 1993 and its structure of the transfer model is shown in Figure. 1. COMIDA2 simulates the behavior of radionuclides such as the release to the atmosphere and deposition on the surface of the soil and crops. Also, the impact of daughter products is included to assessment results as the code considers the radioactive decay. The deposited radioactivity materials are interactively transferred through a total of five compartments including three soil layers by depth (surface soil, labile soil, and fixed soil), surface and inner tissue of crops and are eventually consumed by people so that the contaminated crops influence the public exposure.
The concentration of radioactive materials by compartment can be derived using the first-order differential equations as follows:
Here,
K
r
: resuspension rate constant (d−
1),
K
rs
: rainsplash rate constant (d−
1),
K
w
: weathering rate constant (d−
1), λ: decay rate constant (d−
1),
K
ab
: foliar absorption rate constant (d−
1),
R
up
: root uptake rate (Bq·kg−
1·d−
1),
K
sen
: senescence rate constant (d−
1),
K
p
: percolation rate constant (d−
1),
K
de
: fixed soil desorption rate constant (d−
1),
K
l
: leach rate constant (d−
1),
K
ad
: fixed soil adsorption constant (d−
1).
At this point, to trace the concentration change of radioactive materials by time the initial conditions are given as follows:
Here,
The interception fraction in Eq. (6) refers to the fraction of radioactive materials deposited on the vegetation surface that are released from the accident place. The released radioactive materials are divided into the vegetation surface and the surface soil, and then Eq. (7) refers to the amount of radioactive materials deposited on the surface soil. The interception fraction increases in proportion to the growth of vegetation, which is expressed in Eq. (11). Here,
α: foliar interception constant (m2·kg−
1),
B(t): biomass of standing crop at the time of deposition (Bq·kg-dry−
2).
The concentration of edible part can be derived by Eq. (12) using the concentration on each compartment by using Eqs. (1) to (5). The edible portion refers to the portions of the crops that are consumed by people. The evaluation time in Eq. (12) is in Julian day, and Eq. (12) evaluates the concentration of the edible portion from the harvested crops. Here,
QC
ij
: total concentration of the edible part of the radionuclides j in crop i (Bq·kg-wet−
1),
Q
vs,ij
: concentration of the vegetation surface at the time of harvest (Bq·m−
2),
Q
vs,ij
: concentration of the internal vegetation at the time of harvest (Bq·m−
2),
TVC
i
: transfer coefficient from the directly exposed portion to the edible part of crops ingested by people (unitless),
BMAX
i
: biomass of the edible part of vegetation at the time of harvest (kg-dry·m−
2),
FD
i
: ratio of dry to wet weight (unitless),
TEC: time of harvest (Julian day).
Using Eq. (12), the concentration of the radionuclides j deposited on crop i can be determined, whose result depicts the contribution of the vegetation surface and internal tissues to the edible portion. Although the radionuclides absorbed by the inner tissue of vegetation are all ingested by people, those attached on the vegetation surface are partially ingested as much as the fraction of those that are moved to the edible portion. However, it takes time for the deposited radioactive materials to contaminate the inner tissue of vegetation through foliar absorption or root uptake from the vegetation surface; thus, the concentration of contaminated inner tissue of the vegetation increases as the time gap from the deposition on the vegetation surface to the harvest increases. Therefore, all the deposition concentrations inside and on the surface of vegetation are dependent on the accident date and the harvest date. Using the edible part concentration that has been evaluated by Eq. (12), the ingestion dose can be derived using Eq. (13). Here,
D
i
: individual ingestion dose (Sv),
A: area for evaluation (m2),
N: number of the radionuclides (unitless),
F: number of the food categories (unitless),
GC
k
: ground concentration of radionuclide k (Bq·m−
2),
DS
k
: COMIDA2 individual dose-to-source ratio of radionuclide k (Sv·Bq−
1·yr·kg−
1),
CR
j
: individual consumption rate for the food category j (kg·yr−
1).
Eq. (13) considers only the effect of a single radionuclide. This study considers only the effect of parent radionuclides in evaluation, excluding the physical characteristics of specific radionuclides. According to Eq. (13), the individual dose can be derived by multiplying four factors ( A, GC
k
, DS
k
, CR
j
).
2. Selection of Korean Inherent Parameters
1) Accident scenario
(1) Radionuclide
This study evaluates only 137Cs in such a manner that 137Cs is the radionuclide that makes a key contribution to vegetation contamination and radioactive exposure due to the ingestion of contaminated vegetation in the intermediate- and long-term, as has been exhibited in the case of the Chernobyl Nuclear Disaster or the Fukushima Daiichi Nuclear Disaster.
(2) Accident date
COMIDA2 can repetitively perform the evaluation up to nine accident dates per unit execution. The accident date is referred as Julian day, according to which January 1 is Julian day 1 and February 1 is Julian day 32. Due to the characteristics of the code, it is assumed that when accident occurs, radioactive materials are released so that the accident date and the release date of the radioactive materials remain identical. This study evaluates the effective dose due to ingestion by the accident on Julian day 1 (January 1), Julian day 61 (March 2), Julian day 121 (May 1), Julian day 151 (May 31), Julian day 181 (June 30), Julian day 201 (July 20), Julian day 241 (August 29), Julian day 271 (September 28), and Julian day 301 (October 28).
(3) Time calculation system
Because 1 year in the results of COMIDA2 refers to 365 days beginning at the date of the accident, the user should be cautious. Figure. 2 depicts the 1-year-concept in the evaluation in case that the accident date is Julian day 121. The 1-year-period in evaluation results differs from the calendar year and is different from a 1-year-period beginning with harvest date; thus, the concept of evaluation time can vary with the accident date should be predetermined to understand the ingestion dose.
(4) Food category
The food categories in COMIDA2 are classified into nine categories based on the ingestion subject, the direct deposition on the edible part, the roughness of the vegetation surface, and the biological characteristics of the edible part. Vegetable foods ingested by humans consist of five categories, such as grains, leafy vegetables, root vegetables, fruits, and legumes, whereas animal foods consist of four categories, such as beef, milk, poultry, and others, the last of which was used to evaluate the effect of pork ingestion in this study. Pork is the most consumed meat in Korea. The fact that pork has been excluded from the existing evaluation targets indicate the drastic difference between the dietary habits of the US and Korea.
2) Analysis target
(1) Food consumption
Korea Health Industry Development Institute offers the results of statistical processes of “the National Nutrients Statistics” by the Korea Center for Disease Control and Prevention. This study used the average value of the annual adult consumption per food category for five years from 2011 to 2015. Food ingestion and production in COMIDA2 assume 100% self-sufficient within the interesting area; thus, this study considered the self-sufficient rate by food category in Korea. The self-sufficient rates by food category were taken from the annual food supply report that was published by the Korea Rural Economic Institute for 5 years from 2011 to 2015 and calculated the average value. Meat and milk products were also based on the food self-sufficient rate in the way excludes the processed food such as sausage and cheese that uses imported meat and milk. Furthermore, eggs that have been included in the “Other” food category were classified to be integrated to the poultry group.
(2) Feed ingestion by livestock
To satisfy the assumption of 100% self-sufficient within the interesting area by COMIDA2, the study evaluated only the amount of production in Korea among the feed ingestion by livestock. Feed crops for livestock in COMIDA2 belong to five categories such as pasture, hay, grains, legumes, and soil; however, considering the livestock conditions in Korea, pasture and soil that are usually consumed by the livestock during grazing are neglected, whereas the data for hay, grains, and legumes are obtained using the statistical data. The feed ingestion of livestock differs based on seasons and growth stages; thus, the study evaluated the yearly average feed ingestion to the amount of ingestion per a day.
(3) Other parameters
The important dates in evaluation are as follows: crop tillage date, the start and end dates of crop growing season, the start date of the pasture and hay growing season, the starting and ending dates of livestock grazing season and the exposure duration to radioactivity during the grazing the milk cow [ 2]. The ratio of dry to wet weight is the conversion factor between the dried weight and fresh weight, which depends on vegetation [ 3]. The processing factor refers the remaining ratio of radionuclides after cooking, and widely differs depending on the recipe. While we conservatively assumed that there is no loss of radioactive materials, most contamination that was observed on leafy vegetables were caused by direct deposition on leaves. Thus, it was assumed that 0.5 of the ratio was used to consider that the radioactive materials would be lost by washing the leafy vegetables. This value was referred from the IAEA literature, which reported the range between 0.1 and 0.9; thus, in this study, a median value of 0.5 was considered [ 4]. The transfer coefficient by radionuclide is the concentration ratio when the concentration in the feedstuff and meat products are in equilibrium, and the values of egg were replaced to that of pork [ 5]. The ingestion dose coefficient was obtained from the value given by ICRP 72 [ 6], which was based on the concept given by ICRP 60, corresponding to the radiation protection standards in Korea.
Results and Discussion
1. Dose Analysis Based on the Accident Date
The individual effective dose by the accident date due to the ingestion of 137Cs is shown in Figure. 3. The evaluation was based on the seeding date for Julian day 121 and the harvest date for Julian day 273. The total amount of contamination is directly deposited on the surface soil on Julian day 1 and 61 before seeding and on Julian day 301 after harvest, whereas the contamination is deposited separately on the vegetation surface and surface soil on Julian day 121, 151, 181, 201, 241, and 271. The dose after three years over all accident dates decreases in a similar tendency. The individual effective dose in the first year on Julian day 1, 61, and 301 was lower than that in the second year, which is because the accident occurred during the non-growing season of the crops. The reason for the low ingestion dose in the first year on day 1 as compared to that in the first year on day 61 was because there was 60 more days until the seeding day and because the concentration on the soil was diluted. Similarly, Julian day 301 had also 180 days until the seeding day in the next year so that the soil concentration was further diluted, and the ingestion dose in the first year Julian day 301 was lower than that with Julian day 1. Here, soil dilution is caused by two factors. The first is the decay of radionuclides, and the second is the transition outside the compartment such as leaching or adsorption. However, if an accident occurs between Julian day 121 and 273, the amount of contamination deposited on the vegetation surface as compared to that on the surface soil became larger so that the dose in the first year increased and the dose in the second year decreased. Furthermore, the highest dose on Julian day 271 was approximately 18,000 times higher than the lowest dose on Julian day 301 in the first year.
2. Dose Analysis by Representative Point in Time
By referring to Figure. 3, this study classified the individual effective dose based on the annual variations by the accident date and food category and analyzed the effective dose based on the following three accident dates: Julian day 121, which represents the period just after seeding; Julian day 271, which represents the period just before harvest; and Julian day 301, which represents the period after harvest or before seeding. First, in case of the accident on Julian day 121, one-year referred to by this result is the 365-day-period from Julian day 121 in the accident year to Julian day 120 in the next year. At this point, the ingestion dose in the ninth year when the exposure to radioactivity becomes minimal is 6.20×10−
9 mSv per (Bq·m−
2), which is approximately 1,200 times lower than the ingestion dose during the first year with the maximum exposure to radioactivity at 7.70×10−
6 mSv per (Bq·m−
2). Crops are harvested on Julian day 273, the first harvest date, and are consumed without delay from Julian day 273 to Julian day 365 in the current year and from Julian day 1 to Julian day 272 in the subsequent year for a total of 365 days. However, the concept of one-year is initialized on Julian day 121; thus, for the crops that are harvested in the first year, the ingestion dose in the first year is the dose that is ingested from Julian day 273 in the first year to Julian day 120 in the second year for approximately 210 days; further, part of the ingestion dose in the second day is the dose that is ingested from Julian day 121 in the second year to Julian day 272 for approximately 150 days. Therefore, the ingestion dose is high in case of both the first and second year crops. From the second year’s crops, the direct deposition on the vegetation surface was observed to become extremely rare; further, we observed that most of the contamination occurs by root uptake. Thus, the concentration of crop contamination tends to be dependent on the concentration of the labile soil and the dose exhibited a drastic fall after the third year which the crops grown on this soil with much lower concentration.
Subsequently, in case of the accident on Julian day 271, one-year referred to by this result is the 365-day-period from Julian day 271 in the accident year to Julian day 270 in the subsequent year. Having been almost grown near the harvest, the interception factor of crops is considerably large such that most of the radioactive materials are directly deposited on the vegetation surface; thus, the amount of radioactive materials deposited on the surface soil becomes very small. The fraction of deposition on the vegetation surface on Julian day 271 was 80.5% of the total amount of released radioactive materials, which was the maximum amount as compared to that observed on other accident dates. Therefore, the crops that are harvested in the second year absorb 19.5% of the released radioactive materials through the root uptake, which is the smallest as compared to that on the other accident dates; thus, the dose after the second year was smaller than that on other accident dates. Furthermore, Julian day 271 was just two days before Julian day 273, the harvest, which is a very short period as compared to the half-life of 137Cs; hence it is difficult to expect the reduction effect based on the radioactivity decay inside the contaminated crops. The one-year in this result is almost identical to the crop ingestion period such that the first year’s dose is 1.40× 10⁻⁴ mSv per (Bq·m−
2), which is more than 99% of the total dose at 1.41×10⁻⁴ mSv per (Bq·m−
2). With the drastic decrease in dose, the second year’s dose becomes 9.10×10⁻⁷ mSv per (Bq·m−
2), which is approximately 150 times lower than that in the first year.
Finally, in case of the accident on Julian day 301, one-year referred to by this result is the 365-day-period from Julian day 301 in the accident year to Julian day 300 in the subsequent year. In an accident on Julian day 301, which is after the harvest, the complete amount of the released 137Cs is deposited on the surface soil. The fraction deposited on vegetation surface is approximately 0.2% to 3.5% of the total crop contamination by crop, which is caused by resuspension and rainsplash after the first direct deposition on the surface soil. Excluding this, most of the other contamination are caused by the deposition on the surface soil. Therefore, the crops that are sowed and harvested in the following year are usually contaminated by the root uptake. In this case, the accident occurred after the harvest and crop contamination did not occur in that year; thus, the non-contaminated crops are ingested until the harvest in the subsequent year. The ingestion dose in the first year is caused by ingestion of contaminated crops for approximately 40 days from the harvest on Julian day 273 in the following year to the accident date on Julian day 301. The first harvested, contaminated crops that appear the highest concentration are ingested for approximately 30 days during the first year and for approximately 335 days during the second year; accordingly, the ingestion dose in the second year that depicts the longer ingestion period is 2.40×10⁻⁸ mSv per (Bq·m−
2), approximately 12 times higher than the first year’s ingestion dose of 7.50×10⁻⁹ mSv per (Bq·m−
2).
3. Dose Contribution Analysis by Food categories of Representative Points in Time
1) Accident on Julian day 121
The dose contribution by food category based on the accident on Julian day 121 is shown in Figure. 4. The food category that is most dominant in the first year is grains, which takes up almost half of the total amount among food categories. This is because the ratio of dry to wet weight of grains is large and because growth of grains is faster as compared to the growth of the other food categories. With the rapid growth of grains, the interception factor also increases, leading to an increase in the direct deposition on the grains vegetation surface, which further causes an increase in the transferred amount of contamination toward the inner tissues of vegetation. Unexpectedly, the effect of fruits is secondarily dominant. This is because there is a large amount of ingestion of fruits as a result of self-sufficiency. After the third year, the contribution of fruits was most significant. This is because all the foods that are harvested in the first year are all consumed until the second year, whereas those harvested in the second year are mainly consumed during the third year; further, the harvested foods after the second year would exhibit a negligible amount of contamination that is directly deposited on the vegetation surface, and most contaminations would be caused through root uptake. Therefore, the ingestion dose contribution of fruits with a higher root uptake rate increased by approximately 2.1 times; for the same reason, the contribution level of leafy vegetables and legumes also increased by approximately 1.2 and 1.5 times, respectively. The root uptake rate is dependent upon the concentration factor by crop and radionuclides and the growth rate by crop; in this study, the former factor was observed to be dominant. Most meat exhibited a contribution of 10% or less; this is because the livestock in Korea do not consume pasture that is directly exposed to radioactive materials during an accident and because other feeds are indirectly ingested by humans through livestock. It was determined that there was rare difference in the values after the sixth year as compared to the values of the previous year.
2) Accident on Julian day 271
The dose contribution by food category based on accident on Julian day 271 is depicted in Figure. 5. As opposed to the case with the accident on Julian day 121, there was no distinctive food category; instead, all the food categories contributed in a relatively even manner. As compared to the accident that occurred on Julian day 121, the contribution of grains and fruits during the first year decreased while that of leafy vegetables, poultry, and pork increased considerably. The increase in the contribution of leafy vegetables is due to the largest ingestion despite the fact that the concentration was fourth highest following that of legumes and grains. The increase in the contribution of poultry and pork was caused by the amount of feed crops, such as grains and legumes that the concentrations of them increased. Further, feed crops have been contaminated just before the harvest, and highly concentrated contaminants were provided to livestock such that the effect on poultry and pork was considerable. After the third year, the accident on Julian day 271 also exhibited a considerable impact of root uptake, exhibiting a similar tendency to that of the accident on Julian day 121; further, after the sixth year, the level was approximately the same as that of the previous year.
3) Accident on Julian day 301
The dose contribution by food category based on accident on Julian day 301 is depicted in Figure. 6. As mentioned above, the high contribution of fruits is caused by the fact that most of the 137Cs has been deposited on the surface soil after the harvest and the main contaminants of crops that were sowed on day 121 in the subsequent year was root uptake. Therefore, as opposed to the accidents on Julian days 121 and 271, the contributions by food categories maintained at a relatively constant ratio.
Conclusion
This study evaluated the individual effective ingestion dose using dynamic food chain model in case of a severe accident on 9 accident dates by considering the agricultural characteristics in Korea based on the release of 137Cs radionuclides. Additionally, the study evaluated pork ingestion dose by using the “other” food category that reflects the dietary characteristics of Korean. While meat generally had a lower dose contribution than the crops, in case of an accident on Julian day 271, pork also contributed to the ingestion dose by more than 10% until the initial two years.
Furthermore, the analysis of the accident on Julian days 121, 271, and 301, which were important agricultural dates, exhibited that the accident dates had a close relation to the sowing day and the harvest day. Based on the accident date, an individual ingestion dose was at its maximum on Julian day 271 in the first year at 1.4×10⁻⁴ mSv per (Bq·m−
2) and was at its minimum on Julian day 301 at 7.50×10⁻⁹ mSv per (Bq·m−
2); there was a difference of approximately 18,000 times between them. In the former case, the almost fully-developed crops blocked most of the deposition on the surface soil, which caused a decrease in the soil concentration; therefore, the ingestion dose after the third year was at the minimum compared to those of the other accident dates. Further, during the first and second year after the accident, the food category that made the largest contribution to the dose was differed by the accident date; therefore, a mitigate action for a radioactive accident should be different by the accident date as well. After the third year, the contribution of food categories to the ingestion dose was the largest in case of fruits, which was followed by the contribution in case of grains and root vegetables due to the root uptake rate; further, there were some small differences by the accident dates based on other factors.
However, because of the limitations of the code, COMIDA2 cannot distinguish between the sowing day and harvest day by food category. Therefore, further effort is required to recognize and complement the fact that there may be some difference between the evaluated and actual doses in case of a severe accident. Furthermore, a sensitivity analysis of the input variables should be performed to determine the sources of the concentration in crops and soil and the doses in a reliable manner. A reliable dose evaluation that considers the daughter products will be conducted in future studies.
References
1. Abbott ML, Rood AS. COMIDA: a radionuclide food chain model for acute fallout deposition. Health Phys. 1994;66(1):3-33.  2. Hwang WT, Cho GS, Han MH. Development of a dynamic food chain model DYNACON and its application to Korean agricultural conditions. J Nucl Sci Technol. 1998;35(6):454-461. 3. Korea Atomic Energy Research Institute. A Development of computer code for evaluating internal radiation dose through ingestion and inhalation pathways. KAERI/RR-998/90. 1990;152-157.
4. International Atomic Energy Agency. Handbook of parameter values for the prediction of radionuclide transfer in terrestrial and freshwater environments. IAEA Technical Reports Series no.472. 2010;147.
5. Idaho National Engineering and Environmental Laboratory. COMIDA input parameters and sample input files, Appendix A. NUREG/CR-6613. 1998;15-16.
6. International Commission on Radiation Protection. Age-dependent doses to the members of the public from intake of radionuclides-part 5 compilation of ingestion and inhalation coefficients. ICRP Publication 72. Ann ICRP. 26(1):1995;1-91.
Fig. 1
Agricultural contamination transfer model of the radionuclides in COMIDA2. 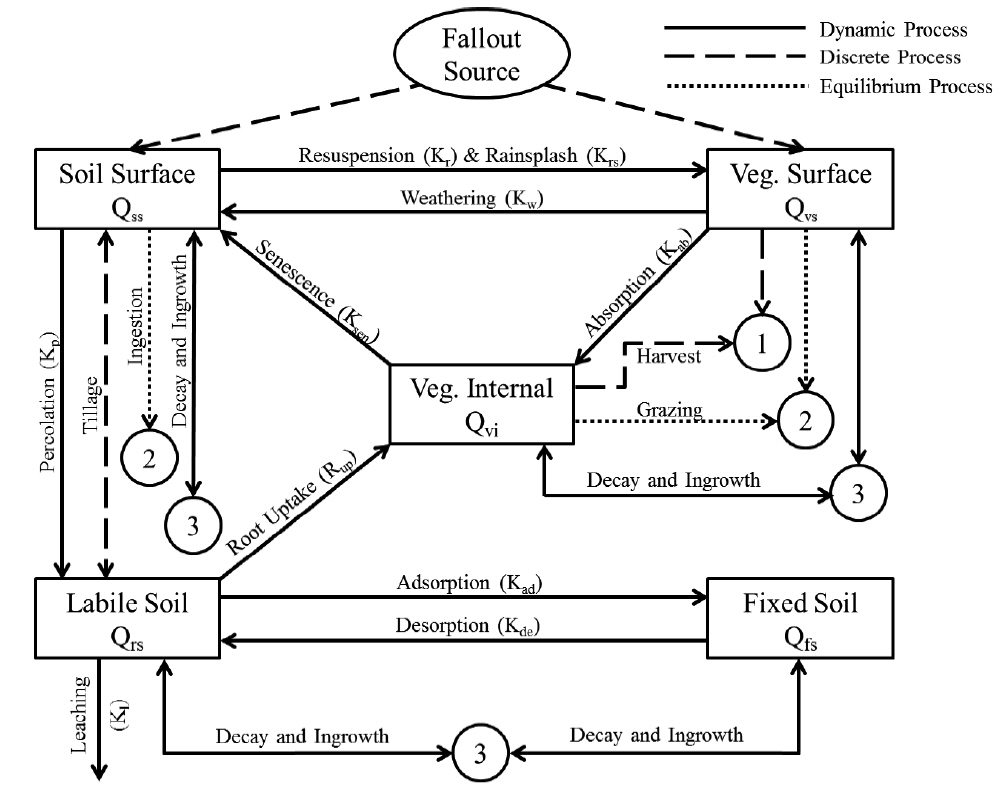
Fig. 2
An example of time frame for dose calculation (Accident date: Julian day 121). 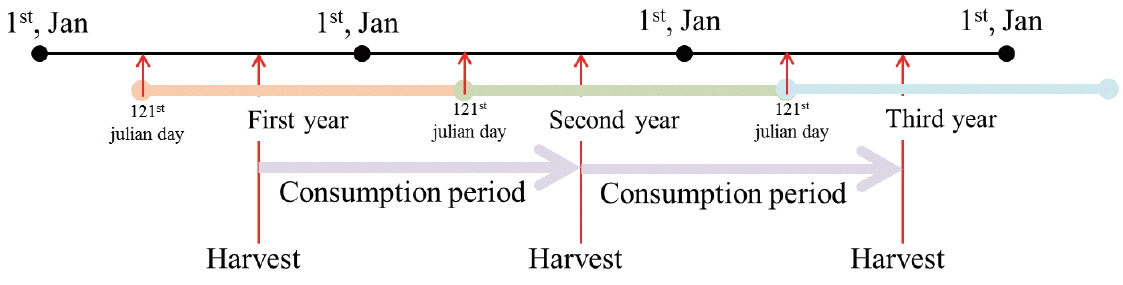
Fig. 3
Effective ingestion dose of 137Cs along with 9 accident dates for an individual. 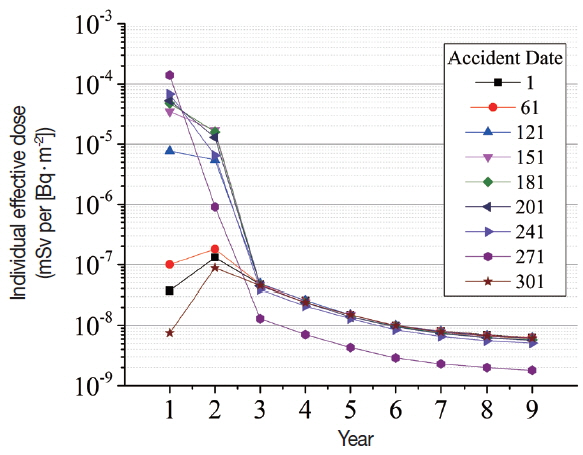
Fig. 4
Dose contribution of each food category for 5 years (Accident date: Julian day 121). 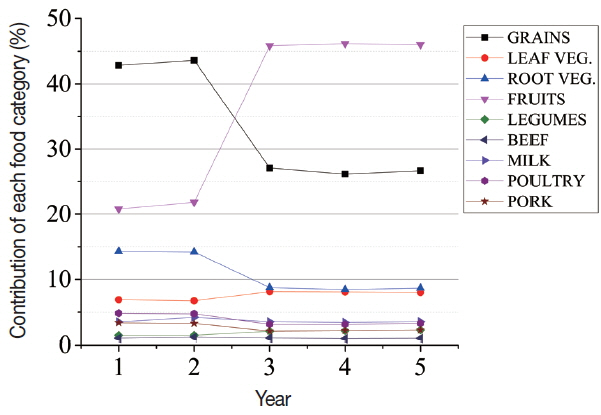
Fig. 5
Dose contribution of each food category for 5 years (Accident date: Julian day 271). 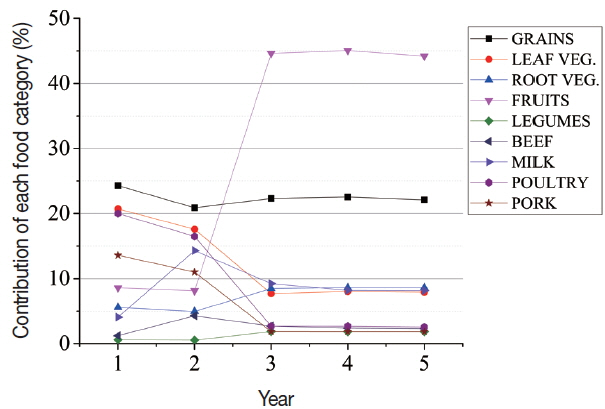
Fig. 6
Dose contribution of each food category for 5 years (Accident date: Julian day 301). 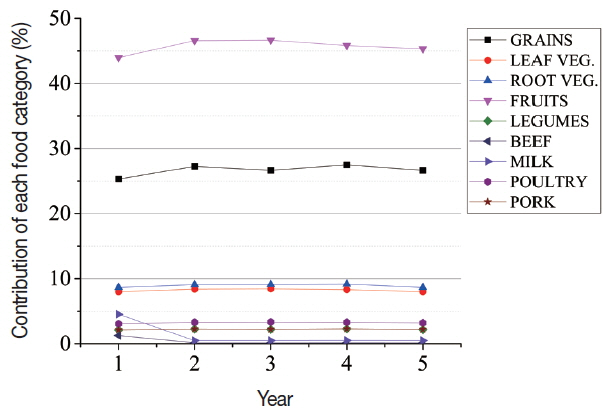
|
|