

Introduction
The volumetric modulated arc therapy (VMAT) is a state of art radiotherapy technique. It is now widely performed in clinical practice. It uses synchronous variation of leaf speed, gantry speed, and dose rate to deliver highly complex radiation dose distribution. Its technological complexity may lead to the difference between planned dose and delivered dose. The more sophisticated the technology is, the more intuitive verification method is required. Much efforts have been devoted to verify the delivering accuracy of VMAT. The good quality assurance (QA) of VMAT plan can be taken to be one of major challenges for the success of VMAT treatment.
The dosimetric accuracy in VMAT treatment delivery is influenced by many factors: multileaf collimator (MLC) movement, machine output and dose rate, gantry rotation, collimator setting, patient setup, etc. How much each factor effects the dosimetric accuracy may depend on the situation where it is done. The final dosimetric error is a comprehensively joined result led by all factors together, and it is very difficult to separate the comprehensive effect into individual component’s one based on quantitative amount. In other words, we don’t know which factor caused the final dosimetric error the most or least. Different researchers investigated the effect of erroneous MLC leaf movement [1–10], gantry movement [1, 2, 4], collimator movement [6, 8], dose delivery [1–3, 8], dose calculation error [1, 11–14] caused by limitation of the dose calculation algorithm or erroneous beam modeling, and several other human errors [15]. In this research we focused only on MLC movement in real VMAT delivery.
MLC QA activities are regularly done to evaluate the MLC movement accuracy of the clinical linear accelerator (LINAC). Task group 142 report [16] and medical physics practice guideline (MPG) 8.a [17] from American Association of Physicists in Medicine (AAPM) are the most followed guidelines for MLC QA. They suggested the tests based on beam modulation of fixed gantry intensity modulated radiotherapy (IMRT). Netherlands Commission on Radiation Dosimetry (NCS) report 24 [18] is the only comprehensive guideline for MLC QA for VMAT. All of these guidelines recommend weekly/monthly, and annual MLC QA. However, researches [10, 19] described that daily MLC QA is essential. LINAC log file analysis is a good option to evaluate MLC movement accuracy in any VMAT session [1, 4, 16, 19–22]. However, these recommendations and Korean guideline [23] give general and comprehensive tolerance on MLC performance and said nothing of that for individual MLC leaf movement.
We introduced here “mid-term” as a full treatment period of a patient treatment case for convenience. How can we predict the mid-term quality of LINAC performance in VMAT delivery? Tracking daily positional variation of leaf movement error as well as dosimetric error can play a significant role of predicting the daily-based quality such as reproducibility of beam delivery in VMAT session over the treatment period. In this research, we tried to track the positional variations of both individual leaf movement error and dosimetric error on a daily basis in real VMAT treatment delivery assuming that the constant and stable positional variation within acceptable fluctuation be a good sign of mid-term quality of VMAT delivery for the machine used.
In this work, we selected five real VMAT cases, which were under treatment. A number of commercialized software and tools (DoseLab, Dynalog File Viewer, Argus IMRT etc., for example) are common in clinical use to analyze MLC movement but these have the limitation to evaluate the infield spatial MLC position error distribution, as occurred in any VMAT session. In order to estimate MLC performance, we used a MATLAB program with MLC positional data in Dynalog file [24] and DICOM RTPLAN file [25], first to determine which of the MLC leaves used in a leaf bank had the maximum positional error (maxPE), secondly, to estimate where the maxPE occurs along the path of the leaf movement, and finally, to track the daily variations of the maxPE position over the entire treatment period. In order to estimate the constancy of delivered dose, we first estimated the X and Y coordinate of the high gamma index region (HGR) from portal dosimetry [26] (Varian Medical Systems, Palo Alto, CA, USA) and then traced the daily variation of the coordinate over the entire treatment period.
Materials and Methods
This study aims to monitor the mechanical and dosimetric stability of the medical LINAC in delivering all VMAT sessions of VMAT plans for five most common treatment sites. To achieve the purpose of this work two information were tracked on a daily basis; MLC movement and delivered dose error. For the former the MLC movement data from DICOM RTPLAN file of each VMAT plan and dynalog file of each VMAT sessions were analyzed whereas gamma analysis from portal dosimetry were used for the latter according to guidelines in AAPM TG report 119 [27].
1. Equipment and tools
This study was based on the data collected from daily plan QA and treatment sessions of VMAT plans. All VMAT plans were created with Eclipse (Version 11, Varian Medical Systems, Palo Alto, CA, USA) TPS using PRO algorithm [28] (version 11, Varian Medical Systems, Palo Alto, CA, USA) and AAA algorithm [29, 30] (version 11, Varian Medical Systems, Palo Alto, CA, USA) for aperture optimization and dose calculation, respectively. These VMAT plans were delivered with NovalisTx (Varian Medical Systems, Palo Alto, CA, USA) medical LINAC, equipped with HD 120 MLC (Varian Medical Systems, Palo Alto, CA, USA), and aS1000 portal imaging device (EPID) (Varian Medical Systems, Palo Alto, CA, USA). Portal dose was evaluated with the TPS using PDIP (Version 11, Varian Medical Systems, Palo Alto, CA, USA) algorithm [26, 29, 31]. We used MATLAB (Version: R2017b, MathWorks, Massachusetts, USA) program to manipulate data in all dynalog files and DICOM RTPLAN files for calculating MLC movement error.
2. Selection of VMAT plans
We selected one VMAT plan per treatment site of brain, head & neck, chest, abdomen, and pelvic region from patients under treatment. Four VMAT plans were of conventional dose fraction scheme and one plan for abdominal region was of hypo-fractionation scheme. Basic information of selected treatment plans of this study is shown in Table 1.
3. Positional tracking of MLC movement error
MLC position error is one of the key concerns for beam modulation accuracy of VMAT. This measures the difference between planned and actual MLC position. We used MATLAB program to calculate the planned MLC position at each 0.05 second time interval with MLC position information in DICOM RTPLAN file and gantry position and information in VMAT field property file of each VMAT plan. DICOM RTPLAN file and VMAT plan property files were collected from the TPS after each VMAT plan was accepted for treatment. Besides, the MATLAB program extracted the daily-based dynalog file information of actual MLC position for each 0.05 second interval of each VMAT sessions for respective VMAT plans. Dynalog files were collected from 4D Integrated Treatment Console (4DITC) of LINAC computer console after each VMAT session. DICOM RTPLAN file contains planned leaf position (X) at each CP and VMAT field property contains the data of gantry position, gantry speed (Δθ/Δt) for each control point (CP). We determined planned leaf position for each 0.05 seconds of VMAT delivery using equation 1, where c and n are CP number and time tag under the CP number, respectively. Total number of time tags available in the full VMAT session was the sum time tags under each control point.
Dynalog file contains the record of planned and actual MLC position at each 0.05 seconds interval of beam delivery. All leaf position in the time tags for beam held ‘on’ status was removed. Then, we collected actual MLC positions from dynalog files and multiplied with the magnification factor 1.9662 to get actual MLC positions on the horizontal plane through isocenter. The magnification factor is the ratio of the distance between source and MLC bottom to that between MLC bottom and isocenter; both of these distances were collected from data in DICOM RTPLAN file. We collected the planned position, calculated in this way for each MLC leaf of each leaf bank. Then we calculated MLC position error for each 0.05 seconds of beam delivery using equation 2, where N is the total number of 0.05-second long segments of beam delivery.
Maximum root mean square error (maxRMS) and 95 percentile error of MLC position are the two dynalog file analysis based parameters, recommended in AAPM TG 142 report [16] and Korean NCSS notification 2015-005 [23] for MLC position accuracy in IMRT delivery and emphasize the spread of MLC position error magnitude. However, these cannot give us the insight of how much the position of maxPE is shifted in daily VMAT sessions of full treatment period. This evaluation is needed to understand whether the associated MLC position error randomly occurs daily in discrete MLC positions inside the treatment field. We found no commercial software to track this and no guideline from any professional organization or regulatory body.
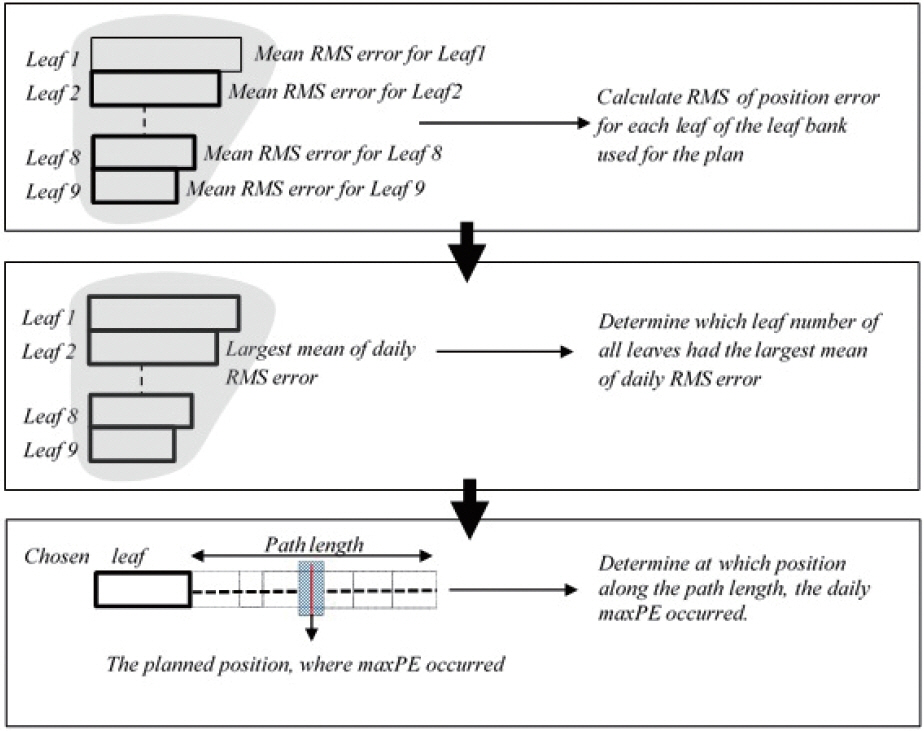
In this work, we didn’t track all leaves used for the treatment. Instead of tracking all leaves, we selected a representative leaf number and then tracked it. Which leaf number is qualified as a representative one is determined as shown in Figure 1. We first used MATLAB program to calculate the RMS of position error of each leaf in the leaf bank, using equation 3, where N is the total number of time tags. The cross checked the calculation of MATLAB program for maxRMS against that of a commercialized software (DoseLab, Version: 4.0, Mobius Mobius Medical Systems, Texas, USA) and those showed good agreement. Dynalog File Viewer (DFV) [24] provided by the LINAC manufacturer (Varian Medical Systems, Palo Alto, CA, USA) can be also used to get the same information, but MATLAB program were finally adopted for this study, because both of them showed the same result and MATLAB had broader extendibility for other application. Second, we determined which leaf number had the largest mean value of daily RMS error among all leaves. Finally, we tracked on a daily basis in which section along the path length of the selected leaf number the leaf’s maxPE occurred (refer to Figure 1).
4. Positional tracking of dosimetric error
In this step, we aimed to monitor how consistently dosimetry error occurs in or around the same position. We determined this from the daily shift of the center of dosimetric error regions. Dosimetric error regions were daily determined through gamma analysis of daily portal dose with (3%-3 mm) criteria as per recommendation of AAPM TG report 119 [27]. Global gamma analysis was done with improved gamma algorithm to evaluate subpixel dose error. Normalization mode was set to absolute as per recommendation from the EPID and TPS manufacturer (Varian Medical Systems, Palo Alto, USA), and local gamma threshold was set to 20%. Portal Dosimetry Reference Guide [26] gives the details of different tools of portal dosimetry module in Eclipse (Version 11, Varian Medical Systems, Palo Alto, USA). The high gamma region (HGR) is defined as the region with >1 gamma index and many HGRs be found in one plan. In this research, instead of all of these HGRs, we selected only those of >1 cm length. Those HGRs were representative HGRs because only those would be tracked.
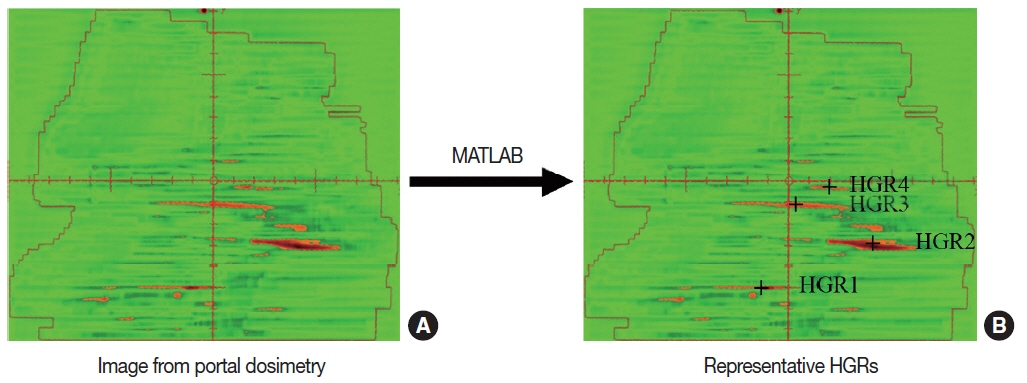
Ideally, the center of each irregular shaped HGR should be calculated from its infinitesimally segmented areas. However, for simplicity, we determined it with the simple method of finding center of mass of flat bar on X coordinate, keeping Y coordinate of the center constant. First, daily image of two-dimensional distribution of gamma index for daily plan QA session was collected from TPS. The tools of portal dosimetry application in the TPS could be used for manually determining the X coordinate of HGR border. In order to calculate it automatically, the image file was imported from portal dosimetry into MATLAB program, which gives a matrix of numerical values for different colors on the picture and calculates the X coordinate of left and right margin of HGR and its center using equation 4. Red areas in Figure 2A show the HRSs and ‘+’ signs in Figure 2B show the centers of representative HGRs for a portal dose distribution. The daily shift of any HGR center from its mean position in the full course of treatment was also determined using the equation 5. D and N in equation 4 and 5 represent the treatment day and HGR tag, respectively.
Results and Discussion
Mechanical reproducibility and dosimetric consistency of the used LINAC in delivering VMAT sessions in the full course of treatment was evaluated by investigating daily positional variation of maxPE and HGRs. The former parameter was evaluated for the leaf that had maximum value of mean daily position RMS error whereas the latter parameter was evaluated for the center of representative HGRs.
1. Positional tracking of MLC movement error
Leaf performance can be different from leaf to leaf and from day to day. It is of great importance to verify the mid-term individual leaf performance because it could influence significantly the final dose delivery accuracy. However, it is not realistic in clinical practice to track and monitor every active leaf’s movement over a full course of treatment session. In this research, we determined a representative leaf according to the aforementioned procedure in Materials and Methods section, which was used to test the mid-term leaf performance on behalf of all active leaves.
The Figure 3A shows which specific leaf numbers were selected as representative ones for five treatment cases. The daily-based individual RMS error of each active leaf was calculated using MATLAB and averaged over full session of treatment. The maxRMSs in Figure 3 represent the mean maxRMS over the period. We then tracked the representative leaf, monitored where its maxPE occurs along its moving track, and analyzed the distribution of its displacement from its first position. The Figure 3B shows how displaced the maxPEs were from their first displacement position, where y-axis represents the elapsed treatment days. For prostate and liver, maxPE position are distributed very closely to first position and breast case shows the similar trend, but brain and tongue show broader distribution rather than other three cases. We guess carefully it has something to do with plan’s modulation level; the more complex the modulation, the broader the displacement of maxPE. The maxPEs in the brain and tongue cases were distributed broader than in other cases, but all data were found located within ±0.5 mm. These findings prove excellent mid-term performance of MLC reproducibility in VMAT treatments over a full course of treatment and lead to infer carefully that all other leaves would have the similar performance as representative leaf. It of course goes without saying that the representative leaf could not represent all leaves, but this approach will give a simple and useful way of monitoring the mid-term performance of MLC leaves for VMAT treatment.
In this work, the new parameter, positional variation of maxPE in VMAT sessions was used to evaluate mid-term performance of MLC leaf movement. There was an interesting relation found between the magnitude of the shift of maxPE position and maxRMS of the leaf position. Mean shift were 0.09 and 0.07 mm, when maxRMS of leaf position were 0.8, 0.99 mm for tongue and breast, respectively, but mean shift were <0.02 mm, when maxRMS of leaf position were <0.42 mm for liver and prostate. In general, maxRMS of the leaf position characterizes the complexity of beam shape. The observed relation between maxRMS of leaf position and positional shift of maxPE comes from the fact that MLCs are forced to move with higher speed and acceleration in control areas of VMAT plans of complex beam shape. Though this study randommely selected VMAT plans without consideration of beam shape complexity, further study can be done with larger number of VMAT plans of variaus beam modulation.
2. Positional tracking of dosimetric error
One of two axes in this study to assess mid-term performance of VMAT treatment was to track the location of dosimetric error on a daily basis, which was based on the assumption that good repetition of dosimetric error would reflect stable performance of LINAC machine. Visual evaluation and quantitative analysis were introduced here to see how daily dosimetric errors go over a full treatment period, where visual tracking can be helpful for intuitive understanding of the changes. Quality Assurance of VMAT plan delivery is usually performed in terms of two display mode; dose difference and gamma evaluation. In this research the latter alone was used to monitor dose delivery error.
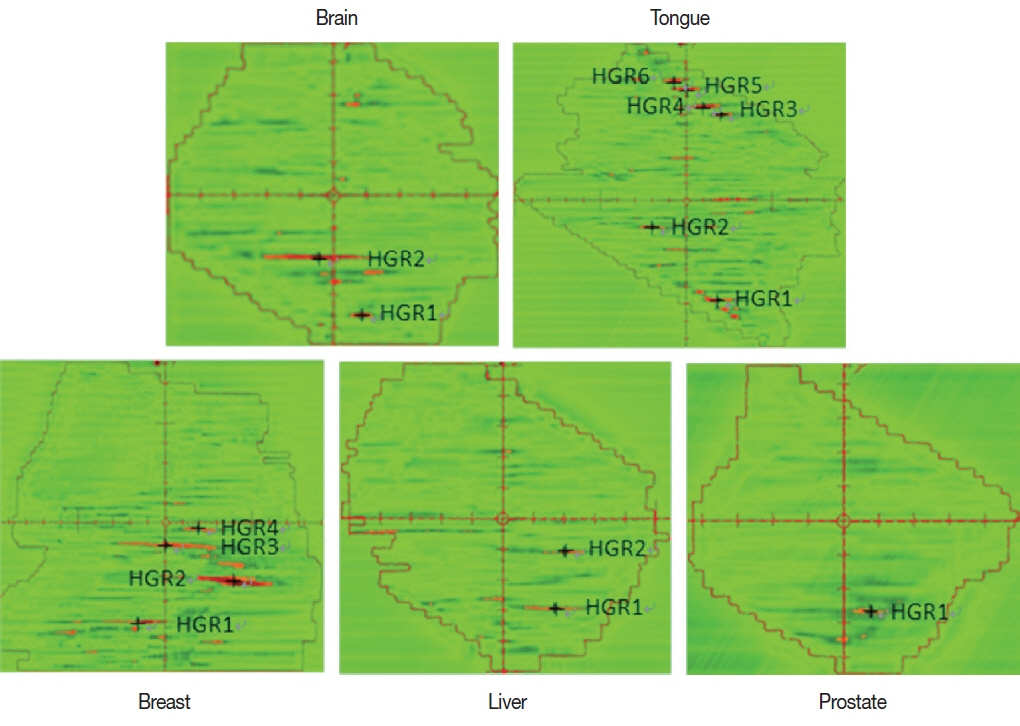
The image file of gamma index plot as evaluated with portal dosimetry was analyzed with the MATLAB program for numeric information to estimate the lengths of HGRs leading to determine representative HGR with the length of >1 cm and their centers. Figure 4 shows the findings for five selected plan cases, where HGRs red-colored in the picture were assigned as representative HGR when its length exceeded 1.0 cm and cross mark in representative HGR represents the center of the HGR length. The number of HGRs and representative HGRs varied from plan to plan. We didn’t deal with as lots of cases as needed and tested only five plan cases. It is therefore difficult to draw out some significant statistical correlation between the number of HGR and plan’s modulation level, but we guess carefully that the number of HGRs depend on modulation level because the liver and prostate cases studied in this research have lower modulation level than other cases.
Once representative HGRs were determined using MATLAB program, their centers were monitored over a treatment period in terms of first visual tracking and second displacement of center coordinates as shown in Figure 5. Figure 5A shows useful visual observation of daily HGR distribution, where only three days of data are shown for convenient display. For example, daily visual lengths may play a good role of simple and convenient visual check on daily variation of dosimetric error. From first day to last day all of five cases shows the similar visual pattern of HGRs, which might prove that the LINAC machine used deliver VMAT treatment stably over a full session of treatment even though it is not quantitative analysis but visual inspection. In addition to visual check we tried to give quantitative tracking of representative HGRs as shown in Figure 5B. It gives the comprehensive representation of daily one-dimensional distance (along X axis) among representative HGR centers. In this figure, zero represents the position, determined by mean of daily X coordinates of the HGR center. Centers of these longest HGRs remained within ±1 mm of that in first day. A few data looked scattered away from reference point, but a great part of centers of same HGR stayed within <1 mm of zero position. These findings can lead to good positional consistency of dose error regions, in other words, the excellent mid-term dosimetric performance of VMAT plans in the full period of treatment. We can keep confidence on this sub-millimeter order of position tracking because we used the MATLAB program instead of available tools in portal dosimetry module of Eclipse (Varian Medical Systems, Palo Alto, CA, USA) so that we can detect HGR centers in 0.01 mm accuracy.
Evaluation of daily positional consistency of dose error regions can play a significant role to determine midterm dosimetric consistency as well as mechanical stability of the used LINAC. We introduced positional tracking of dose error regions. This parameter may have some relation to beam modulation level and field shape complexity because a few positional hikes in our findings were observed in tongue and breast. We didn’t verify this because it was beyond the scope of this research and was left for future study. We, in this research, didn’t estimate the correlation between MLC movement error and dosimetric error, which was also left for future work. If the significant correlation could be verified, it would be very useful to find partly what causes the final dosimetric error of VMAT plan and develop more detailed analysis on mid-term performance of LINAC machine for VMAT treatment delivery. Distributions of gamma index and dose difference in portal dosimetry for VMAT plan QA seems to be different. There is no distinctly direct correlation between them because the absolute size of dose difference could be small even for the region with high gamma index. In other words, the region with high gamma index cannot be seen in the display mode of dose difference. In this study, we didn’t include this dose difference mode for the tracking of dosimetric error, but we think the new mode will be comparable to gamma index mode, and it will be meaningful to monitor daily variation of dosimetric error in terms of this mode, that is, the mid-term performance of LINAC machine for VMAT plan.
Conclusion
In this work, we tried to track the daily location changes of two parameters, leaf movement and dosimetric error, in VMAT therapy. The findings showed significantly effective to test the daily-based quality of VMAT treatment delivery.
As a matter of course, it is needless to say that it is not realistic in clinical practice to perform daily QA to all VMAT cases. Moreover, this type of daily-based QA has some bad points to create unexpected workload on QA practitioner. However, if proper surrogate of daily QA for real VMAT plan are devised, we think, it can be a good indicator of predicting the daily quality like stability and reproducibility of beam delivering in VMAT treatment.