Calculation of an Indicator for Early Death Using Atomic Bomb Survivors’ Data
Article information

Abstract
Background
A comprehensive, traceable, and easy-to-understand radiation risk indicator is desired for radiological protection. The early-onset hypothesis could be used for this purpose.
Materials and Methods
An indicator for early death (IED) was developed and calculated using the epidemiological dataset from the 14th Report of the Life Span Study (LSS) of Hiroshima and Nagasaki. By clarifying the calculation process, IED for all-cause mortality was estimated. In addition, the characteristics of IED for solid cancer mortality and cardiovascular mortality as well as those of men and women, and their dependence on age at exposure were investigated for detailed analysis.
Results and Discussion
The IED for all-cause mortality was estimated to be approximately 4 years for an acute radiation exposure of 1 Gy regardless of the fitting dose range. The cumulative death rate for all solid cancers also indicated the early-death tendency (approximately 7– 10 years at 1 Gy). Although, there is a slight difference in the characteristics of the risk obtained from the LSS study and this study, it is considered that the IED in a unit of years can also be used to show the overall picture of risk due to radiation exposure.
Conclusion
We developed and calculated the indicator for early death, IED, for the cumulative mortality rate of all causes of death, all solid cancers, and circulatory diseases. The quantitative values of IED were estimated to be 4 years for all causes of death, 7–10 years for all solid cancers. IED has an advantage for intuitively understanding the meaning of radiation risk since it can be obtained by a simple and traceable method.
Introduction
For risk inference [1] due to radiation exposure, cancer and hereditary risks are considered in the age- and sex-averaged lifetime risk using representative populations, which were evaluated as nominal risk coefficients (approximately 5%/Sv), and then radiation detriment by the International Commission on Radiological Protection (ICRP) [2]. Since the numerical values of radiation detriment for each tissue and organ were normalized and adopted in the tissue weighting factor, which were incorporated in the calculation of the effective dose, it is considered that such values play a role in underpinning the current system of radiological protection.
On the other hand, ICRP Task Group 84 pointed out that the nominal risk coefficients are difficult to understand and caused confusion in the communication after the Fukushima Daiichi Nuclear Power Plant accident [3]. In particular, in the communication after a nuclear accident, it is desirable to provide risk indicators for radiation exposure that are easy to understand, since members of the public may have to make difficult decisions based on the current situation.
Not only carcinogenesis but also the risk of cardiovascular and cerebrovascular diseases due to radiation exposure has been a focus of radiological protection [4]. Although the occurrence mechanism for such diseases under low-dose and low-dose-rate radiation exposure is not well understood, a risk indicator that can comprehensively treat all diseases may be useful for inclusively understanding and grasping the radiation risk.
The early-onset hypothesis has recently been reviewed by Nakamura [5], in which the magnitude of radiation risk was expressed as the number of years due to an earlier death using the survival curve from an animal experiment [6] and the epidemiological data from the 14th Report of the Life Span Study (LSS-14) of Hiroshima and Nagasaki [7]. Mean years of life lost after exposure at ages of 10, 30, and 50 years to 1 Gy were indicated for males and females [5]. Cologne and Preston [8] also calculated the radiation risk using the LSS data and estimated the loss of life expectancy to be 2.6 years per Gy. For early-onset estimation, Sakata et al. [9] showed the cumulative incidence of menopause considering the age of menarche, as well as the survival probabilities from age 35 years for Japanese men and women born between 1920 and 1945 who were never smokers or who had smoked continuously since before the age of 20 [10].
It is also considered that traceability is necessary and helpful when the risk values become crucial in a decision-making process [11, 12]. Although the expression of risk using the unit of time may be more familiar to members of the public than the nominal risk coefficients, the names of the units are slightly different among the previous studies [5, 8], and the details of their calculation procedures and the numerical data are unfortunately not available.
In this study, we considered the usefulness of the indicator for early death (IED) to be useful from the perspective of comprehensibility of radiation risk to support the understanding of radiation risk for members of the public. The available epidemiological data from LSS-14 was used in this study, and the IED was evaluated by a simple and traceable method.
Materials and Methods
1. Epidemiological Data
The stratified dataset of LSS-14 is available via the webpage of the Radiation Effects Research Foundation (RERF) by application. The dataset is a detailed tabulation of person-years, deaths, and summary data constructed from data on individual survivors [7]. These are divided into the number of following person-years and the number of deaths (by cause of death) for each of the categorical variables of age at exposure, attained age, organ dose, endpoint group, and so forth. As Ozasa et al. [7] mentioned in the report, among the 86,611 people included in the data, 50,620 had died and 42% were alive as of January 1, 2004. Tables 1 and 2 show the number of subjects by the age at exposure category and the number of deaths (all causes) by the attained-age category for each dose category. The dose category was assigned by the weighted colon dose [13], which is the sum of the absorbed dose due to gamma rays and that due to neutrons multiplied by 10 to consider the relatively large biological effect [13].

Number of Subjects by Age at Exposure Category for Each Dose Category

Number of Deaths (All Causes) by Attained–Age Category for Each Dose Category
2. Calculation of the IED
The IED, in a unit of years, indicates the degree to which death is accelerated by acute radiation exposure. Loss of life expectancy has the same unit, and is sometimes used to express the radiation risk [14]. Statistical data, such as total death rate and background leukemia and non-leukemia death rates that vary depending on the territory and the era, are necessary for calculating life expectancy, whereas IED can only be estimated using the dataset of LSS-14.
In the previous LSS findings, radiation risk estimates have been expressed as functions of age at exposure, attained age, and sex. In this study, however, for simplicity, we attempted to calculate the cumulative all-cause mortality rate for each exposure dose as a function of attained age alone, without adjusting for age at exposure. To obtain the quantitative value of the IED, the logistic regression curve given by Equation (1) was adopted for the cumulative all-cause mortality rate.
where, y is the cumulative mortality rate of all causes of death, x is the variable of the attained-age category, and a, b, and c are fitting parameters. Firstly, regression was conducted for dose category No. 1 (0–0.005 Gy group) as the reference case. Then, regression was performed for the other dose categories while fixing a and c, which were obtained from the reference case (a=aref, c=cref). The difference in x between the reference case and the interest dose category, i.e., x–xref, can be obtained using Equation (2), which can be regarded as the IED after multiplying by five to account for the width of the attained-age category.
3. Different Endpoints and Additional Detailed Analysis
Although deaths from external causes are scientifically considered irrelevant from the standpoint of radiation risk, they are included because of their small proportion to the total number of deaths (2,432/50,620=4.8%). All-cause mortality alone is sufficient for the ultimate purpose of this study, which is to provide a comprehensive picture of radiation risk. However, for detailed analysis and examination, we calculated and analyzed the characteristics of solid cancer mortality and cardiovascular disease mortality as well as those of men and women, and their dependence on age at exposure. All calculations were performed using the nonlinear least-squares (NLS) function in the R package (http://www.R-project.org).
Results and Discussion
1. Cumulative Death Rate and Fitting for Reference Case and Other Dose Categories
Table 3 shows examples of the cumulative number of deaths and the cumulative death rate for all causes of death as a function of attained age for the reference case (dose category No. 1) and dose category No. 17. By the simple fitting using Equation (1), we obtained the parameter values for the reference case were obtained (aref=0.625, bref=3,590.1, and cref=0.537), which are also shown in Table 3. Fig. 1 shows the cumulative death rates with fitting curves for the reference case and dose category No. 17 as an example. The meaning of the IED is also indicated by blue arrows.
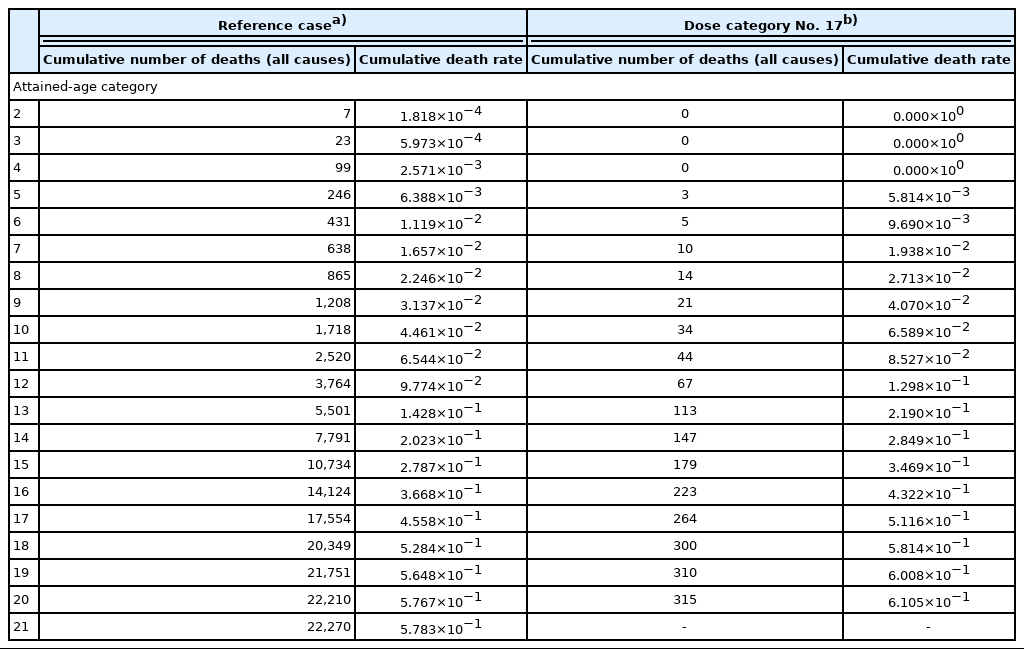
Examples of Cumulative Number of Deaths (All Causes) and Cumulative Death Rate by Attained-age Category for Reference Case and Dose Category No. 17
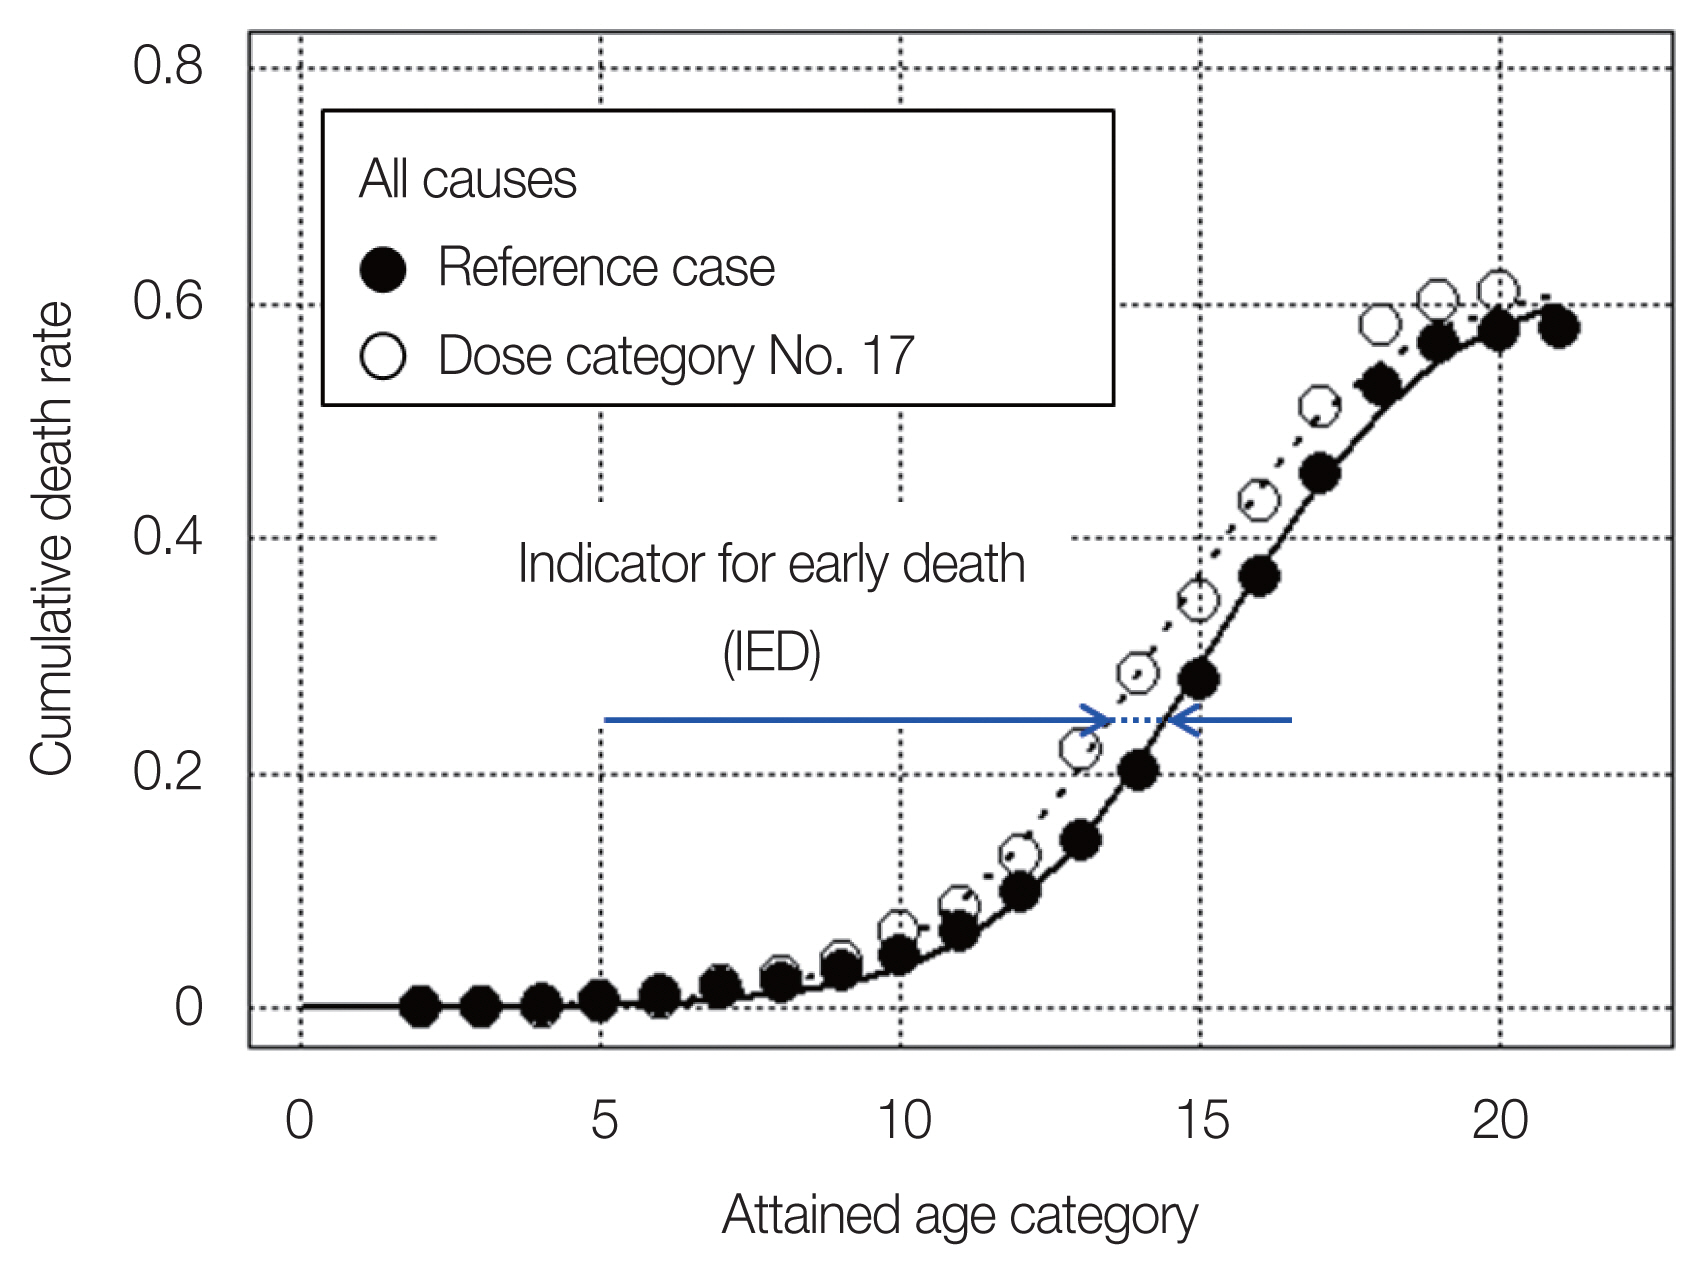
Cumulative death rates (all causes) with fitting curves for the reference case and dose category No. 17 (1.25–1.5 Gy).
The cumulative death rates were then calculated for the other dose categories and fitted using Equation (1) whereas a and c were fixed as mentioned above. As shown in Tables 1 and 2, since the number of subjects was very small for dose category No. 22, it was omitted in the following analysis. Table 3 also includes the value of b and the resultant IED, respectively, obtained using Equations (2) and (3) for dose category No. 17 (1.25–1.5 Gy) as an example.
Fig. 2 shows the IED in the unit of years as a function of weighted colon dose (Gy). The x-axis value is the arithmetic mean weighted colon dose for each dose category range (see Tables 1 and 2). Although the calculation is simple, the resultant shape of the dose–response curve and its tendency are quite similar to those of the dose–response curve of excess relative risk for all solid cancers in LSS-14 [7].

Indicator for early death (IED) in the unit of years as a function of weighted colon dose. The solid line indicates the result of fitting in the full dose range, while the broken line indicates that in the limited dose range of less than 1.5 Gy.
In Fig. 2, the straight lines shown together in the graph indicate the result by simple linear regression with y-axis is IED and x-axis is weighted colon dose, which intersects at the origin. The solid line indicates the result of fitting in the full dose range, while the broken line indicates that in the limited dose range of less than 1.5 Gy. As shown in the figure, the IED estimated to be approximately 4 years for an acute radiation exposure of 1 Gy regardless of the fitting dose range.
2. Cumulative Death Rates for All Solid Cancers and Circulatory Diseases
The same analysis procedure was also separately conducted for deaths due to all solid cancers and circulatory diseases. The cumulative death rate for all solid cancers also indicated the early-death tendency (approximately 7–10 years at 1 Gy); however, that for circulatory diseases did not clearly show such tendency as shown in Fig. 3A. As before, the solid line indicates the result of simple linear regression with y-axis is IED and x-axis is weighted colon dose, in the full dose range, while the broken line indicates that in the limited dose range of less than 1.5 Gy. For circulatory diseases, the slope of the simple linear regression was estimated to be 0.2 years at 1 Gy in the full dose range, while it was estimated to be −0.8 years at 1 Gy in the limited dose range of less than 1.5 Gy.

(A) Indicator for early death (IED) of deaths due to all solid cancers and circulatory diseases as a function of weighted colon dose, (B) cumulative death rate (all solid cancers) with fitting curves for the reference case (solid line) and dose category No. 18 (broken line), and (C) cumulative death rate (circulatory diseases) with fitting curves for the reference case (solid line) and dose category No. 19 (broken line). In (A), the solid line indicates the result of fitting in the full dose range, while the broken line indicates that in the limited dose range of less than 1.5 Gy.
In addition, especially for the cumulative death rate for all solid cancers, it is likely inappropriate to perform the fitting that only considers the early-death tendency. As an example, Fig. 3B shows the cumulative death rate for all solid cancers for dose category No. 18 (1.5–1.75 Gy) with the reference case. This fitting produces large values for the residual sum of squares. The earlier occurrence of death in cases where death was originally destined to occur in old age for reasons other than cancer may be interpreted as an acceleration of cancer progression.
Fig. 3C shows the cumulative death rate for circulatory diseases for dose category No. 19 (1.75–2.0 Gy) with the reference case. On the contrary, the fittings produce small values for the residual sum of squares through all dose categories, however, negative IED values were observed even in the high dose range as shown in Fig. 3A and 3C. This may be due to the fact that the IED is a simple indicator of radiation risk, and shows the extent of acceleration of cumulative death rate, whereas excess relative risk (ERR) or excess absolute risk (EAR) indicates death rate for a limited duration obtained by using person-years data.
3. Dependences of Cumulative Death Rate on Age at Exposure and Sex
After separating the original data, the dependences of IED on age at exposure and sex were also investigated. Fig. 4 shows the IED at 1 Gy by sex for ages at exposures of 10 (0–19 years old), 30 (19–39 years old), and 50 (40–59 years old) for all causes, all solid cancers, and circulatory diseases, which are the slope of the data by simple linear regression analysis with y-axis is IED and x-axis is weighted colon dose, (full dose range) as before.
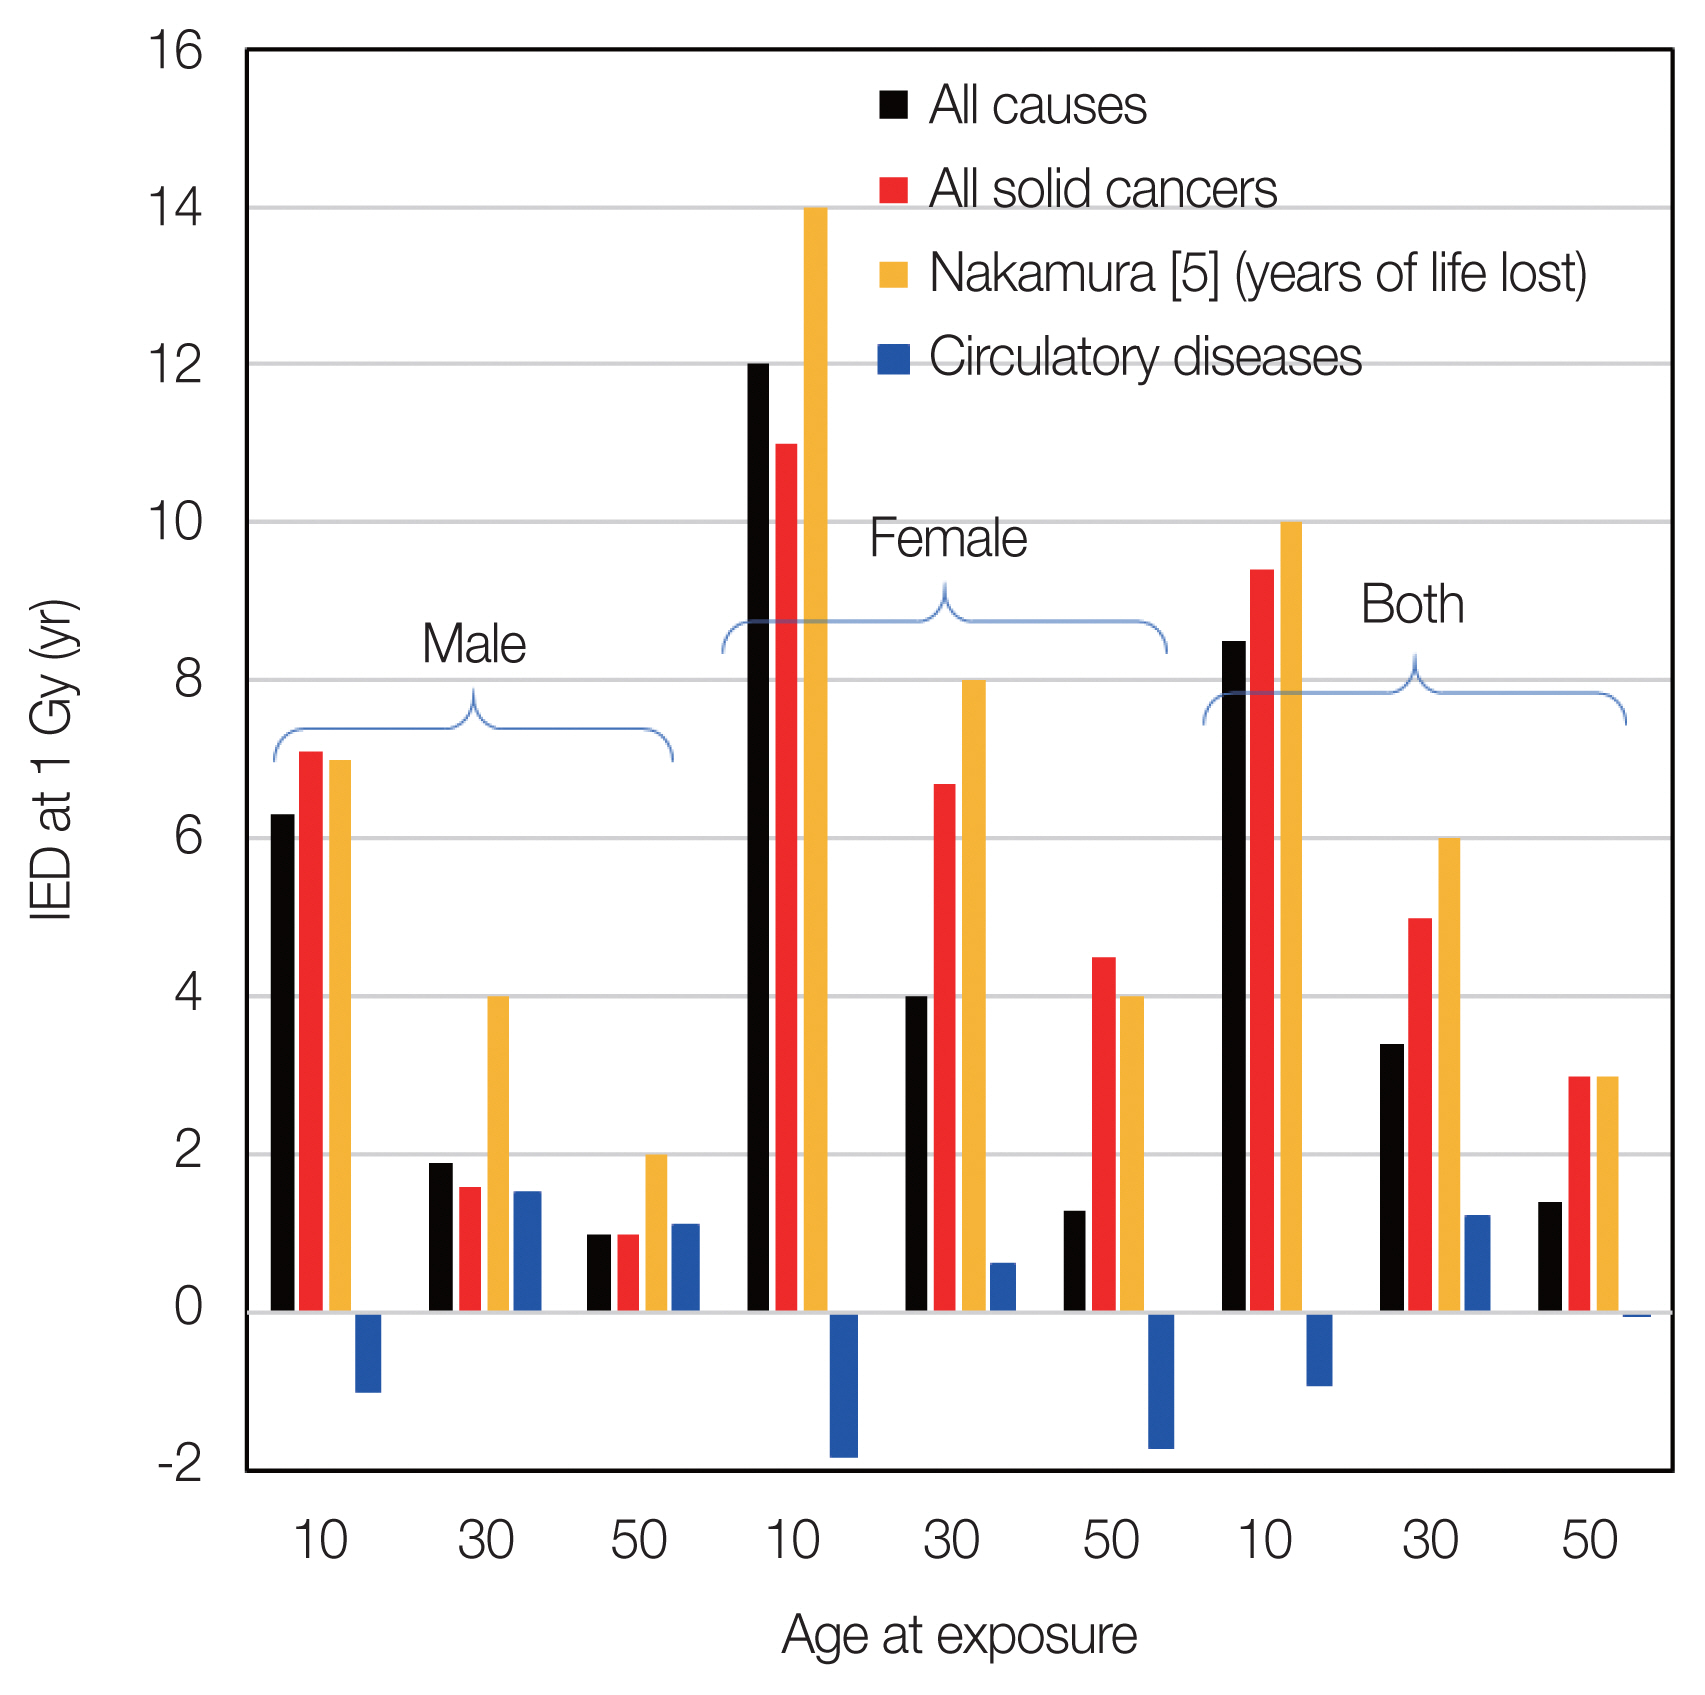
Indicator for early death (IED) at 1 Gy by sex and by ages at exposures of 10, 30, and 50 years for all causes, all solid cancers, and circulatory diseases, which are the slope of the data by simple liner regression analysis with y-axis is IED and x-axis is weighted colon dose (full dose range).
Nakamura reported the years of life lost due to solid cancers after exposure to 1 Gy. Their values are also shown in Fig. 4. The absolute values are comparable and have the same tendency, i.e., risks for females are higher than those for males, and risks for exposure at younger ages are higher than those for elderly people. On the other hand, for circulatory diseases, no clear tendency was observed in terms of age at exposure, which is also similar to the characteristics of ERR for circulatory disease mortality [15].
4. Comparison with Risk Estimates from LSS Data
The IED for the cumulative death rate for all causes was roughly estimated to be 4 years for exposure to 1 Gy. For each endpoint, IED showed an accelerated trend for solid cancers, while clear early-death tendency was not found for circulatory diseases (Fig. 3A). However, note that our results are “simple estimates” without using the person-years data or making adjustment for age at exposure. Table 4 shows the number of subjects, the proportion of subjects over 45 years of age, and mortality rate for circulatory disease for each dose category of No. 1 (reference case), 18, 19, and 20 as an example. As shown in Table 4, the number of subjects in the higher dose range is much lower than that for the reference case and thus the death rate of circulatory disease. The proportion of subjects over 45 years of age is different, especially in the higher dose categories as shown in Table 4. In addition, ERR and EAR usually deal with the risk per unit time, while the present results show the cumulative number of deaths. This discrepancy in the age structure of each dose category and difference in the risk calculation method may affect the trend in cumulative mortality and produce the negative IED values in the higher dose range; therefore, we do not claim that there is no clear risk of circulatory diseases in acute exposure. The presence or absence of such a risk due to acute radiation exposure should be estimated by a detailed analysis of the LSS data [7, 15].

Examples of Number of Subjects, the Proportion of Subjects over 45 Years of Age, and Mortality Rate for Circulatory Disease for Each Dose Category of No. 1 (Reference Case), 18, 19, and 20
The interpretation of the trend of increased cumulative death rate of all solid cancers is controversial. Such a trend may be interpreted as an acceleration of cancer progression and the earlier occurrence of death in cases where death was originally destined to occur in old age for reasons other than cancer. In comparison with the findings of the LSS, the difference in the cumulative death rate from all causes is not significant at around 100 mGy. Since this is a simple estimate of the cumulative proportion of all causes of deaths, it may not be appropriate to directly link conclusions about the presence or absence of a risk to the dose based on scientific understanding. However, the crude risks at 1 Gy obtained from the LSS data [7, 15], in which the city, sex, age at exposure, and attained age were included in the background rates, for all causes of death (0.22) and all solid cancers (0.47) are comparable to those obtained as the IED of death (4 years for all causes and 7–10 years for all solid cancers) in this study. Thus, it is considered that the IED in the unit of years can also be used to show the overall picture of risk due to radiation exposure.
5. Limitation and Advantages of IED
Uncertainty can arise in ordinary risk prediction due to the use of statistical and other data and parameters, such as a weighting of the ERR and EAR in the detriment calculation [2]. However, since the IED is not a precise lifetime risk calculation, its calculation does not require statistical data such as baseline mortality. Since its calculation requires only data on Atomic bomb survivors as described above, it is more appropriate to call it a risk estimation rather than a risk prediction [1].
The IED is highly reproducible, traceable, and can be used as one of the simplest and most understandable indicators of radiation risk. However, since it uses only data on acute exposure and high doses from atomic bomb exposure, it is not directly applicable to low-dose and low-dose-rate radiation exposure, which is the main target of radiological protection. In this study, since negative IED values were obtained for mortality from cardiovascular diseases, caution should be exercised in applying IED calculations to mortalities other than for all-cause mortality. Also, since it is a mortality-only measure, nonfatal risks are not assessed. Further study will be needed to determine which diseases should be included in the radiation risk assessment.
In addition, as there suggested already various indices—detriment, lifetime attributable risk (LAR), excess lifetime risk (ELR), and risk of exposure-induced death (REID) [2, 16, 17] —have already been suggested for lifetime risk prediction due to radiation exposure, it may be difficult for such a new risk indicator to be accepted widely. However, for these radiation risks, cancer and hereditary effects are usually considered, whereas for the IED, all diseases can be considered in a simple manner. In addition, its high reproducibility and traceability will be valuable advantages in risk communication when various stakeholders participate in decision-making.
Regarding the inclusiveness on the quantification of radiation risk, simple addition of IED values for different endpoints does not provide the inclusive IED value of radiation risk, since the IED for all causes was estimated to be approximately 4 years at 1 Gy while that for solid cancers was estimated to be 7–10 years at 1 Gy, as demonstrated above. It should be recognized that the total lifetime death probability for a human cannot exceed one and the competition of cause of death should be appropriately considered for quantification of radiation risk inclusively. This may be noticeable in the elderly age; however, this has actually been arisen throughout the life. The future challenge will be to analyze the IED for individual causes of death, for example, cancer by subtype, and to evaluate the inclusive IED as a lifetime risk with appropriate adjustments for each IED.
Conclusion
We calculated the IED for the cumulative mortality rate of all causes of death, all solid cancer, and circulatory diseases using the epidemiological dataset from the LSS-14. The quantitative values of IED were estimated to be 4 years at 1 Gy for all causes of death, 7–10 years at 1 Gy for all solid cancers. It was also found that overall characteristics of IED was comparable with the risk estimates from LSS data by Ozasa et al. [7] and Shimizu et al. [16]. IED has an advantage for intuitively understanding the meaning of radiation risk since it can be obtained by a simple and traceable method, considering all disease risks.
Acknowledgements
This report makes use of data obtained from the Radiation Effects Research Foundation (RERF), Hiroshima and Nagasaki, Japan. RERF is a private, non-profit foundation funded by the Japanese Ministry of Health, Labour and Welfare (MHLW) and the US Department of Energy (DOE), the latter in part through DOE Award DE-HS0000031 to the National Academy of Sciences. The conclusions in this report are those of the authors and do not necessarily reflect the scientific judgment of RERF or its funding agencies. We would like to express our sincere appreciation to Dr. Nori Nakamura and Dr. Ritsu Sakata for their helpful suggestions.
Notes
Conflict of Interest
No potential conflict of interest relevant to this article was reported.
Author Contribution
Conceptualization: Sasaki M, Fujimichi Y, Yoshida K, Iwasaki T. Investigation and methodology: Sasaki M, Fujimichi Y. Project administration: Iwasaki T. Supervision: Yoshida K. Writing of the original draft: Sasaki M. Writing of the review and editing: Fujimichi Y, Yoshida K, Iwasaki T. Formal Analysis: Sasaki M.