

Introduction
In the past two decades, frameworks have been developed for radiation protection, including radiological impact assessments for non-human biota. To consider the radiological impacts on non-human biota, estimation of the absorbed dose is an important issue. The International Commission on Radiological Protection (ICRP) proposed dose estimation methods for non-human biota in the context of radiological protection [1, 2]. These methods have been applied in the assessment of radiological consequences after large nuclear disasters such as the Fukushima Daiichi Nuclear Power Plant (FDNPP) accident [3, 4]. The ICRP dose estimation method is based on the following simplified assumptions: the body shape of organisms is represented by an ellipsoid and radionuclides are uniformly distributed throughout the body. The entire body is also considered the target for absorbed doses owing to radionuclides within the body. These doses are specifically calculated based on dose coefficients (DCs), which are defined as the ratio of the dose rate to the average activity concentration of radionuclides in the entire body.
The ICRP approach is useful for assessing general radiological impacts on biota; however, as the assumptions are simplified, they are not always suitable for determining specific radiological effects observed in wild organisms in field investigations [5–7]. Our previous field investigation of wild fir trees showed morphological defects in newly grown shoots in areas with a high proximity to FDNPP [8]. The morphological changes appeared restricted to the shoot tips as a loss in new shoot formation, which indicates a defect in the meristem in the terminal buds that could have differentiated into new shoots. Therefore, a specific dose estimation is needed, focusing on the terminal buds, to consider the involvement of radiation in the observed morphological changes in fir trees.
Terminal buds covered with bud scales are located at the tips of shoots. Shoots are intricately composed of plant organs, including trunks, branches, and leaves of different ages. Among plant organs, radionuclides were not always distributed uniformly subsequent to the FDNPP accident [9, 10]. In the early phase after the accident, radionuclides were discharged into the atmosphere and deposited on trees; thus, radionuclides contaminated the surface of bud scales, trunks, branches, and leaves, but not directly buds. However, in the later phase, when the atmospheric release of nuclear materials ceased, radionuclides were no longer deposited directly on tree surfaces, but contaminated the organs in newly grown shoots via translocation within the tree.
The purpose of the present study was to develop a method for estimating the radiation dose to the terminal buds of fir trees in contaminated forests, based on the measurement of radionuclide distribution among plant organs. A phantom composed of three-dimensional (3D) plant organs was constructed for the upper three whorls, among which the target organ (terminal bud) was evaluated using Monte Carlo simulations of the absorbed dose rate from radionuclides in each source organ. The evaluation of the absorbed dose focused on three radionuclides, 131I, 134Cs, and 137Cs, because these were the principal radionuclides contaminating the terrestrial environment after the FDNPP accident. The dose contribution from each source organ was calculated separately using DCs, expressing the ratio between the average activity concentration of a radionuclide in each source organ and the dose rate to the target organ (μGy/day per Bq/kg).
Materials and Methods
1. Tree structural model
A structural model of fir trees was constructed based on previous observations of naturally growing trees in the Fukushima Prefecture, Japan [8]. The representative structure of Japanese fir trees is shown in Fig. 1, and the tree organ sizes are shown in Table 1. Based on the representative tree structure, a model consisting of computerized phantoms was constructed from the terminal bud to the third whorl in the main stem of the fir tree. The buds, composed of one terminal bud and two lateral buds, were located at the top of the main trunk. The lateral buds were positioned at an angle of 60° from the vertical terminal bud. Each bud was simulated using spheroids of ϕ2×1.5 mm, which were covered with a bud scale. The bud scales were spheroids of ϕ6×4 mm and 1 mm in thickness. The main trunk was divided by nodes into three parts: 1-, 2-, and 3-year-old trunks, each of which was simulated using a column, 0.6 cm in diameter and 10 cm in length. Each year, the trunk has 60 leaves arranged spirally and at even distances apart, excluding 1 cm from the basal node. Each leaf was simulated using a cuboid of 30 mm×3 mm× 0.3 mm, extended horizontally with the leaf facing upwards. Two lateral branches were generated from each node on the main trunk and were elongated at an angle of 60° from the trunk. The lateral branches from each node on the main trunk were rotated at 60° angles to prevent horizontal overlapping of the branches. The lateral branches further generated three branches yearly at the nodes that extended flat at angles of 60° relative to each other. The 1-, 2-, and 3-year-old branches were simulated using columns, 0.6 cm in diameter and 10 cm in length. Each year, the branch had 60 leaves arranged parallel to both sides of the branch, which was simulated by integrating two cuboids of 9 cm×3 cm×0.03 cm (W×D×H) flat on both sides of the branch. The shapes and densities of the tree organs are presented in Table 2. The compositions and raw densities of elements in the organs were determined from data on the basic elemental composition of wood [11] and the air-dried density of common wood species [12] (Table 3).
2. Model dosimetry with Monte Carlo simulation
Based on the tree structural model, absorbed doses from radiological sources were evaluated in a target organ of the tree using an analog Monte Carlo code EGS5, without using variance reduction techniques [13]. The geometries were mathematically modeled in user codes for the tree organs, and the target organ was determined to be the terminal bud (spheroids of ϕ2×1.5 mm; Fig. 1). Radiological sources were considered separately for eight tree organs: buds, bud scales, 1 year-trunk/branches, 1 year-leaves, 2 year-trunk/branches, 2 year-leaves, 3 year-trunk/branches, and 3 year-leaves, in which a single radionuclide species was uniformly distributed or localized on the surface (Table 2).
The radionuclides considered were 134Cs, 137Cs, and 131I, which are all beta- and gamma-ray emitters, owing to our interest in the effects of nuclear accidents. The yields of beta and gamma radiation emitted during nuclear decay of the radionuclides are provided in ICRP Publication 107. Photons and electrons are generated separately, either from the entire tree organ or its surface [14]. The decay data in ICRP Publication 107 were also used for the energies of the photons and electrons, whose full spectra were simulated by assigning the electron energy to the probability density of the spectra. One hundred million to two billion histories of photons or electrons were run to reduce statistical uncertainties to less than 5% for dose calculations; however, uncertainties less than 10% were accepted for data comparisons to indicate negligible data. Analog energy deposition events were scored in the target organ, the bud, with cutoff energies set to 10 keV for both photons and electrons. The deposited energy was multiplied by the weight of the entire source organ to calculate the DC per activity concentration (1 Bq/kg) for radionuclides uniformly distributed in the organ, as well as those localized on the organ surface.
3. Comparison with ICRP Dosimetry Models
The dosimetry models were compared with the ICRP models to calculate the internal exposure. The DC was calculated following ICRP Publication 136 [2] for internal exposure of the bud using an online DC calculator (http://biotadc.icrp.org). The specific model of the bud was determined to have the same shape (mass of 0.00236 g; body proportions of 1× 0.75×0.75) as the bud in our tree structural model. In addition, different plant models of the reference pine tree and grass were cited for comparison with ICRP Publication 136 [2].
4. Test Calculations using Field Data for Comparison with the ICRP Model
Model calculations of the dose rate of radiation exposure from inside fir trees were tested using radionuclide activity concentration estimates in pine vegetation from the Fukushima report published by the International Atomic Energy Agency (IAEA) [3]. The IAEA has partly described the calculation formula from field deposition data in a highly contaminated area in the process of dose estimation for pine trees. The radionuclide activity concentrations in the vegetation were reproduced by assuming direct interception of the vegetation at 0, 30, and 90 days and transfer from the soil 1 year after the accident. Using the radionuclide activity concentration values, the absorbed dose rates of the tree were calculated using either our model or the ICRP calculation model [2]. In the calculation, our model assumed surface contamination of trees at 0, 30, and 90 days after the accident or homogeneous contamination 1 year after the accident, whereas the ICRP calculation model always assumed homogeneous contamination. The absorbed dose rates calculated using the ICRP calculation model were identical to the corresponding values obtained from a graph in the IAEA Fukushima report [3].
Results and Discussion
1. Dose Rate Contribution of Tree Structures
A structural model of a fir tree was analyzed for absorbed doses using the Monte Carlo code EGS5. Gamma emissions from every tree organ homogeneously contaminated with 137Cs were simulated in the target organ of the terminal bud. Because the region of the target organ was small (spheroids of ϕ2×1.5 mm) compared to the distance from the source trunk/branches and leaves (Fig. 1, Table 2), the resulting photon fluxes into the target organ were rare. This suggests a low efficiency of gamma-ray contribution to the absorbed dose rate in the target organ. The contributions of beta and gamma rays to the absorbed dose rate in the target organ were compared separately among the source tree organs by calculating DCs (μGy/day per Bq/kg), which indicate the dose rate in the target organ from each source tree organ with an activity concentration of 1 Bq/kg (Fig. 2). The DC values were highest for the two tree organs nearest to the target organ, which included the buds and bud scales, where beta rays were more dominant than gamma rays. In contrast, gamma rays were more dominant than beta rays in the 1 year-trunk/branches and 1 year-leaves. In the other four tree organs, the DC values were negligible for both gamma and beta rays because of their long distance from the target organ.
Assuming homogenous contamination of the whole tree with the activity concentration of 1 Bq/kg for 137Cs, the total dose rate in the target organ was calculated as the sum of the significant DC values for all tree organs. The percentage of the DC contribution of each source tree organ to the total dose rate is shown in Table 4. Among the tree organs, three organs (buds, bud scale, and 1 year-trunk/branches) accounted for more than 99% of the absorbed dose rate of the target organ. Beta rays from the buds (54.6%), bud scale (30.9%), and 1 year-trunk/branches (5.5%), and gamma rays from the 1 year-trunk/branches (6.9%) mainly contributed to the dose rate. However, older trunks/branches and leaves, which were located farther from the target organ, did not significantly contribute to the dose rate of the target organ. Overall, these results show that the significant contributors to the dose rate of the target organ are beta rays from the bud, bud scales, and 1 year-trunk/branches, and gamma rays from bud scales and 1 year-trunk/branches.
2. Comparison of DC Values for Internal Exposure with ICRP Models
Among the tree organs, the dose contribution of the bud was characterized as self-exposure due to internal exposure. Therefore, the DC of the bud in the fir tree model was compared with the DC values of internal exposure in the ICRP dosimetry models (Table 5). Compared to the reference pine and grass in ICRP Publication 136, the DC value in the bud was smaller, depending on the size of the spheroid geometry. The smaller geometries tended to have lower DC values. In fact, an organism with the same geometry as the bud, created according to ICRP Publication 136, showed a DC value closer to that of the bud in the fir tree model.
3. Factors of Variation in Dose Rate Calculation
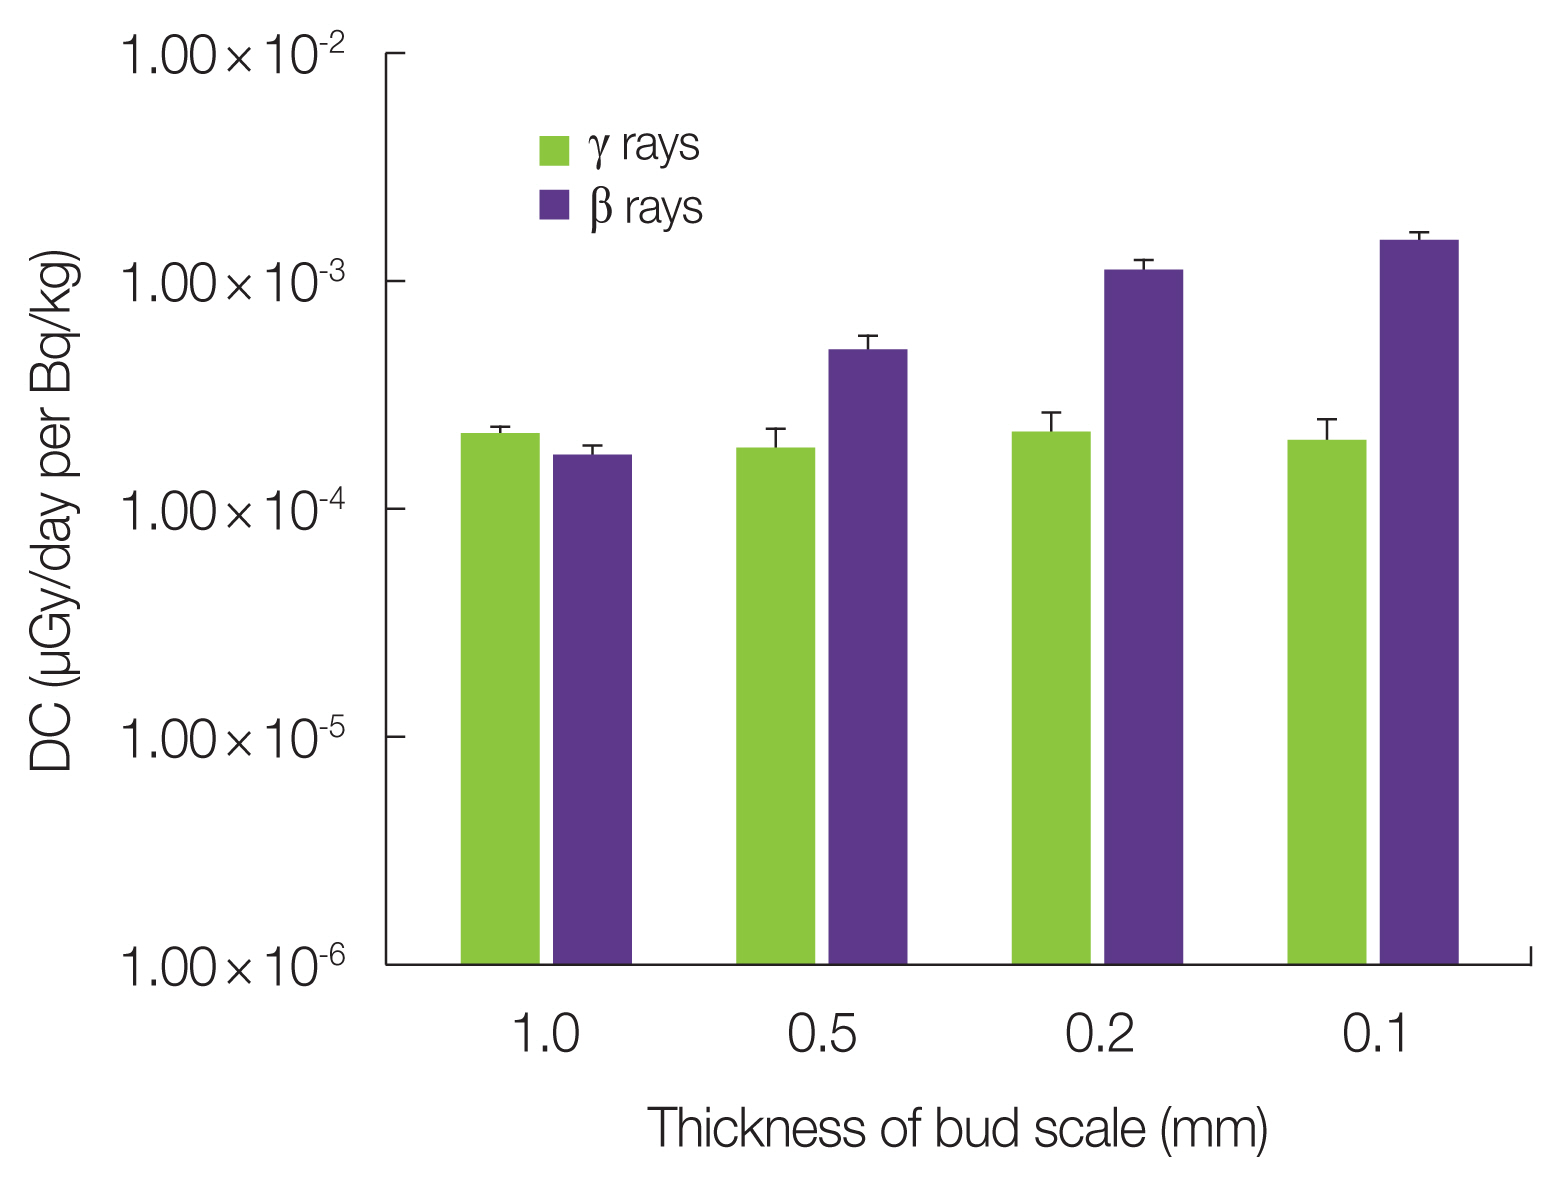
The dose contributions of organs other than the bud corresponded to the external exposure situations of the bud in the fir tree model. The dose rate contributions of such organs are likely to vary based on the structures surrounding the target organ. As buds are covered with bud scales, the thickness of the bud scale is likely to be a factor contributing to the variation in radiation dose in the target organ. To examine this effect, the DC was calculated for several bud scale thickness values varying from the standard values of 1 mm to 0.1 mm (Fig. 3). In the 1 year-trunk/branches, the DC for beta rays increased as the thickness decreased, whereas the DC for gamma rays remained almost constant. This shows that beta rays from adjacent plant organs are effectively attenuated by the bud scale before reaching the target organ. Actual bud scales are nearly 1 mm thick; therefore, it is appropriate to use the low or negligible DC values for beta rays from the 1 year-trunk/branches or leaves.
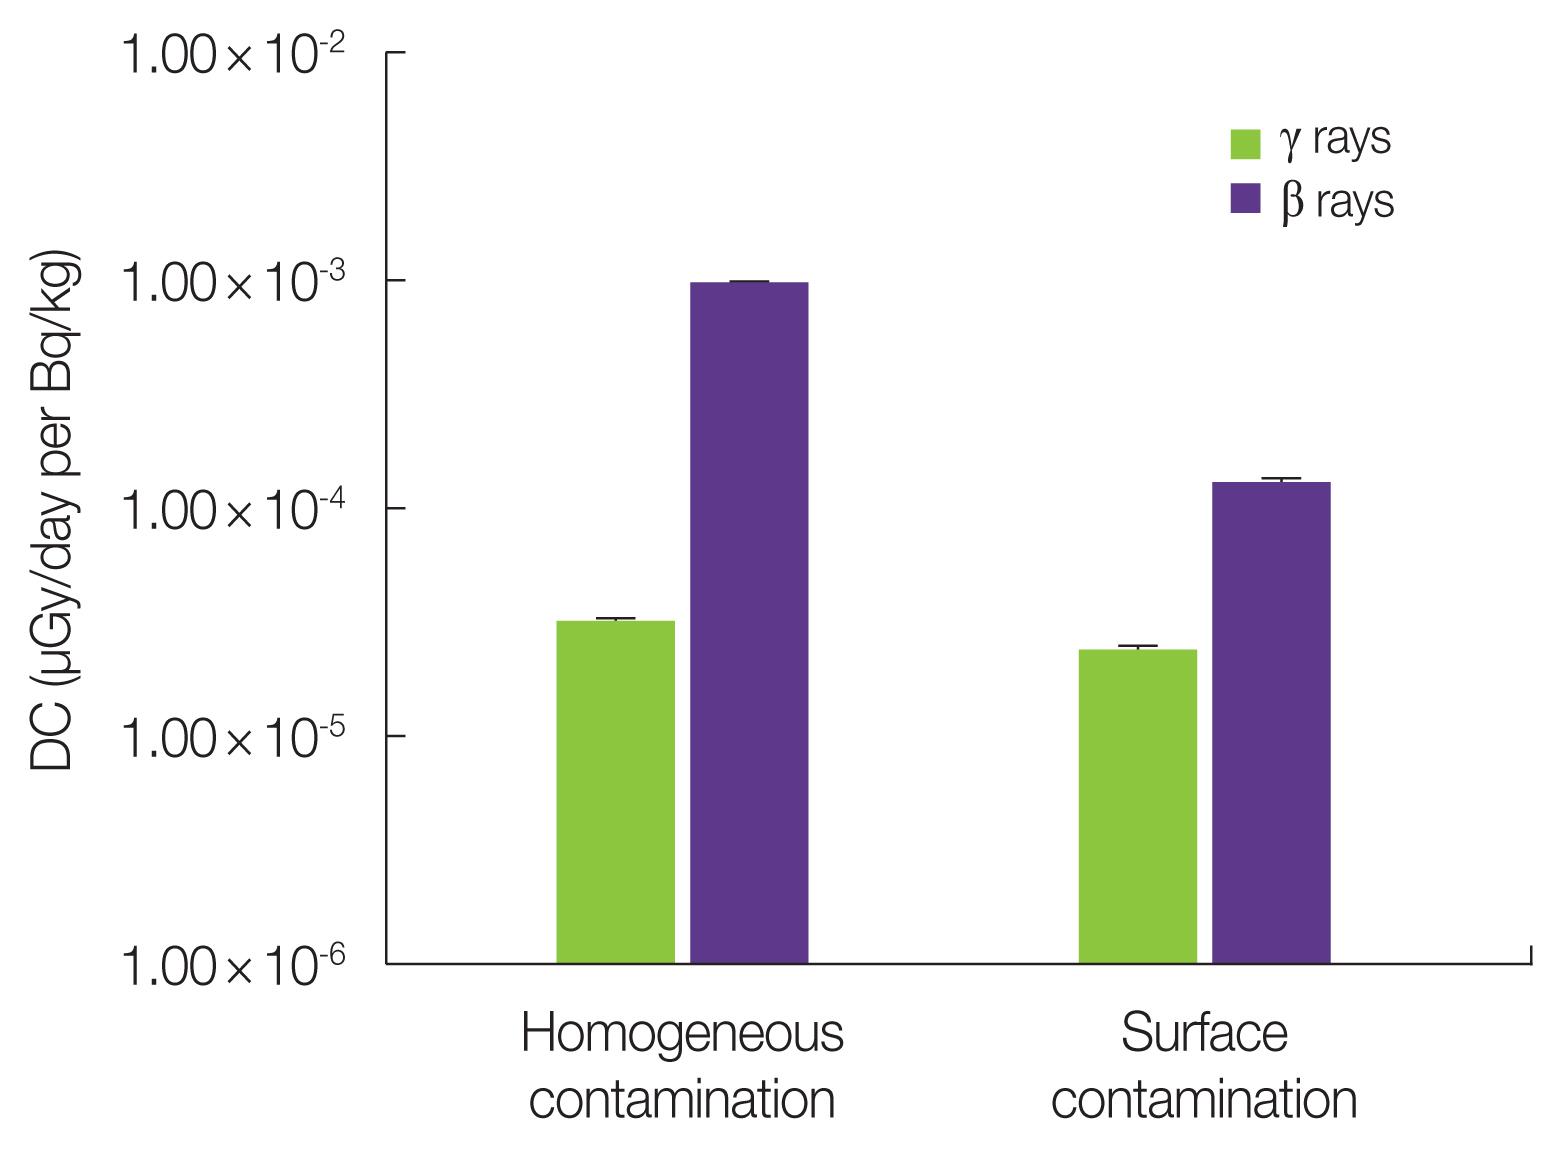
The DC calculation also varies owing to the inhomogeneous contamination of the source tree organs, which can occur by the direct deposition of radionuclides on the surface of plant parts. In particular, in the bud scale covering the bud, the difference in DC was investigated between the homogeneous and surface distributions of 137Cs. To compare the effect of the localization of the same amount of 137Cs on the bud scale, both DCs were calculated per activity concentration (1 Bq/kg) of the entire bud scale (Fig. 4). The DC was approximately 7-fold lower for beta rays after surface contamination compared with homogeneous contamination, whereas it was only 24% lower for gamma rays. This indicates that beta rays from the surface of the bud scale are also attenuated by the inner layer of the bud scale before reaching the target organ.
4. DC Values of the Fir Tree Model
The dosimetry model of fir trees was applied to calculate the DC values of beta and gamma rays from 134Cs, 137Cs, and 131I in the dose-contributing tree organs: bud, bud scale, and 1 year-trunk/branches (Table 6). The DC values were determined for two different contamination situations: inner contamination by the transfer of radionuclides and surface contamination by acute deposition of radionuclides. The inner contamination situation included DC for homogeneous contamination of every organ, whereas the surface contamination situation included DC for surface contamination of the bud scale, but excluded DC for contamination of the bud, which is free from the direct deposition of radionuclides owing to the surrounding bud scales. The surface contamination situation also included a contribution from 1 year-trunk/branches, whose DCs were substituted with the same values as those of the inner contamination situation. The DC values enabled us to estimate the dose rate in the terminal bud owing to the radionuclides in each tree organ by multiplying the corresponding DC by the measurement of radionuclide concentrations in the tree organ.
5. Test Application of DC of the Fir Tree Model to Dose Rate Estimation from Field Data
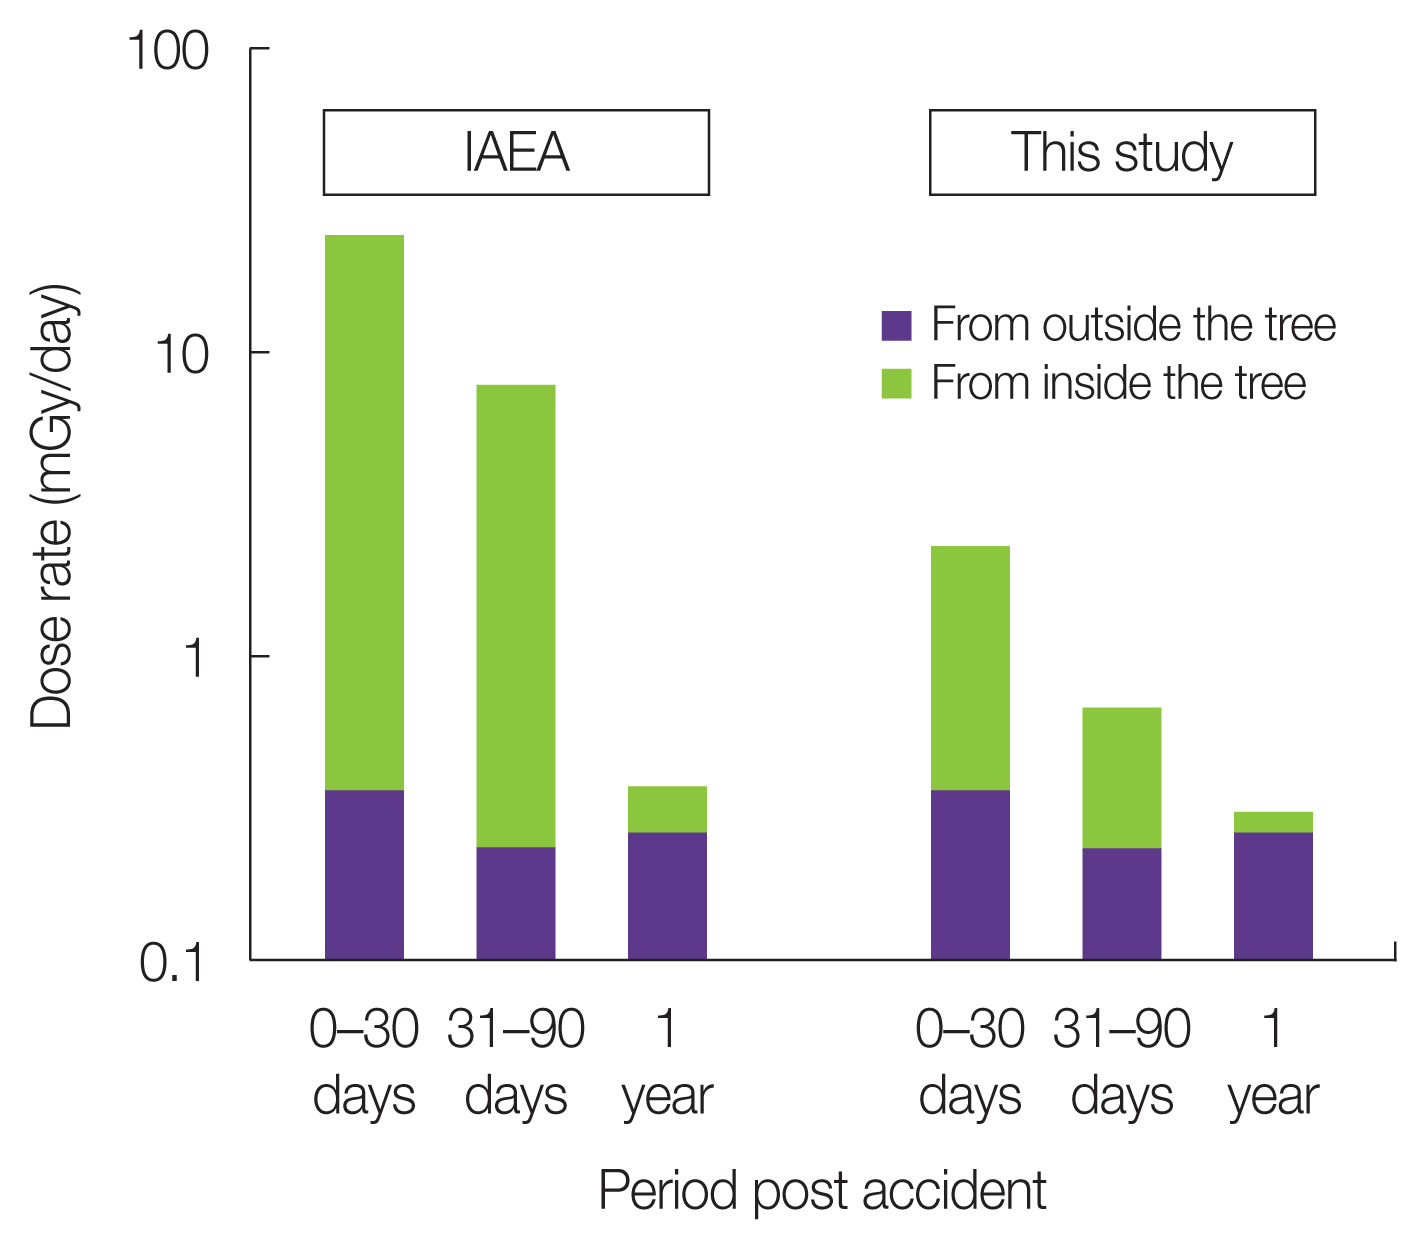
The DC values of the fir tree model were applied to the field data in an IAEA report collected after the FDNPP accident [3]. The IAEA calculated the dose rate of the reference pine tree from field data in a highly contaminated area after the FDNPP accident using the DC values provided by the ICRP for radiation exposure from both inside and outside the tree [3]. When the exposure from the inside of the tree was calculated for the bud using the DC values of the bud, bud scale, and 1 year-trunk/branches obtained in this study, instead of the ICRP DC values (Table 6), the dose rates from inside the tree were approximately 10-fold lower in both the 0–30 and 31–90 days periods, and 2.5-fold lower in the 1 year period after the accident than those estimated for the whole body of the ICRP reference pine tree by the IAEA (Fig. 5).
In the ICRP reference tree, the dose calculation was performed under the assumption that radionuclides were deposited on the tree at 0, 30, and 90 days, or those that migrated late from the soil 1 year after the accident were distributed uniformly within the ellipsoid trunk body of the reference tree. Accordingly, the majority of beta and a fraction of gamma rays emitted from the radionuclides are efficiently absorbed within the same ellipsoid target body. However, in the fir tree model, the target organ was limited to a small bud, which was not subject to the radionuclide deposition because of the surrounding bud scale shield. The bud scale also reduced beta ray entry into the bud from other plant parts, and consequently, the estimated dose rates during the early period after the accident were much lower than those in the ICRP reference tree. In the later period (1 year after the accident), internal exposure was the main contributor to the absorbed dose rate of the bud. However, the internal DC of the buds was much lower than that of the ICRP reference tree (Table 5), and the contribution of external radiation from the surrounding organs was also limited, resulting in lower dose estimates for the buds. For specific consideration of the dose-response for local biological effects on apical growth and morphogenesis of fir tree shoots in a contaminated forest, the fir tree model is more realistic than the ICRP model for the reference pine.
6. Possible Application of DC of the Fir Tree Model to Contaminated Forests
The fir tree model provides organ-specific DC values (Table 6), which can be used to calculate the absorbed dose rate from contaminating radionuclides based on the measurement of their concentrations in the organs localized on the 1-year shoot of fir trees in a contaminated forest. Simultaneously, the absorbed dose rate from outside the tree can be estimated from actual gamma-ray measurements in spaces adjacent to protruding small buds at the top of the trees in the forest. Exposure from outside the tree includes gamma rays not only from radionuclides in the soil, but also from those in neighboring trees and understory vegetation in the forest.
In the measurements of radionuclides in tree organs, the radioactivity concentrations vary depending on the physical and chemical/biological behavior of the radionuclides. Cesium-134 and Cesium-137 have long half-lives (approximately 2 and 30 years, respectively); therefore, accidentally deposited radionuclides can contribute to doses in the buds for years, partly through their rapid absorption and translocation to organs from the tree surface [10, 15, 16]. In contrast, 131I has a short half-life (approximately 8 days); therefore, the emitted radiation can affect the doses only during the early post-deposition period (<several months). The chemical/biological behavior during the short period after deposition is unclear for 131I in terms of absorption and translocation to tree organs from the tree surface and roots. However, to consider the possible seasonal biological effects of short-term exposure to the buds, DCs for both inner and surface contamination situations by 131I are useful for dose estimation in the buds (Table 6). Organ-specific models, such as the fir tree, are useful when considering biological damage to specific organs in radioactively contaminated forests. If other biological effects are observed, for example on reproduction or secondary growth, distinct dose estimations will be needed for relevant organs and tissues, such as reproductive organs and vascular cambium. In contrast, the ICRP reference tree is used for dose estimation in the entire tree without focusing on specific organs; therefore, it is useful when considering the possible radiation impact on the tree by comparison with empirically obtained criterion values of effects in exposed trees, especially for assessing the possible effect of radiation in contaminated forests.
Conclusion
In this study, we developed a method for estimating the radiation dose to the terminal buds of fir trees in contaminated areas based on the measurement of radionuclide distribution among plant organs. A fir tree phantom was developed to evaluate the absorbed dose rate in the terminal buds responsible for the morphogenesis of fir trees. DC values were evaluated for exposure of the terminal buds to 131I, 134Cs, and 137Cs inside phantom fir tree plant organs using Monte Carlo simulations. DC values were applied to field data in the contaminated forest for dose rate estimation in the fir trees. The fir tree phantom is useful for dose evaluation of fir trees considering doses responsible for local biological effects on apical growth and morphogenesis of shoots in radiologically contaminated fields.