Proposed Institutional Diagnostic Reference Levels in Computed and Direct Digital Radiography Examinations in Two Teaching Hospitals
Article information
Abstract
Background
The detectors of both computed radiography (CR) and direct digital radiography (DR) have a wide dynamic range that could tolerate high values of exposure factors without an adverse effect on image quality. Therefore, this study aims to assess patient radiation dose and proposes institutional diagnostic reference levels (DRLs) for two teaching hospitals in Ghana.
Materials and Methods
CR and DR systems were utilized in this study from two teaching hospitals. The CR system was manufactured by Philips Medical Systems DMC GmbH, while the DR system was manufactured by General Electric. The entrance skin doses (ESDs) were calculated using the standard equation and the tube output measurements. Free-in-air kerma (μGy) was measured using a calibrated radiation dosimeter. The proposed institutional DRLs were estimated using 75th percentiles values of the estimated ESDs for nine radiographic projections.
Results and Discussion
The calculated DRLs were 0.4, 1.6, 3.4, 0.5, 0.4, 1.1, 1.0, 1.2, and 1.7 mGy for chest posteroanterior (PA), lumbar spine anteroposterior (AP), lumbar spine lateral (LAT), cervical spine AP, cervical spine LAT, skull PA, pelvis AP, and abdomen AP, respectively in CR system. In the DR system, the values were 0.3, 1.6, 3.1, 0.4, 0.3, 0.7, 0.6, 0.9, and 1.3 for chest PA, lumbar spine AP, lumbar spine LAT, cervical spine AP, cervical spine LAT, skull PA, pelvis AP, and abdomen AP, respectively.
Conclusion
Institutional DRLs in nine radiographic projections have been proposed for two teaching hospitals in Ghana for the first time. The proposed DRLs will serve as baseline data for establishing local DRLs in the hospitals and will be a valuable tool in optimizing patient doses.
Introduction
The introduction of computed radiography (CR) and digital radiography (DR) in diagnostic radiology has been associated with patients’ potential overexposure without detection. The detectors of both CR and DR have a wide dynamic range that could tolerate high values of exposure factors without an adverse effect on image quality [1]. Exposure to ionizing radiation is associated with the potential risk of cancer and hereditary disorders [2]; therefore, its use must be optimized to minimize the risks to patients who undergo radiographic examinations. Medical exposure to ionizing radiation is the largest source of artificial exposure to ionizing radiation [3, 4]. The application of ionizing radiation in medicine would keep increasing due to technological advancements in equipment and accessories. Regular auditing of patient radiation dose could help detect potential overexposure and reduce patient radiation dose. In addition, it could provide information for radiographers and medical physicists for effective and efficient optimization protocols. In the UK, an annual assessment of patient radiation dose has contributed to reducing patient radiation dose [5]. Establishing diagnostic reference levels (DRLs) also allows for optimizing patient radiation dose. International Commission on Radiological Protection first recommended using DRLs in 1990 [6]. Since then, many regulatory, professional, and international bodies such as the American Association of Physicists in Medicine, International Atomic Energy Agency (IAEA), European Commission, and the United Kingdom Health Protection Agency have adopted DRLs as vital dose optimization management tool. The UK’s National Radiological Protection Board has reported a significant reduction in patient radiation dose since the introduction of national and local DRLs [7, 8]. Every country must establish its DRLs that are appropriate for their radiographic techniques and practices for the effective optimization of patient radiation protection [9]. However, there is no coordinated program to audit patient radiation dose periodically in Ghana, and national DRLs are yet to be established. This study aimed to assess patient radiation dose and propose institutional DRLs for two teaching hospitals in Ghana. It will serve as baseline data for establishing local DRLs in the hospitals. It will be a valuable tool in assisting in optimizing patient doses.
Materials and Methods
The study was conducted on 180 patients, which included 105 females and 75 males. The average age, weight, and height of the patients were 54.0±13.0 years, 66.0±8.0 kg, and 165.0± 8.0 cm, respectively. One of the teaching hospitals has a CR system while the other uses a DR system. The CR system was manufactured by Philips Medical Systems DMC GmbH (Hamburg, Germany). The model number was SN11000366, and the maximum kilovoltage peak (kVp) was 150. This equipment was installed in 2012 and was operated with automatic exposure control. General Electric (Boston, MA, USA) manufactured the DR system. The model number was Discovery XR656 Plus (GE HealthCare, Chicago, IL, USA). This system was installed in 2016 with a maximum kVp of 150. The equipment was operated with automatic exposure control. Quality control (QC) tests on the X-ray generator performance were performed before the measurements. These included kVp accuracy, kVp reproducibility, timer accuracy, exposure linearity, and exposure reproducibility.
The dosimetric quantity used for assessing patient radiation dose and the DRLs was the entrance skin dose (ESD). The ESDs were calculated using the standard equation and the tube output measurements. Free-in-air kerma (μGy) was measured using RaySafe X2 (3.10R01f) radiation dosimeter manufactured and calibrated by Unfors RaySafe AB in Billdal, Sweden. The dosimeter was placed at a focus-to-detector distance (FDD) of 100.0 cm, and the radiation field was collimated to 10 cm×10 cm to avoid unnecessary scattering. Peak tube voltage (kVp) settings of 50 to 110 with the incremental step of 10 and tube current-time product of 4 milliampere second (mAs) were the exposure factors used to determine the tube output. Each kVp and mAs setting was exposed three times, and the average dosimeter readings were recorded. The tube output was selected as the ratio of dosimeter readings (free-in-air kerma) to the mAs used. A graph of tube output (μGy/mAs) against kVp2 was plotted from which tube output (mGy/mAs) was obtained for every kVp used for the actual examinations. The ESD (mGy) was then calculated using Equation (1) [10, 11].
where BSF is the backscatter radiation, FSD is the focus-to-skin distance, and mAs is the product of current and time. A backscatter factor of 1.37 recommended by the IAEA [12] was used in this study, which has been used by some researchers [10] for calculating the ESDs. Data analysis was carried out using Microsoft Excel 2013 (Microsoft, Redmond, WA, USA). ESDs and technical exposure factors were presented in mean and standard deviations. One-way analysis of variance (ANOVA) was used to determine the significant difference in ESDs between the CR and DR systems. DRLs were estimated using 75th percentiles values of the estimated ESD doses for a particular examination [13]. The study was conducted in two teaching hospitals in Ghana. One hospital is located in the northern part, while the other is in the southern part of the country.
Results and Discussion
The exposure factors used to estimate ESDs are presented in Table 1. Chest posteroanterior (PA) examination in both CR and DR was performed using high kVp and low mAs with the same FDD of 180 cm. However, the FDD for the remaining examinations was 120 cm for the DR and 100 cm for the CR.
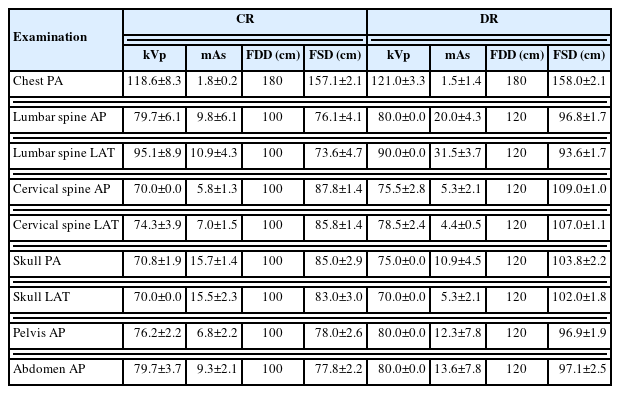
Technical Factors Used for the Estimation of Entrance Skin Dose (mGy)
Table 2 shows the results of air kerma, tube output, and the measured kVp for both CR and DR systems. Free-in-air kerma and tube output values were higher in the CR system than DR for all the selected kVp.
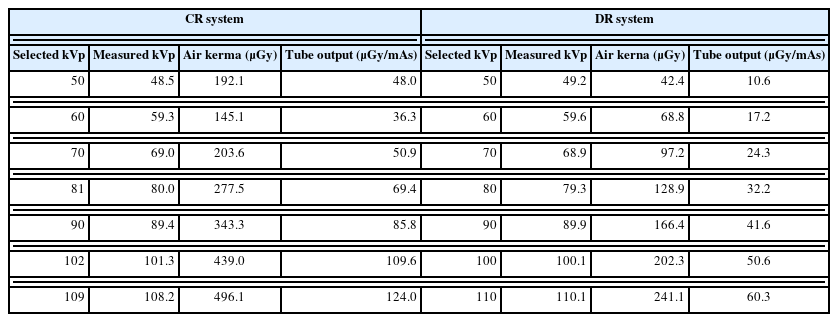
Tube Output and Air Kerma for Both DR and CR Systems
Figs. 1, 2 show a graph of tube output versus kVp2 for DR and CR systems. The minimum and maximum tube output for DR were 10.6 and 60.3 μGy/mAs, which occurred at 50 and 110 kVp, respectively. Therefore, Equation (2) describes the relationship between tube output and the kVp2 for the DR systems with R2=0.9972.
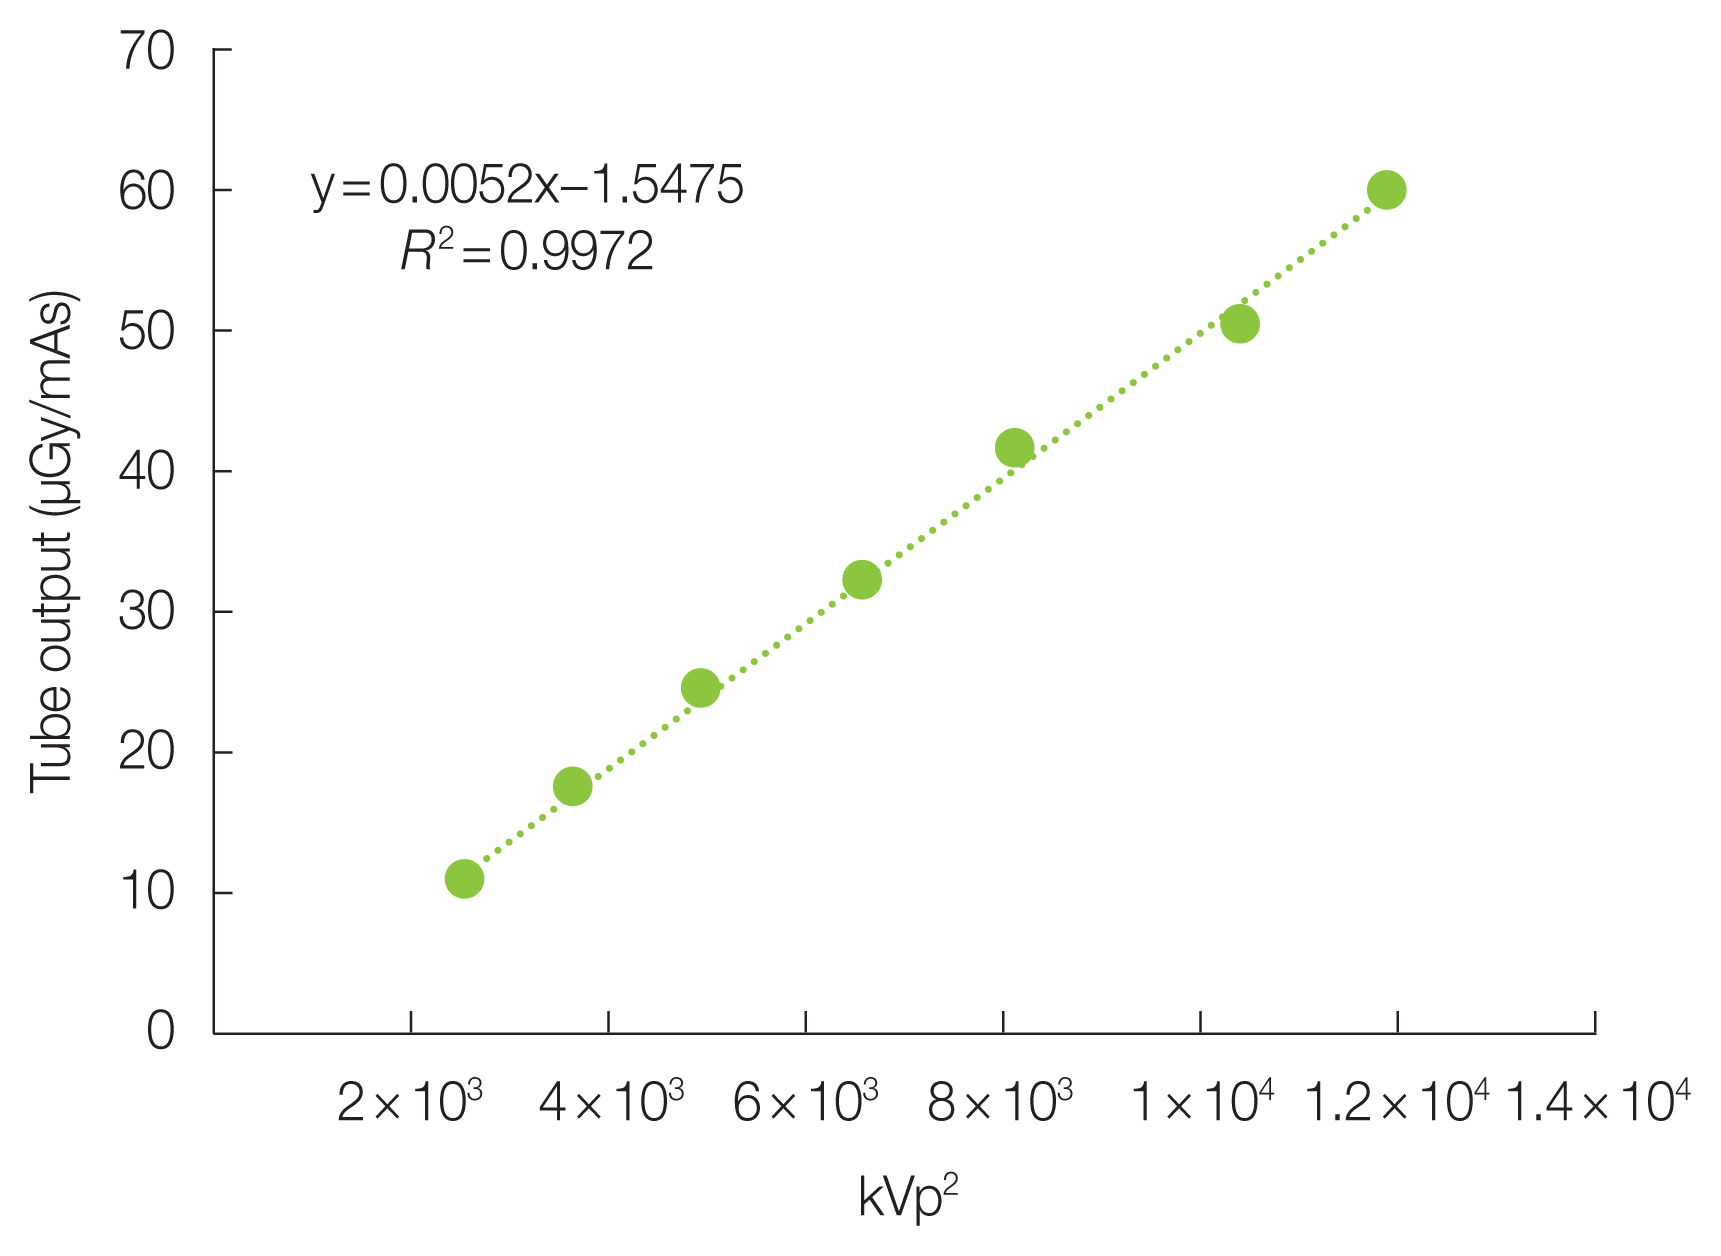
Relationship between tube output and kVp2 for the digital radiography system. kVp, kilovoltage peak; mAs, milliampere second.
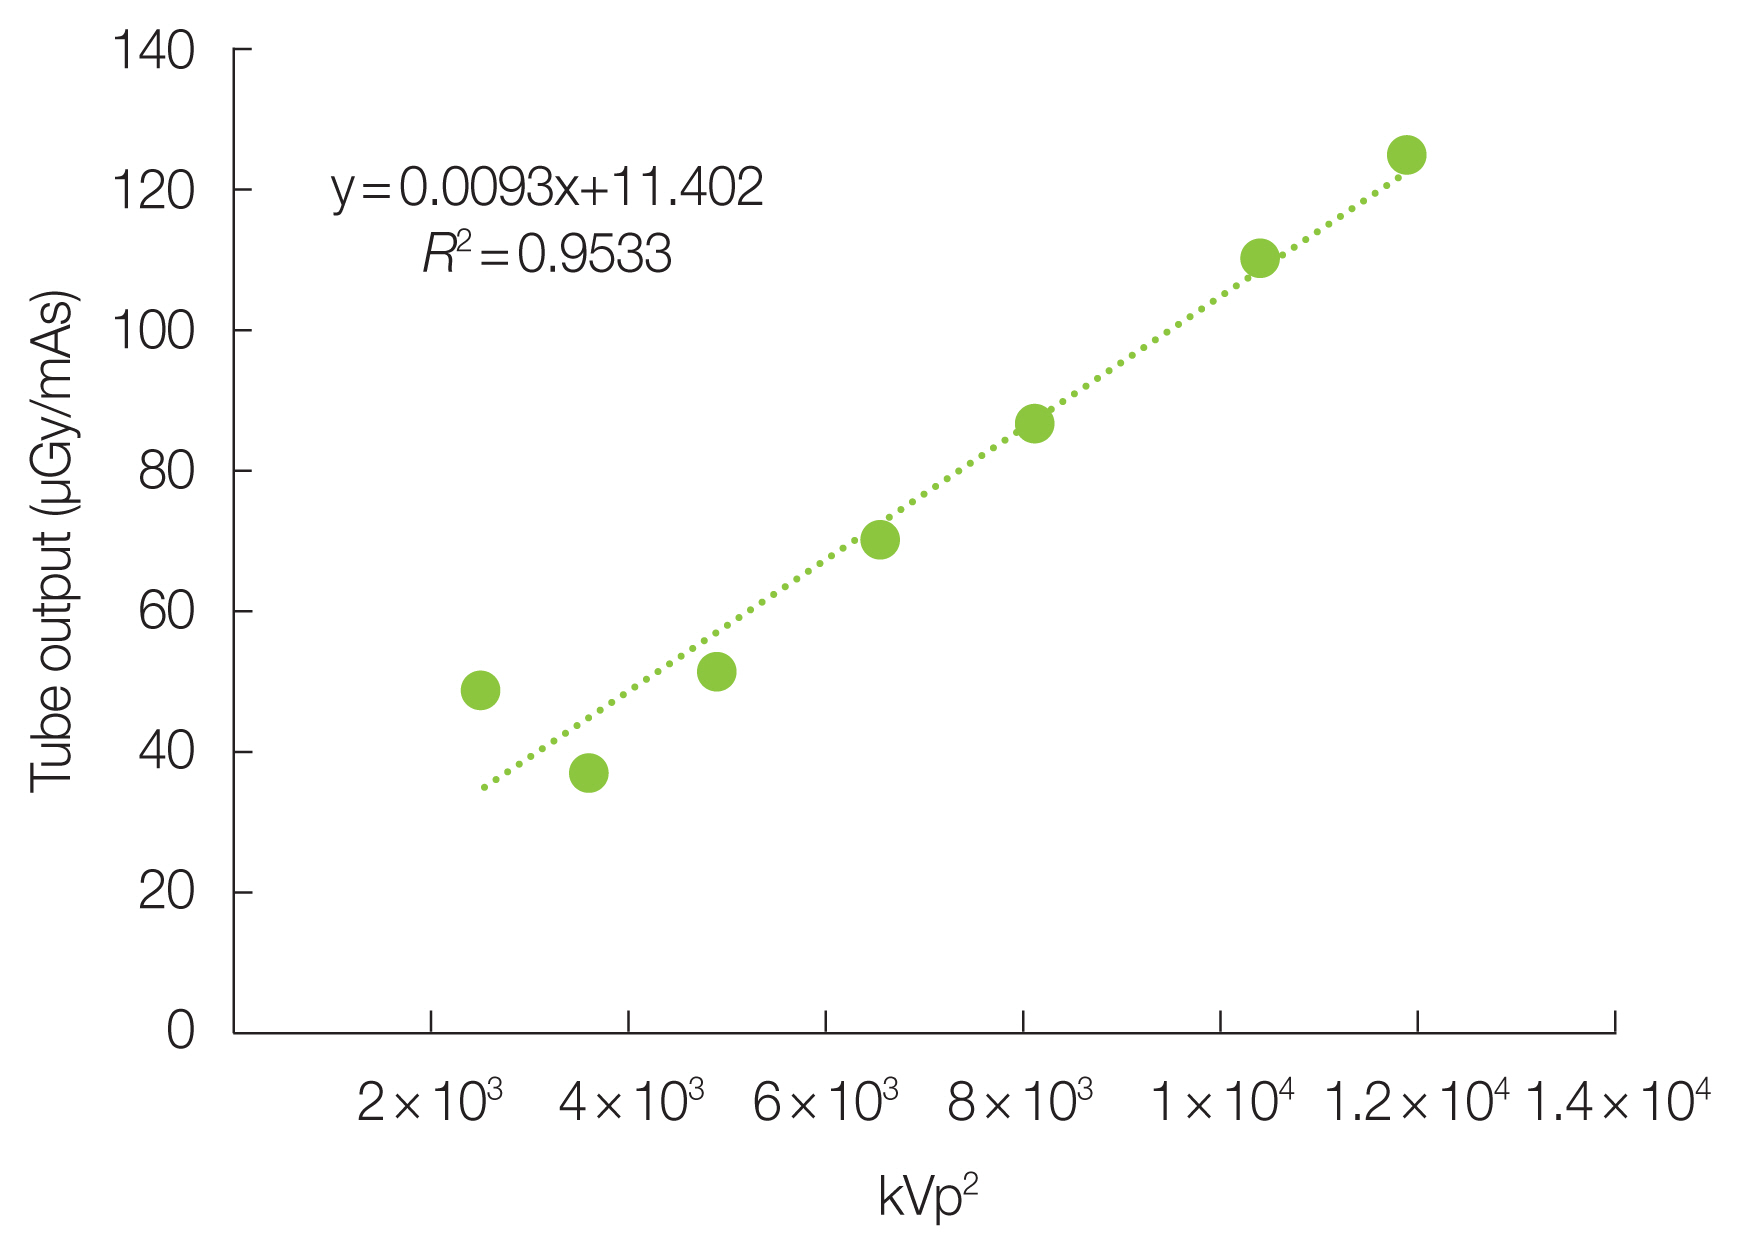
Relationship between tube output and kVp2 for the computed radiography system. kVp, kilovoltage peak; mAs, milliampere second.
Where y is the tube output and x is the kVp2.
The CR system has its minimum and maximum tube output at 48.0 and 124.0 μGy/mAs, and occurred at 50.0 and 109.0 kVp, respectively. Equation (3) describes the relationship between tube output and the kVp2 for the CR system with R2=0.9533.
Where y is the tube output and x is the kVp2.
Generally, the tube output for DR and CR has a linear relationship to kVp2, and that increase in kVp has a corresponding rise in the tube output. The calculated ESDs (mGy), estimated local DRLs (mGy), and p-values of DR and CR systems are presented in Table 3.

Estimated ESD (mGy) and Local DRLs (mGy) for CR and DR
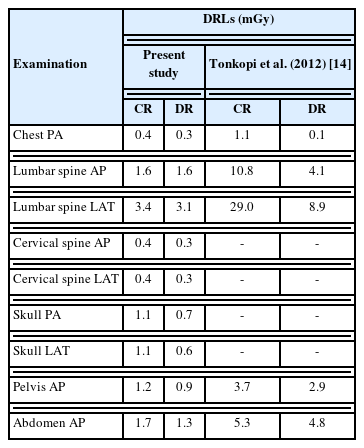
The lowest ESD recorded in DR was 0.2±0.1 mGy for chest PA examination, while lumbar spine lateral (LAT) recorded the highest ESD of 2.6±0.5 mGy. In the CR system, the ESD for chest PA examination was 0.3±0.1 mGy, while the lumbar spine LAT was 2.8±0.4 mGy. ESDs for pelvis anteroposterior (AP) and abdomen AP in DR were 0.8±0.1 and 0.9±0.3 mGy, respectively, lower than the same examinations in CR. However, higher exposure factors of 80.0 kVp, 12.3 mAs and 80.0 kVp, 13.6 mAs for pelvis AP and abdomen AP, respectively, were used in DR, while 76.2 kVp, 6.8 mAs, and 79.7 kVp, 9.3 mAs for pelvis AP and abdomen AP, respectively, were used in CR. FDD in DR for these examinations was 120 cm, while in CR, the FDD for the same studies was 100 cm. Generally, the ESDs in CR were higher than the ESDs in DR for all the examinations. There were significant differences in ESDs for some examinations; however, the ESDs for lumbar spine AP, spine LAT, and pelvis AP examinations show no significant differences, as indicated by p-values in Table 3. The results of this study were compared to local DRLs established by Tonkopi et al. [14], for DR and CR, as shown in Table 4. This comparison was made because Tonkopi et al. [14], estimated local DRLs for both CR and DR similar to the current study.
Screen-film, CR, and DR systems are the imaging modalities employed in diagnostic radiography examinations in Ghana. However, screen-film is gradually being replaced by CR and DR due to the superiority of digital systems. The CR system is commonly used in Ghana due to its cheap initial setup cost. There is the possibility that CR and DR could become the preferred imaging modality in Ghana due to the ongoing transition from screen-film to digital radiology systems. Hence, patient radiation doses in CR and DR should be well understood to provide appropriate optimization protocols to ensure the safe use of the digital systems. The results of QC tests showed that the two X-ray equipment performances were clinically acceptable. QC tests are necessary to ensure that timely and accurate diagnoses are achieved [15].
This study observed that patients’ radiation doses were lower in DR than in CR. QC results indicated lower tube output values in DR than in CR for the same exposure factors. Therefore, the lower radiation doses in DR could be due to the low tube output values. Again, the total filtration in CR was lower than in DR for the same exposure factors. High filtration values ensure that soft X-rays that would have caused an unnecessary increase in patient radiation doses are absorbed, thereby increasing the quality of the X-rays and their penetrability in tissue. Also, the FDD in DR was longer than in CR. The examinations in DR were performed using FDD of 120 cm except for chest PA. At the same time, 100 cm was used in CR. Due to the divergent nature of X-rays, the intensity decreases as the distance increases, and therefore doses to patients reduce equally per the inverse square law. These factors might explain why exposure factors were higher in DR for pelvis AP and abdomen AP examinations, although patient doses were lower than CR. Aldrich et al. [1], made a similar observation in patient radiation doses and reported that doses in CR were higher than DR for chest PA, abdomen AP, and pelvis AP examinations. The higher doses in CR were primarily attributed to higher mAs used for CR examinations. Patient doses for similar examinations were higher in CR than DR by a factor of 1.2 to 3.0 [14]. A study by Brennan et al. [16], showed that increasing FDD from 100 to 130 cm could reduce patient radiation dose by 44.0% and 33.0% for lumbar spine AP and pelvis AP examinations, respectively. Another study reported a patient radiation dose reduction of 59.5% when the FDD was increased up to 150 cm in lumbar spine examination [17].
Another reason for the lower doses in DR that were observed was the use of anatomical programmed radiography software in the DR system, which was not available in the CR system. This anatomical programmed radiography software automatically selects exposure factors for the radiographer when the patient is correctly positioned and appropriate imaging protocols are selected from the console. It eliminates the possibility of human errors in manually setting the exposure factors as inexperience or fatigue on the part of the technologist could lead to potential overexposure of patients.
DRLs are an investigational tool used to identify high patient radiation doses which require corrective action if consistently exceeded. Dose reduction of about 16.0% to 30.0% [18] had been achieved due to the introduction of DRLs in the United States. However, in Africa, no evidence exists from any country showing the establishment of national DRLs [18].
The proposed DRLs in this study indicated lower values for DR (Table 3). It means that different DRLs should be set for DR and CR even if the two modalities are in the same facility. A comparison of the current study to Tonkopi et al. [14], showed variations in the DRLs values for DR and CR. Diop et al. [19], estimated DRLs for seven radiographic examinations using CR systems and reported variations in DRLs values. These variations could arise from the X-ray equipment characteristics, the knowledge and the experience of the radiographers in digital systems, exposure factors, and patient sizes. Therefore, in setting up DRLs, QC tests must be performed on the X-ray equipment to ensure that the equipment performs optimally and that proper training of technologists operating digital systems has been organized.
Conclusion
Institutional DRLs in nine radiographic projections have been proposed for two teaching hospitals in Ghana for the first time. It would serve as baseline data for establishing local DRLs in the hospitals, which would be a valuable tool in optimizing patient doses. The patient doses in DR are lower than in CR. Therefore, different DRLs should be set for DR and CR due to the difference in patient radiation doses. The radiographers and technologists should also be educated on the principles of DRLs as an optimization tool to manage patient radiation doses.
Acknowledgements
The authors express profound gratitude to the following: Ghana Education Trust Fund (GETfund) for their financial support of the correspondent author’s education; Norwegian Partnership Programme for Global Academic Cooperation (NORPART); Mr. Leonard Quansah of Philips Medical systems–Ghana for supporting this research work.
Notes
Conflict of Interest
No potential conflict of interest relevant to this article was reported.
Ethical Statement
Ghana Health Services Ethics Review Committee approved the research protocol with approval identification of GHS/RDD/ERC/Admin/APP19/003. Patients’ informed consent was obtained before being recruited into the study. The data obtained from this study were kept in a locked file and were only accessible to the researchers. The presentation of data in this study did not disclose the identity of patients in any form.
Author Contribution
Conceptualization: Gyan E. Methodology: Gyan E. Data curation: Subaar C. Supervision: Amoako G. Investigation: Amoako G. Formal analysis: Amoako G. Project administration: Inkoom S. Visualization: Inkoom S. Resources: Maamah BR. Validation: Subaar C, Maamah BR. Writing - original draft: Gyan E. Writing - review and editing: Gyan E. Approval of final manuscript: all authors.