

Introduction
As the number of nuclear facilities nearing their pre-determined design life increases, demand is increasing for technology and infrastructure related to the decommissioning and decontamination (D&D) process. The D&D industry is now more widespread than in the early stages of the nuclear industry. As of June 2021, approximately 193 units have been permanently closed worldwide [1]. The only countries to complete the dismantling and license termination are the United States (16), Germany (3), Japan (1), and Switzerland (1). Moreover, 11 countries are in the early stages of dismantling their nuclear power plants (NPPs) [2].
The D&D process of nuclear facilities generally goes through the stages of preparation after shutdown, decontamination and dismantling, and site restoration. In the preparation phase, the decommissioning plans are established, and the spent fuel withdrawal is performed. In the D&D stage, the radioactive contamination from the surface of the facility or equipment is removed, which is the decontamination part. Further, the dismantling is carried out by cutting and removing the entire facility. Upon completion of all the decommissioning processes, any traces of radioactive material remaining on the facility and site are removed, and the site is made available for reuse. The dismantling process is carried out by repeatedly using various industrial tools in the process where radioactivity remains, and it is necessary to evaluate not only the radiological characteristics but also the industrial characteristics [3]. In addition, it is also necessary to consider the nature of the dismantling environment constantly changing and the worker performing new tasks. Conventional D&D processes and studies related to the safety assessments do not reflect these characteristic changes or do so in a limited manner.
Various studies have simulated the complex changing environment in the D&D process [4–7]. Some studies have analyzed the radiation-dose rate change using neutron analysis codes, e.g., the Monte Carlo N-Particle Transport Code (MCNP), and three-dimensional (3D) computer-aided design (CAD) modeling. Three-dimensional dose evaluation codes, such as the VISIPLAN dose assessment program, enable the evaluation of changes in radiation doses, according to changes in the surrounding environment [8–10]. This analysis is limited, in that it can only respond to changes in the environment. In the dismantling process, not only the environment, but also a worker’s performance can be variables.
The learning curve is a model for predicting and describing the performance of groups and individuals from their direct and indirect labor in various industries [11, 12]. It has been reported that the time to complete a unit of work (working time) decreases depending on the amount of experience the worker has, and various studies have been conducted to demonstrate this model [13, 14]. As the workers spend more time working, their understanding of the work increases. Increased occupational understanding can reduce human error and increase work efficiency, but it must be remembered that working in radiation-controlled areas exposes workers to radiation [15, 16]. The change in the worker’s performance can be analyzed by applying these studies to the dose assessment during the D&D of a nuclear facility. It can consequently help optimize the protection, according to the principle of “as low as reasonably achievable (ALARA)” [17, 18].
In this study, the learning-forgetting model was applied to analyze the change in the worker’s efficiency in the D&D process of a nuclear facility. If the effect of learning can be corrected by applying the learning-forgetting model to the existing dose evaluation method, a more accurate dose analysis can be performed on the worker. These considerations can be helpful in both individual and collective dose assessments and the radiation protection for new decommissioning workers, and this will help plan in a decommissioning environment where changes in personnel are frequent.
A model capable of evaluating the appropriate number of simulated training days was designed and applied, based on an analysis of the worker’s simulated training performance. Based on the evaluated model, the change in the individual dose, according to the change in work performance, is analyzed, and the change in the collective dose can be calculated accordingly.
Materials and Methods
1. Learning-Forgetting Curve Model
The learning-forgetting model describes the performance of groups and individuals as they learn and forget over time. Many studies have been performed using the traditional Wright’s learning curve [19]; it has been tested with empirical data.
Jaber and Sikstrom [13] compared the learning-forgetting model, the learning-forgetting curve model (LFCM), recency (RC) model, and power integration diffusion (PID) for five different scenarios. The results showed that the faster the learning, the higher the prediction of the PID, and the slower the learning, the higher the prediction in the LFCM and the RC model. It has been concluded that these models should be further investigated in various industrial settings. Amongst them, LFCM has been expanded by considering job similarity factors in [20]. Because the environment considered in this study is a consideration process within the dismantling process where the working environment changes, not the work performed in a certain environment, the LFCM was applied considering these characteristics. The model-specific interpretation is presented in Equations (1)–(6).
where
txi = Time required to produce x units in cycle i (hr),
T1 = Time required to produce the first unit (hr),
xi = Number of units produced in cycle i,
ui = Value of experience remembered at the start of cycle i,
b = Learning index,
fi = Forgetting index,
Si =Total output when there is no break,
τi =Length of break (hr),
D =Time required to completely forget a task (hr),
LR =Learning rate.
The calculation for working is given by Equation (1). The working time is reduced by the learning index, and the task is repeated. The meaning of “produce” would mean the production of things in previous research for industrial assessments. The production of a thing can be defined as the ultimate by-product that occurs through repetitive operations in the production process. In the process of dismantling, cutting is repeatedly performed to produce a certain amount of waste, which can be viewed as the final product. Therefore, the process of cutting one block was considered by applying the concept of repeating the same operation to produce a specific result. u was defined as the level of memory that the worker remembers about the operation in the rest phase after the operation phase.
As a result of analyses in various industries, the LR value was reported to be about 80%, on average. Because this value is predicted to be consistent with the median value of the LR range of a similar construction industry, the LR value was assumed to be 0.8 [21]. xi is one unit of work, and ui is an indicator of how much a worker remembers about a task when he has taken a break. This value increases proportionally to how much work was performed previously and how much was previously remembered. D, the time required for the worker to completely forget the task, was assumed to be 6 months used in related studies [22].
The cycle represents the current state of the worker, and changes when transitioning from work to rest or from rest to work. The total work time can be calculated by multiplying the number of work units by the time required to complete one unit. Therefore, when xi is multiplied by txi, the working time t is calculated. Equation (1) can then be expressed as Equation (7).
The change in xi, according to the working time t, can be calculated using Equation (7). The changes in other factors, according to the working time t, are also calculated. When t=0, the initial conditions of x0 and u0 are 0 and 0, respectively, assuming that both the initial work produced and the learning about the task start from 0.
2. Scenario Assumptions
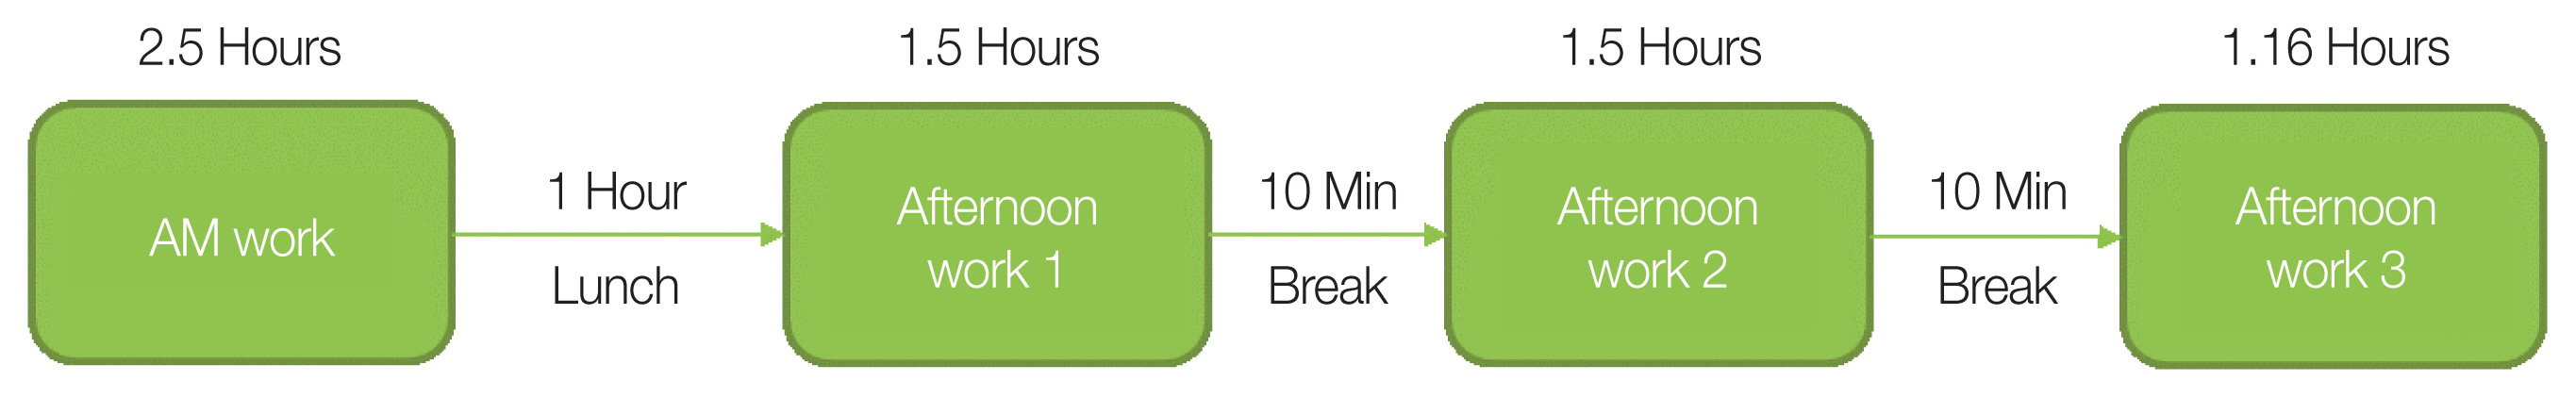
Detailed calculations require the assumption of a worker’s work schedule considering task-specific learning. The worker’s daily work schedule is assumed, as shown in Fig. 1. Workers have a 1-hour lunch after 2.5 hours of work and a 10-minute break after 1.5 hours of work. They then have 1.5 hours of work, a 10-minute break, and 1.16 hours of work. The total work duration is 8 hours because it includes 30 minutes of preparation and cleanup time; e.g., putting on a work suit and wearing a thermoluminescent dosimeter (TLD) before and after work. This schedule allows the worker to work for 5 days and take a 2-day weekend break.
Decommissioning scenarios and dose assessments were based on scenarios used in previous studies and the results of the dose assessment analysis [23, 24]. This scenario considers cutting an activated bio-shield using a diamond wire saw (DWS), wet cutting, and dry cutting. Because calculations indicate that it takes 1,760 hours (approximately 10 months) to cut activated concrete, it is considered suitable for simulating the effect of learning, according to long-term work over 6 months.
In a previous study, the scenario and doses of the workers were analyzed in the process of dismantling the bio-shield. Based on the scenario in this analysis, it was assumed that four tasks were performed, including preparation, drilling, DWS cutting, and lift and cleanup. The assumptions are shown in Table 1. As a result of the dose evaluation in the previous study, the collective dose was evaluated to be 1,588 man-mSv when working for 2,754 hours during wet cutting, which is an evaluation based on considering skilled workers.
During daily work, the worker proceeds with dismantling while repeating the process from preparation to cleanup. A series of processes can be regarded as a unit of work, and the unit work time is reduced as the work is repeated. In a previous study, a 15 m-high annular cylinder was cut into 1 m-high pieces, and it was assumed to be cut into 20 blocks on one floor. Because three cuts are required to make one block, the total amount of work required for dismantling is calculated as 900 units.
In the D&D process, there is a change in working time due to learning, and since the occupational exposure is determined according to the working time, it is necessary to correct it. The evaluation of dose was based on a previous study on dose assessment. VISIPLAN was used to obtain the results for a worker dismantling a bio-shield. The time considered for a skilled worker to work one cycle is shown in Table 1. Because the evaluation was based on a skilled worker, the value of T1 must be derived for the LFCM correction of a trained but inexperienced (basic-trained) worker. A skilled worker is assumed to be sufficiently trained and experienced; therefore, it is considered that there is little change in txi with time.
The T1 shown in Equation (7) is the speed at which a basic-trained person performs a task. In practice, it is difficult to know the exact T1 because the decommissioning task is being performed by a skilled worker. In previous research, the txi of a skilled worker was calculated as 3.06 hours for decommissioning a bio-shield. A correction based on this value was required. To determine the initial value T1, the gradient was analyzed when txi reached 3.06 hours, while attempting and adjusting an arbitrary value of T1.
In the dismantling of NPPs, the nature of the task makes it difficult for a basic-trained worker to participate in the task. Therefore, prior to the dismantling, the worker will undergo mock-up training using DWS to minimize the risk and ensure safety. The minimum training time can be defined by the Enforcement Rules of the Construction Machinery Management Act [25]. According to the Act, 6–8 hours of education are required for theory, and 6–12 hours are required for practice. Although there is no equipment equivalent to a DWS, it is assumed that the training is performed for 3 days, considering the maximum training time in the Enforcement Rules.
3. Training Optimization
Based on the evaluated LFCM and the dose assessment data, a detailed optimization analysis can be carried out. In the derived scenario in Section 2.2, the workload should be 900 tasks with 15 floors, 20 blocks, and three faces. Dividing the individual doses obtained earlier by the annual dose limit, the number of teams is calculated not to exceed the annual dose limit of the individual. Here, the team derived in previous studies for each task is made up of workers performing different tasks, it can also be viewed as the number of shift workers. The required number of teams was considered as P, and it was calculated according to Equation (8),
where
The total occupational exposure for the same work derived in previous research was 530 mSv in wet cutting; therefore, 30 teams were required. Then, the amount of work for each team was calculated as 900/30=30 units. The total working time of all teams can be calculated by multiplying the time it takes for each team to work by the number of teams. Using Equation (8), the time required for a team to achieve a certain amount of work can be calculated.
Results and Discussion
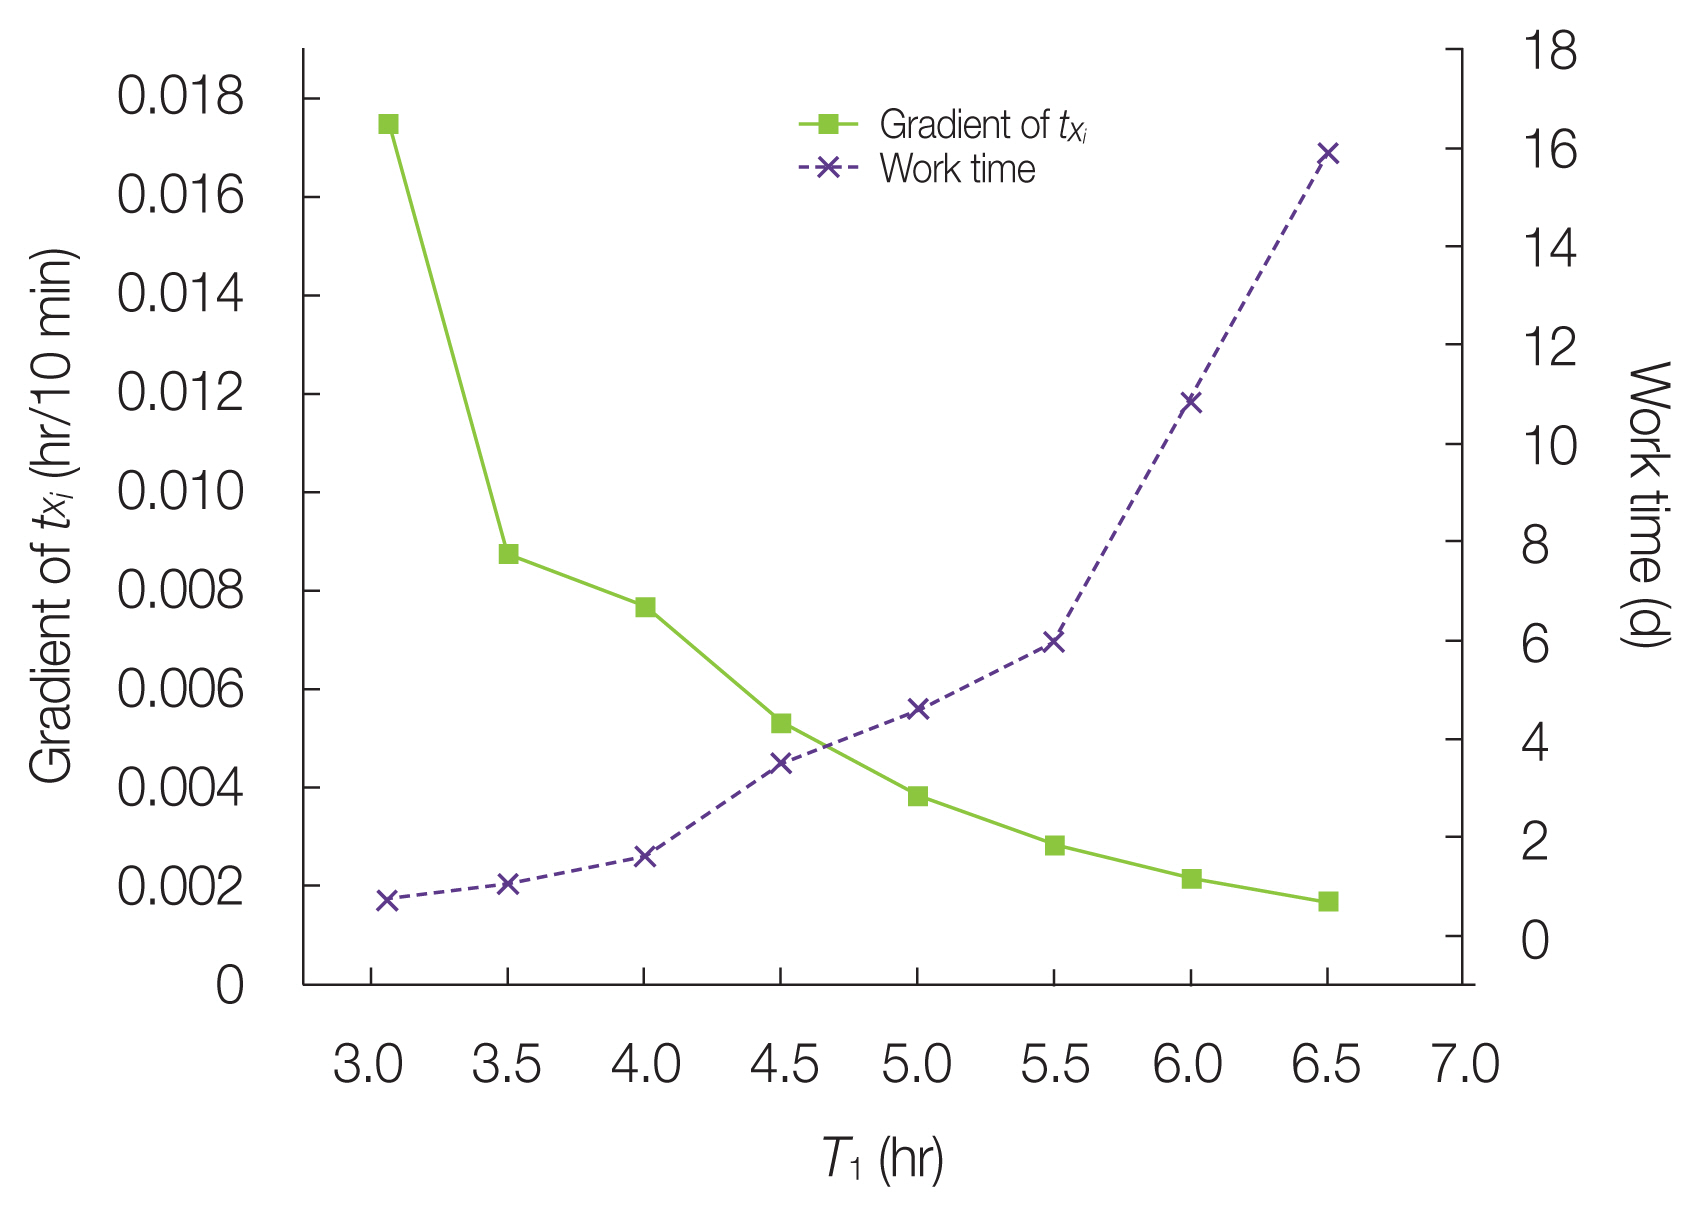
For the evaluation, the result of analyzing the gradient of txi and the work time to reach reference txi, as a function of an arbitrary T1 in the LFCM. The change in both values is shown in Fig. 2. The gradient of txi indicates the level of change in txi for the first 10 minutes after starting the first task, and the working time is the time it takes to satisfy the criteria of skilled workers when performing tasks according to the scenario. The larger the gradient of txi, the faster the worker’s learning proceeds. As a result of checking the change of txi for gradient every 10 minutes, the valid range of values was 3.06 hours ≤T1≤6.5 hours. The minimum value of T1 is 3.06 hours, and in the case where 7 hours was exceeded, a reference txi of 3.06 hours was not derived. Therefore, the range of possible T1 values is considered from 3.06 hours to 6.5 hours. The gradient of txi decreases and the work time to reach it increases as T1 increases. It can be predicted that, as T1 increases, the time required for a worker to become skilled increases, and the performance becomes saturated in the case of a skilled worker. For the LFCM analysis, 6.5 hours was determined as the reference T1. The change in time required to work on a unit was analyzed by applying the LCFM to the derived reference T1.
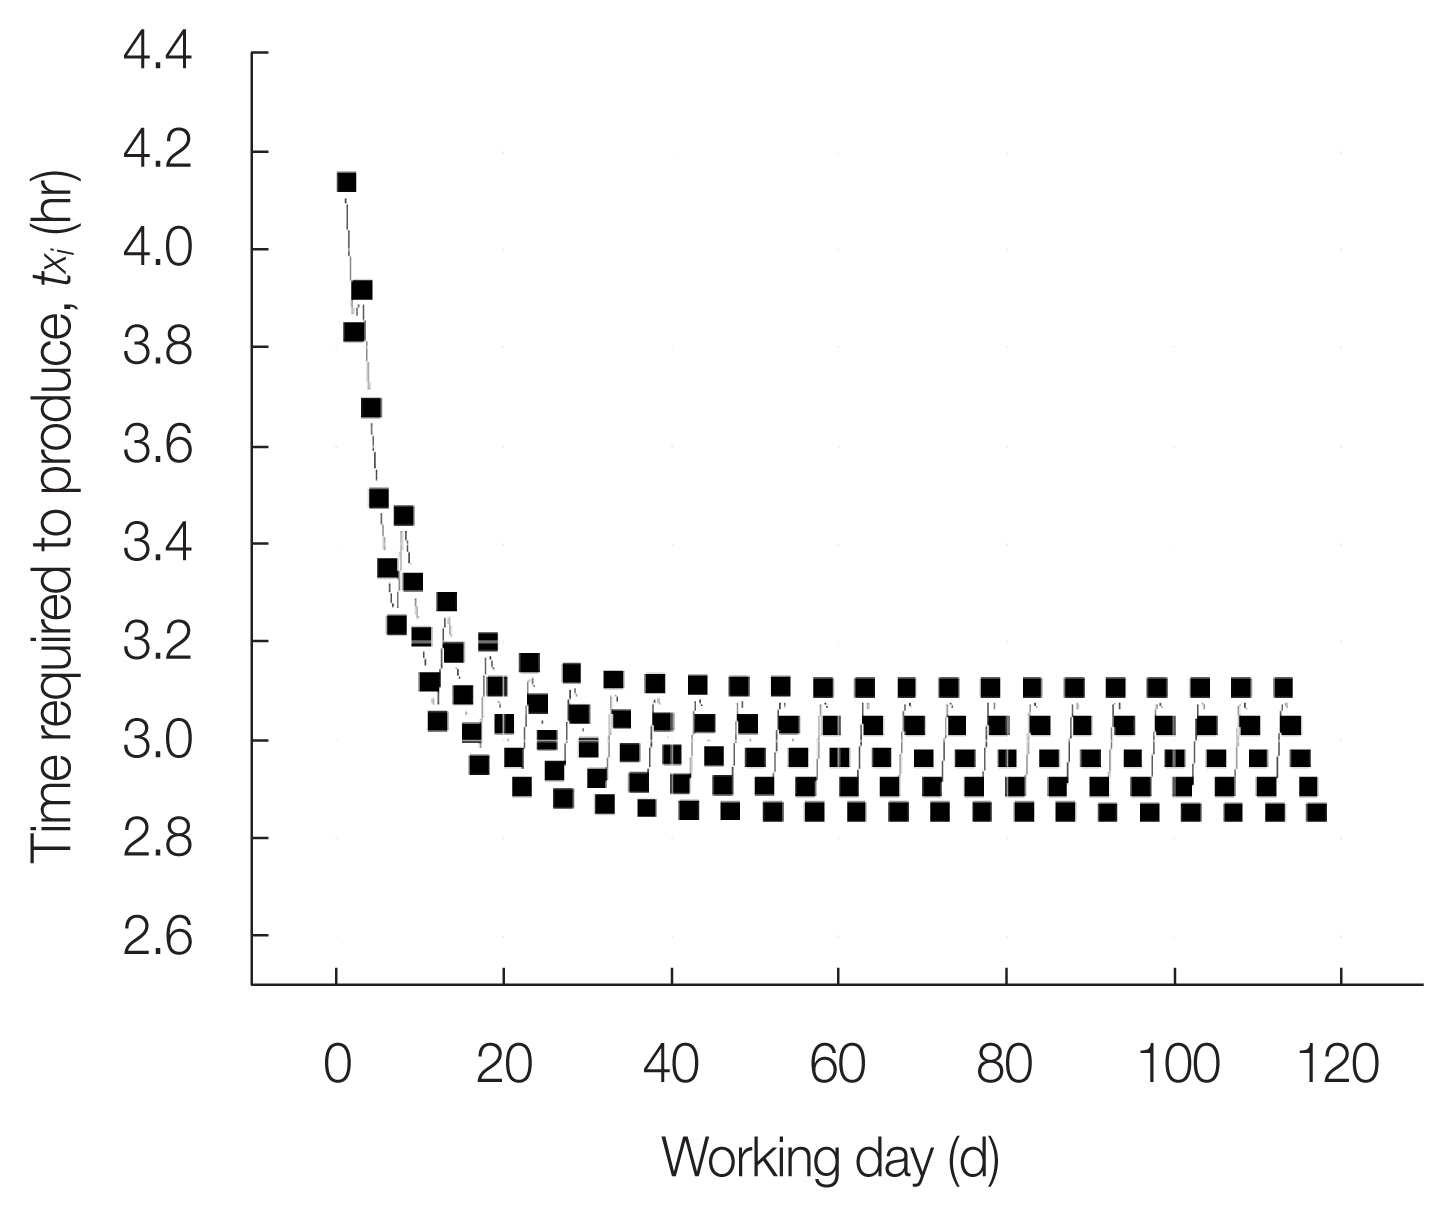
Fig. 3 shows the change in time required to work on a unit immediately on the first day of work. It can be seen that the work efficiency is inversely proportional to the time txi required for a unit of work. txi decreased from 4.61 hours to 4.13 hours, and the changes are stagnant during the lunch and break times. Fig. 4 shows the result of analyzing the learning effect over a long period (6 months), as this trend is accumulated.
The initial working time ended at 4.13 hours on the first day. However, within a month, the working time was reduced to less than 3.2 hours. In this graph, only changes in txi during weekdays were considered. Therefore, a steady decrease in txi is observed when the worker engages in the work process for a period of 5 days. A sharp increase in txi appears after the 2-day weekend; however, it does not appear on the graph. As time passes, the gradient of txi decreases, and the time tends to converge. To better identify these trends, the 5-day values were averaged into a weekly average value, and are shown in Fig. 5.
Fig. 5 shows an exponential function of 5-point average for txi. By fitting this graph, the following equation can be derived.
The R2 value of the fitting function was calculated to be 0.99, indicating that the fitting function makes a good representation of the data trend. Considering that the LFCM is in the form of an exponential function, it can be considered acceptable that the derived function converges to 2.98 hours to complete a unit of work as time increases. The fitting function is simpler than the Equations (1)–(7) used for evaluation and can be useful for trend analysis and subsequent training-days optimization.
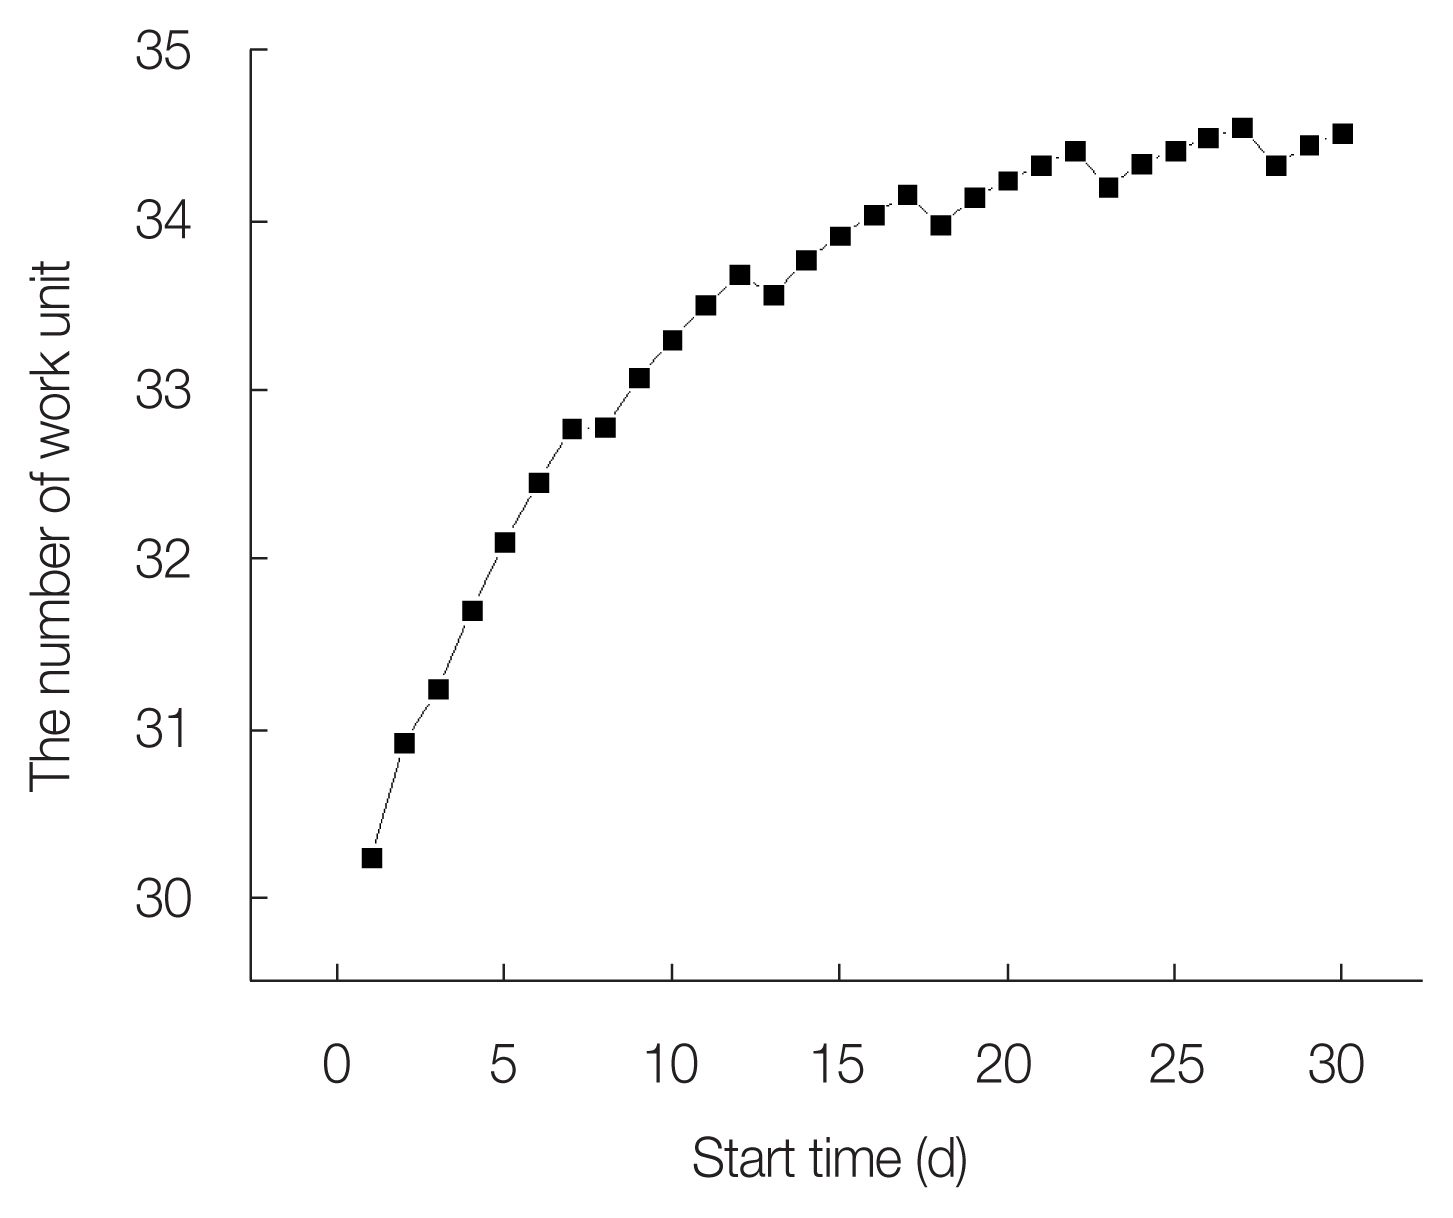
The accumulated work units can be calculated by accumulating the xi in the LCFM, and the results are listed in Table 2. Because the number of teams is derived as 30, the accumulated number of work units must exceed 30 to fit the total of 900 work units. Table 2 shows that 30 tasks were completed within 16 days. Thus, for exposures below the annual dose limit, 30 teams can complete the dismantling of the radioactive concrete by working in 16 days. If mock-up training using DWS similar to the actual work is performed to gain experience, the work efficiency can be increased while reducing the working time in the radiation work area. Moreover, the efficiency based on the training can be calculated by comparing the accumulated number of work units for 16 days. To analyze the training effect, the increase in the number of work units over training days was analyzed, as shown in Fig. 6. Through this analysis, it can be confirmed how much the workload increases when performing the same task according to the number of training days.
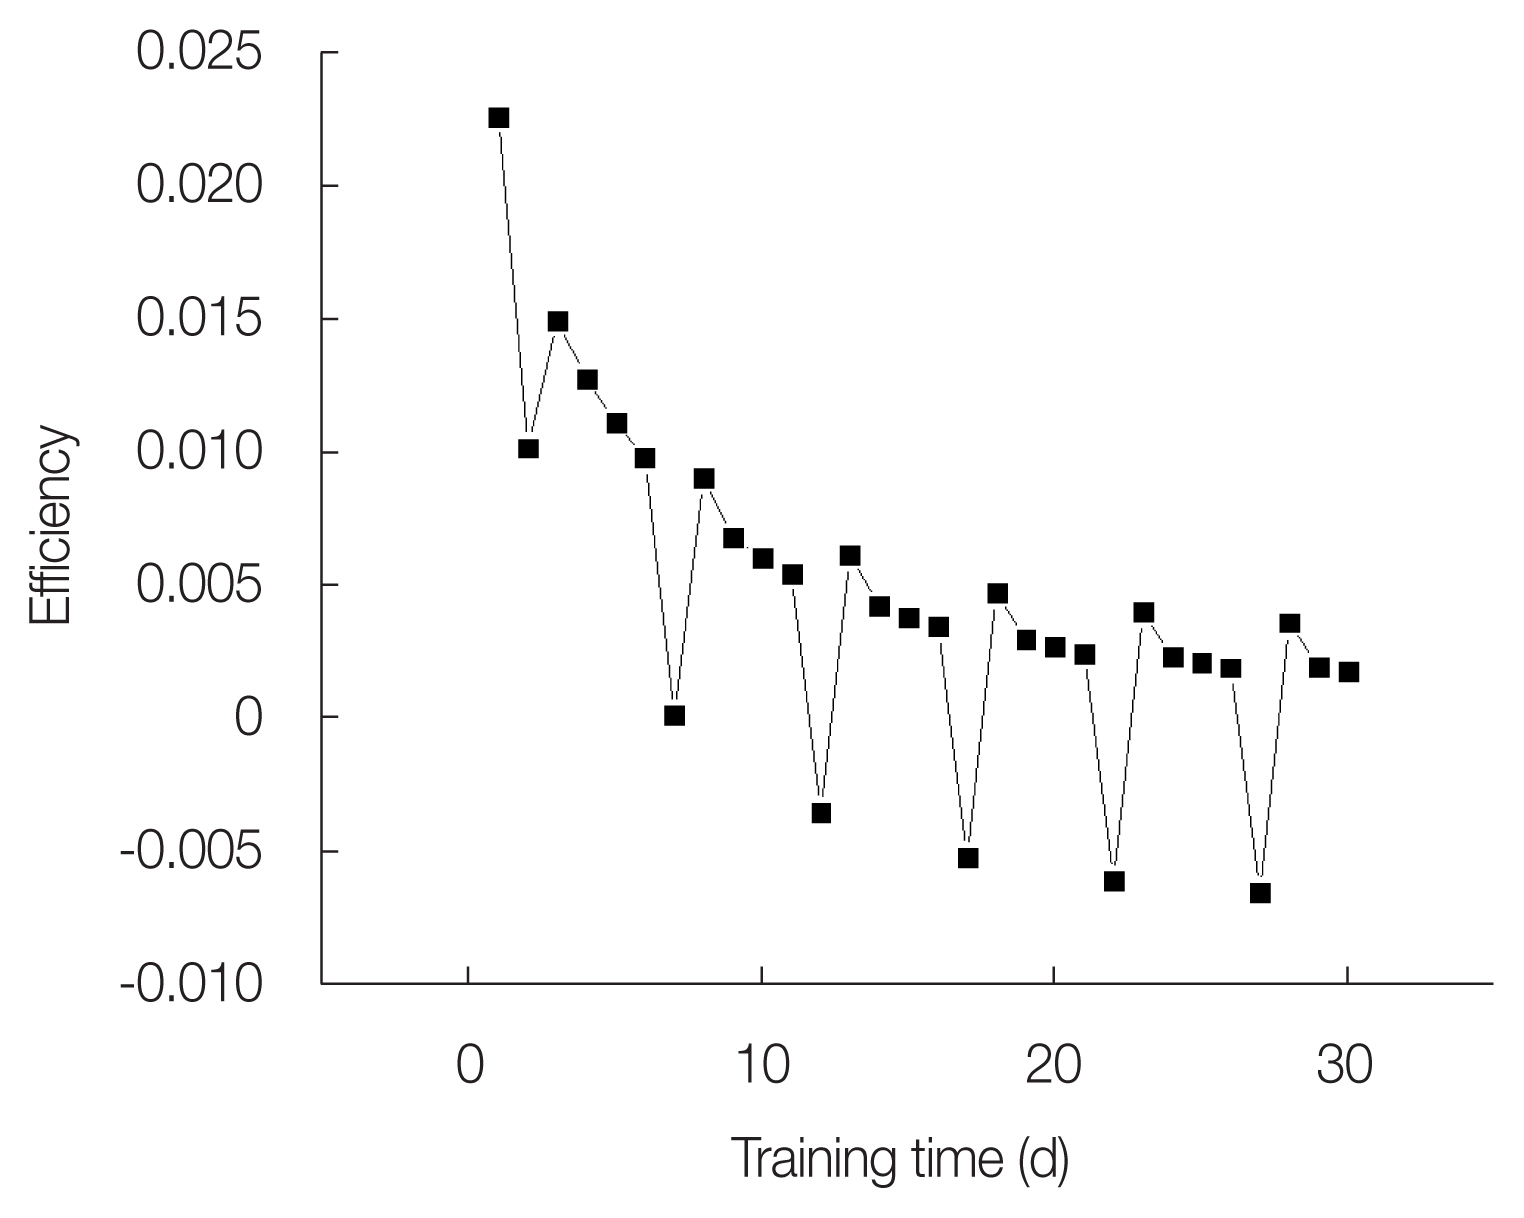
The change in the accumulated number of work units after training showed a significant increase in performance when training was performed in advance, as shown in Fig. 6. In 5 days, the accumulated number of work units for the same amount of time increased by about 6%, from 30.2 units to 32.1 units. As the number of training days increased, the accumulated work-unit value continued to increase; however, the increase became smaller over time. For a detailed analysis, the efficiency according to the number of training days was analyzed, as shown in Fig. 7. The training efficiency was considered as the gradient (dxi/dtxi) between the numbers of the two nearest work units.
Fig. 7 shows that the efficiency of the training tends to decrease over time, compared to the first few days. A sharp decrease in efficiency is shown in some sections. This is because a weekend is included in the 16-day work process; hence, the efficiency decreases, owing to the forgetting effect. If the work start date is Monday, an additional weekend is added, and the work is performed with decreased efficiency on the last day. Therefore, it may be more efficient to do the actual work earlier than this date.
By using the derived LFCM and the dose assessment results, it is possible to calculate the change of collective dose corrected by learning according to the number of training days, where the individual dose is kept lower than the annual dose limit, as shown in Equation (8). For the analysis, the doses of the basic-trained workers, workers with an additional 5-day training, and skilled workers were compared, as shown in Table 3.
Comparing the working time between skilled workers and basic-trained workers shows a 16.9% difference. Therefore, it is desirable for skilled workers to perform tasks in terms of speed and safety and due to the nature of the decommissioning environment. In addition, it is necessary to analyze whether it is good for workers to receive training. Based on the difference in working time, it is possible to optimize the conditions, according to ALARA, in consideration of the radiological, social, and economic gains and losses from the collective dose and training.
Conclusion
In this study, work times and collective doses were calculated by correcting the LFCM in the decommissioning of a nuclear facility. The LFCM was analyzed, and input values and scenarios were analyzed for substitution into the D&D process of a nuclear facility. Based on the analyzed scenario, the efficiency change of the worker according to the work days was analyzed, and the change in the work time, according to the training days, was also calculated. Finally, the change in total working time and collective dose, according to the learning, were calculated with correction by the LFCM for the dose assessment for the concrete D&D work at the nuclear facility.
By using these research methods and models, it was possible to calculate the change in the efficiency of workers performing new tasks in the D&D process and the corresponding reduction in the work time and collective dose. In the case of the assumptions used here, the index and parameter mainly used in general industries were used. Since the D&D process in NPP is performed in a limited space, there may be differences in the learning process and index setting performed in previous studies. As related research progresses, correction by the LFCM can be used as a tool to optimize work according to the ALARA principle by applying the efficiency and safety evaluation based on the learning model to the worker dose evaluation. In addition to the mock-up training, quantitative analysis of how the efficiency of real workers changes through cognitive learning, such as training using virtual reality, can be performed, and it can be used to analyze the effect of new technology introduction.