Introduction
X-ray imaging systems have been adopted in many fields, including medicine, industry, and security, thanks to their ability to scan the internal structure of objects, providing a handy tool for users to understand the internal structure of an object. An X-ray imaging system should therefore be able to output high-quality images, so any factors that may undermine the quality must be removed from the system at the design stage. Among the many factors that can affect image quality, X-ray scattering is a strong external factor generated from inside the object (i.e., the structure of the system being imaged, building walls, etc.) that may directly affect the signal-to-noise ratio (SNR), which is related to image quality [1, 2]. Some of the ways to minimize the effects of scattered X-rays on the system include maintaining a regular distance between the object and detector, projecting X-rays in a fan-beam style using slits or slots, and applying an anti-scatter grid [3, 4]. Among these methods, installation of an anti-scatter grid is most commonly used to reduce the influence of scattered radiation, and grids can be designed to accommodate the geometric characteristics of the imaging system and the energy level of the projected X-ray [5, 6]. While extensive research has been conducted on the installation of anti-scatter grids in the medical radiation sector, their applications and evaluation of their performance in nonmedical nondestructive X-ray inspection systems have hardly received any attention in other industries, including safety-and security-related industries. This has led to a lack of quantitative information on how to include anti-scatter grid design in the initial imaging system design process. In particular, the internal inspection of large containers that are sensitive to safety and security tends to use X-rays of several MeV, unlike general X-ray nondestructive inspection methods, and this contributes to the creation of scattered radiation from various directions, depending on the internal structure of the container [7]. X-ray scattering can be reduced by using anti-scatter grids, and the design of the grid should be incorporated into the overall design process of X-ray image detectors for container inspection. The grid ratio of an anti-scatter grid should be determined according to the scatter-to-primary ratio (SPR), which is defined as the ratio of scattered X-rays to primary X-rays that penetrate the object and reach the detector pixels, and variation in the SNR. This study adopted the Monte Carlo method to calculate the SPR for varying grid ratios and materials, as well as the SNR improvement factor (KSNR) of 6- and 9-MVp spectrum sources, which are common in fixed container inspection systems.
Materials and Methods
1. Anti-scatter grid
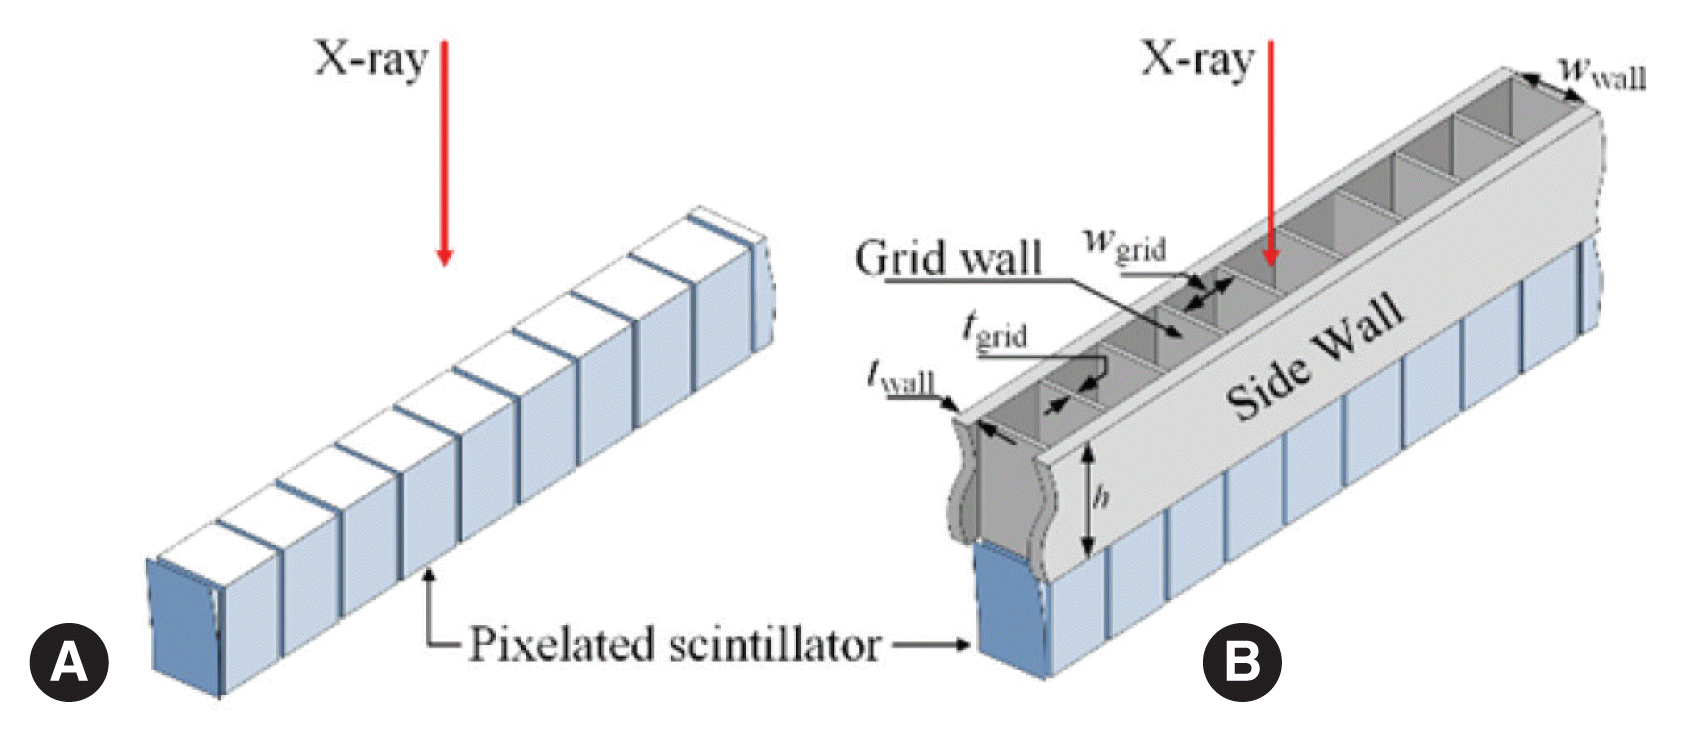
Grid walls were arrayed in a pixelated structure on the detector surface, as illustrated in Figure 1. The grid materials were composed of high-density matter, such as iron, lead, and tungsten, to prevent the movement of scattered X-rays. The effectiveness of a grid at removing scattered X-rays was determined by the ratio of the grid height (h) to the width (w) of the incident surface of the X-ray, excluding the walls. This is referred to as the grid ratio (R), and can be obtained from the equation shown below [8]:
2. Scatter-to-primary ratio (SPR)
The SPR of the signals collected by the detector was calculated in order to quantitatively evaluate the impact of the anti-scatter grid on the images produced by the cargo container scanner system. The images included information on scattered and primary X-rays generated between the X-ray source and the detector, and the SPR was defined as the energy of the scattered radiation divided by that of the primary beam on the imaging device. The SPR can be calculated according to the following equation [3]:
where Is and Ip represent scattered and primary radiation on the imaging device, respectively.
3. Signal-to-noise ratio (SNR) and the SNR improvement factor (KSNR)
Scattered radiation is a factor that increases noise and reduces the SNR in the X-ray imaging system, implying that an anti-scatter grid may affect the ratio. The relative SNR with and without an anti-scatter grid reflects how the SNR changes with and without the grid, and this is referred to as the KSNR [8]:
where SNRg and SNRng represent the SNR with and without an anti-scatter grid, respectively. The ratio can also be calculated using the scatter degradation factor (SDF) and the primary radiation contrast (Cp) as below [8]:
where Ibkg is the size of the signal that would be measured if the object did not exist.
4. Monte Carlo simulation of scattered X-rays
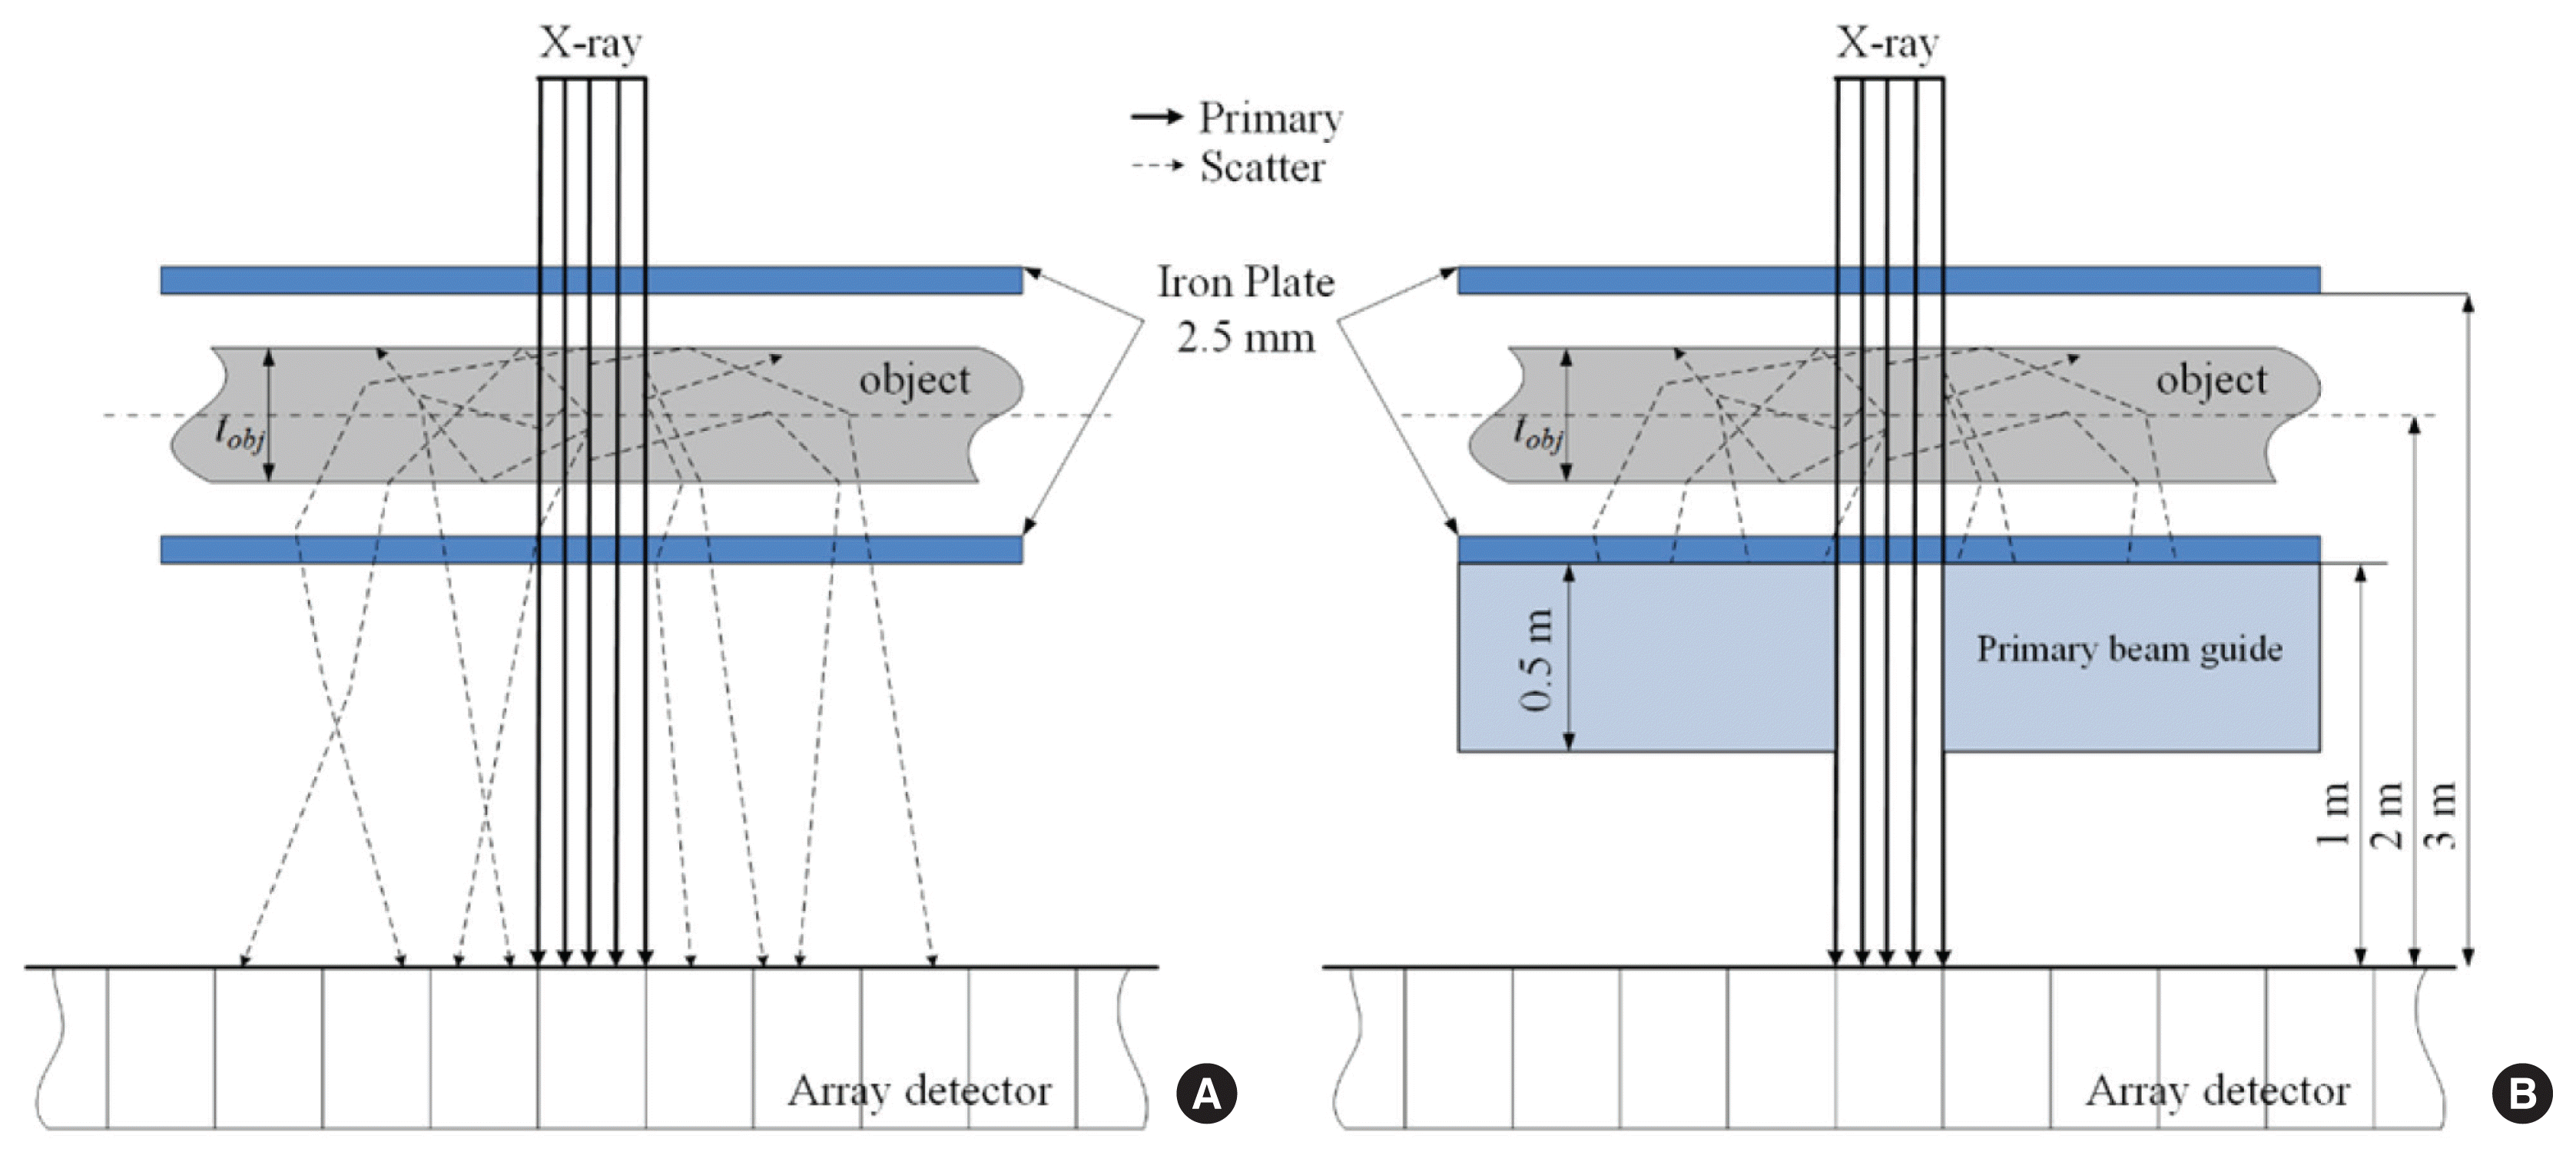
This study used the Monte Carlo radiation-transport software MCNP6 (Version 1.0; RSCC, Oak Ridge, TN, USA) to simulate the overall process of the generation, movement, and collection of X-rays from the X-ray image detection system. X-ray spectra were generated by the interaction of 6- and 9-MVp multi-energy electrons and a 3-mm-thick tungsten target using the software in a vacuum environment. The generated X-ray spectra at 6 MVp and 9 MVp are illustrated in Figure 2. As seen in the graphs, the photons of the generated X-rays were mostly distributed between 0 and 1 MeV, while the number of photons declined as the energy level increased. The X-ray detector of the computer simulation model used in this study was created by arraying 4×4.6 mm2 pixels in a 1×201 linear structure, similar to that of a linear array X-ray detector used for container inspection. Additionally, anti-scatter grids composed of high-density metals (iron, lead, or tungsten) were placed in front of the detector, as illustrated in Figure 3. Figure 3A demonstrates the X-ray detector model without an anti-scatter grid, while Figure 3B shows a model with an anti-scatter grid. The grid ratio was set at 2.5, 12.5, 25, or 37.5 (h=10, 50, 100, and 150 mm) for this study.
Figure 4 presents diagrams of the Monte Carlo simulation models. The simulation models were designed with a structure in which a 2.5-mm-thick iron plate, similar to what cargo containers have, was installed on both sides of the 100×100×thickness (tobj)-cm3 rectangular aluminum object to generate scattered X-rays. The thicknesses were 100, 200, and 500 mm. The distance between the object center and the detector surface was set at 2,000 mm, simulating the distance between a container and a detector. The X-ray source model for the simulation was designed with an area equal to the pixel size (4×4.6 mm2) in order to classify the signals that reached pixels other than target pixels located at right angles to the direction of the movement of the primary X-rays as the impact of scattered X-rays.
Diagram in Figure 4 indicates the generation and transfer of scattered X-rays in the simulation results. Scattered X-rays are generated from the object when the primary X-rays enter the object and move to the detector surface, and are either absorbed from the object or bounce away. During this process, some of the scattered X-rays that bounce off of the object enter the detector surface together with the primary X-rays that have penetrated the object. The X-rays that enter into the detector are collected by X-ray transformers, such as scintillators or semiconductors, but those methods go beyond the scope of this study. Information about the photons that reached each pixel surface of the detector in the simulation was collected to calculate the SPR. The *F1 tally, a type of MCNP tally and an indicator of the accumulated energy of photons on a certain surface, was used for this. However, the model shown in Figure 4A contains information on both the primary and scattered X-rays, so the signals for each type of X-ray should be separated in order to calculate the SPR. For this reason, the simulation model in Figure 4B was created to remove scattered X-rays from between the iron plate and the detector surface to eliminate the influence of scattered X-rays on the data collected from the model shown in Figure 4A. To exclude the scattered X-rays from the data, a rectangular space with a volume of 1,000×1,000×500 mm3 was installed, extending from 500 mm above the detector surface to the bottom of the iron plate or 1,000 mm above from the detector surface, and the movement of photons was restricted within this space. The IMP card, which is used as a variance reduction technique, was set at 0. The surface where primary X-rays were projected was not included in the rectangular space, so that as many primary X-rays could reach the detector surface as possible.
Results and Discussion
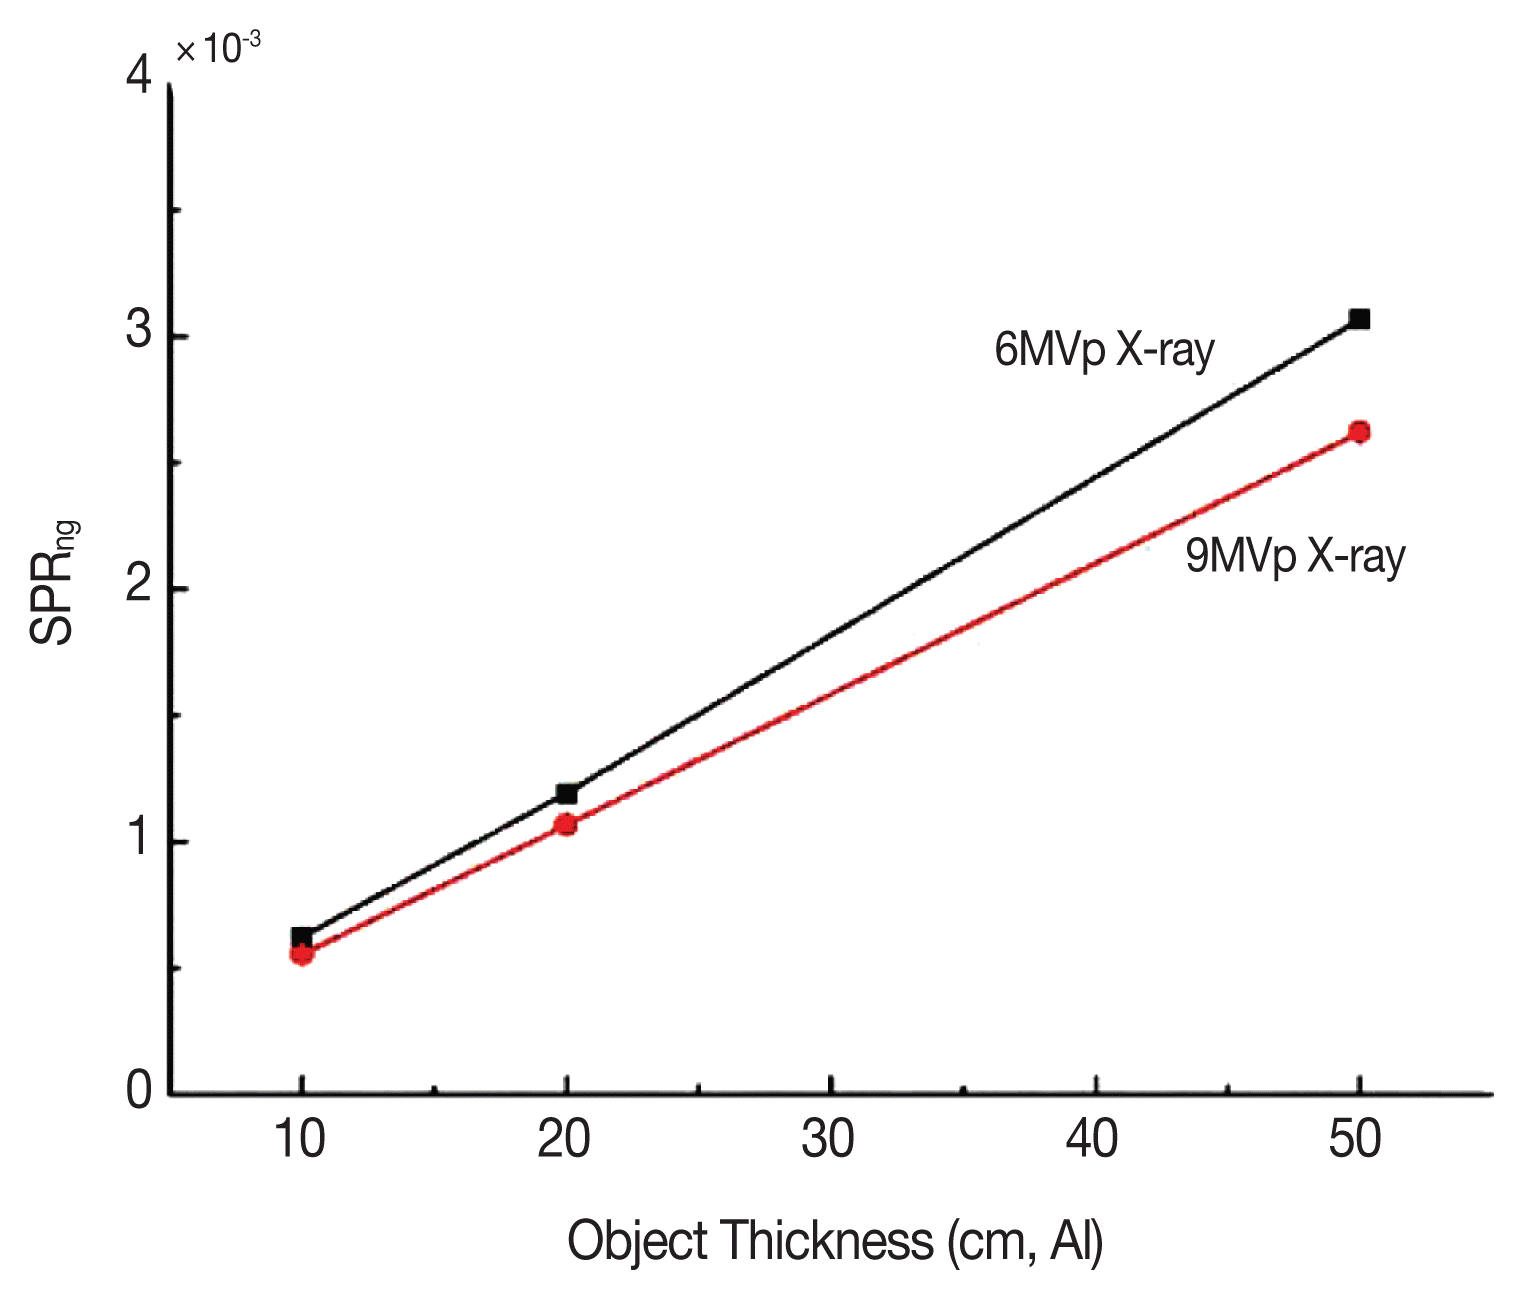
Figure 5 shows that the SPR remained proportional to the object thickness without an anti-scatter grid. SPRng demonstrates the values obtained without an anti-scatter grid. As seen in this graph, SPR increased linearly with the thickness of the object. The linear relationship between object thickness and the SPR is the result of increasing scattered radiation, as well as of the increased number of photons that interact with the object as the object gets thicker. In other words, more scattered X-rays are generated, while fewer primary X-rays end up reaching the detector after penetrating the object, thus increasing the SPR linearly with the object thickness.
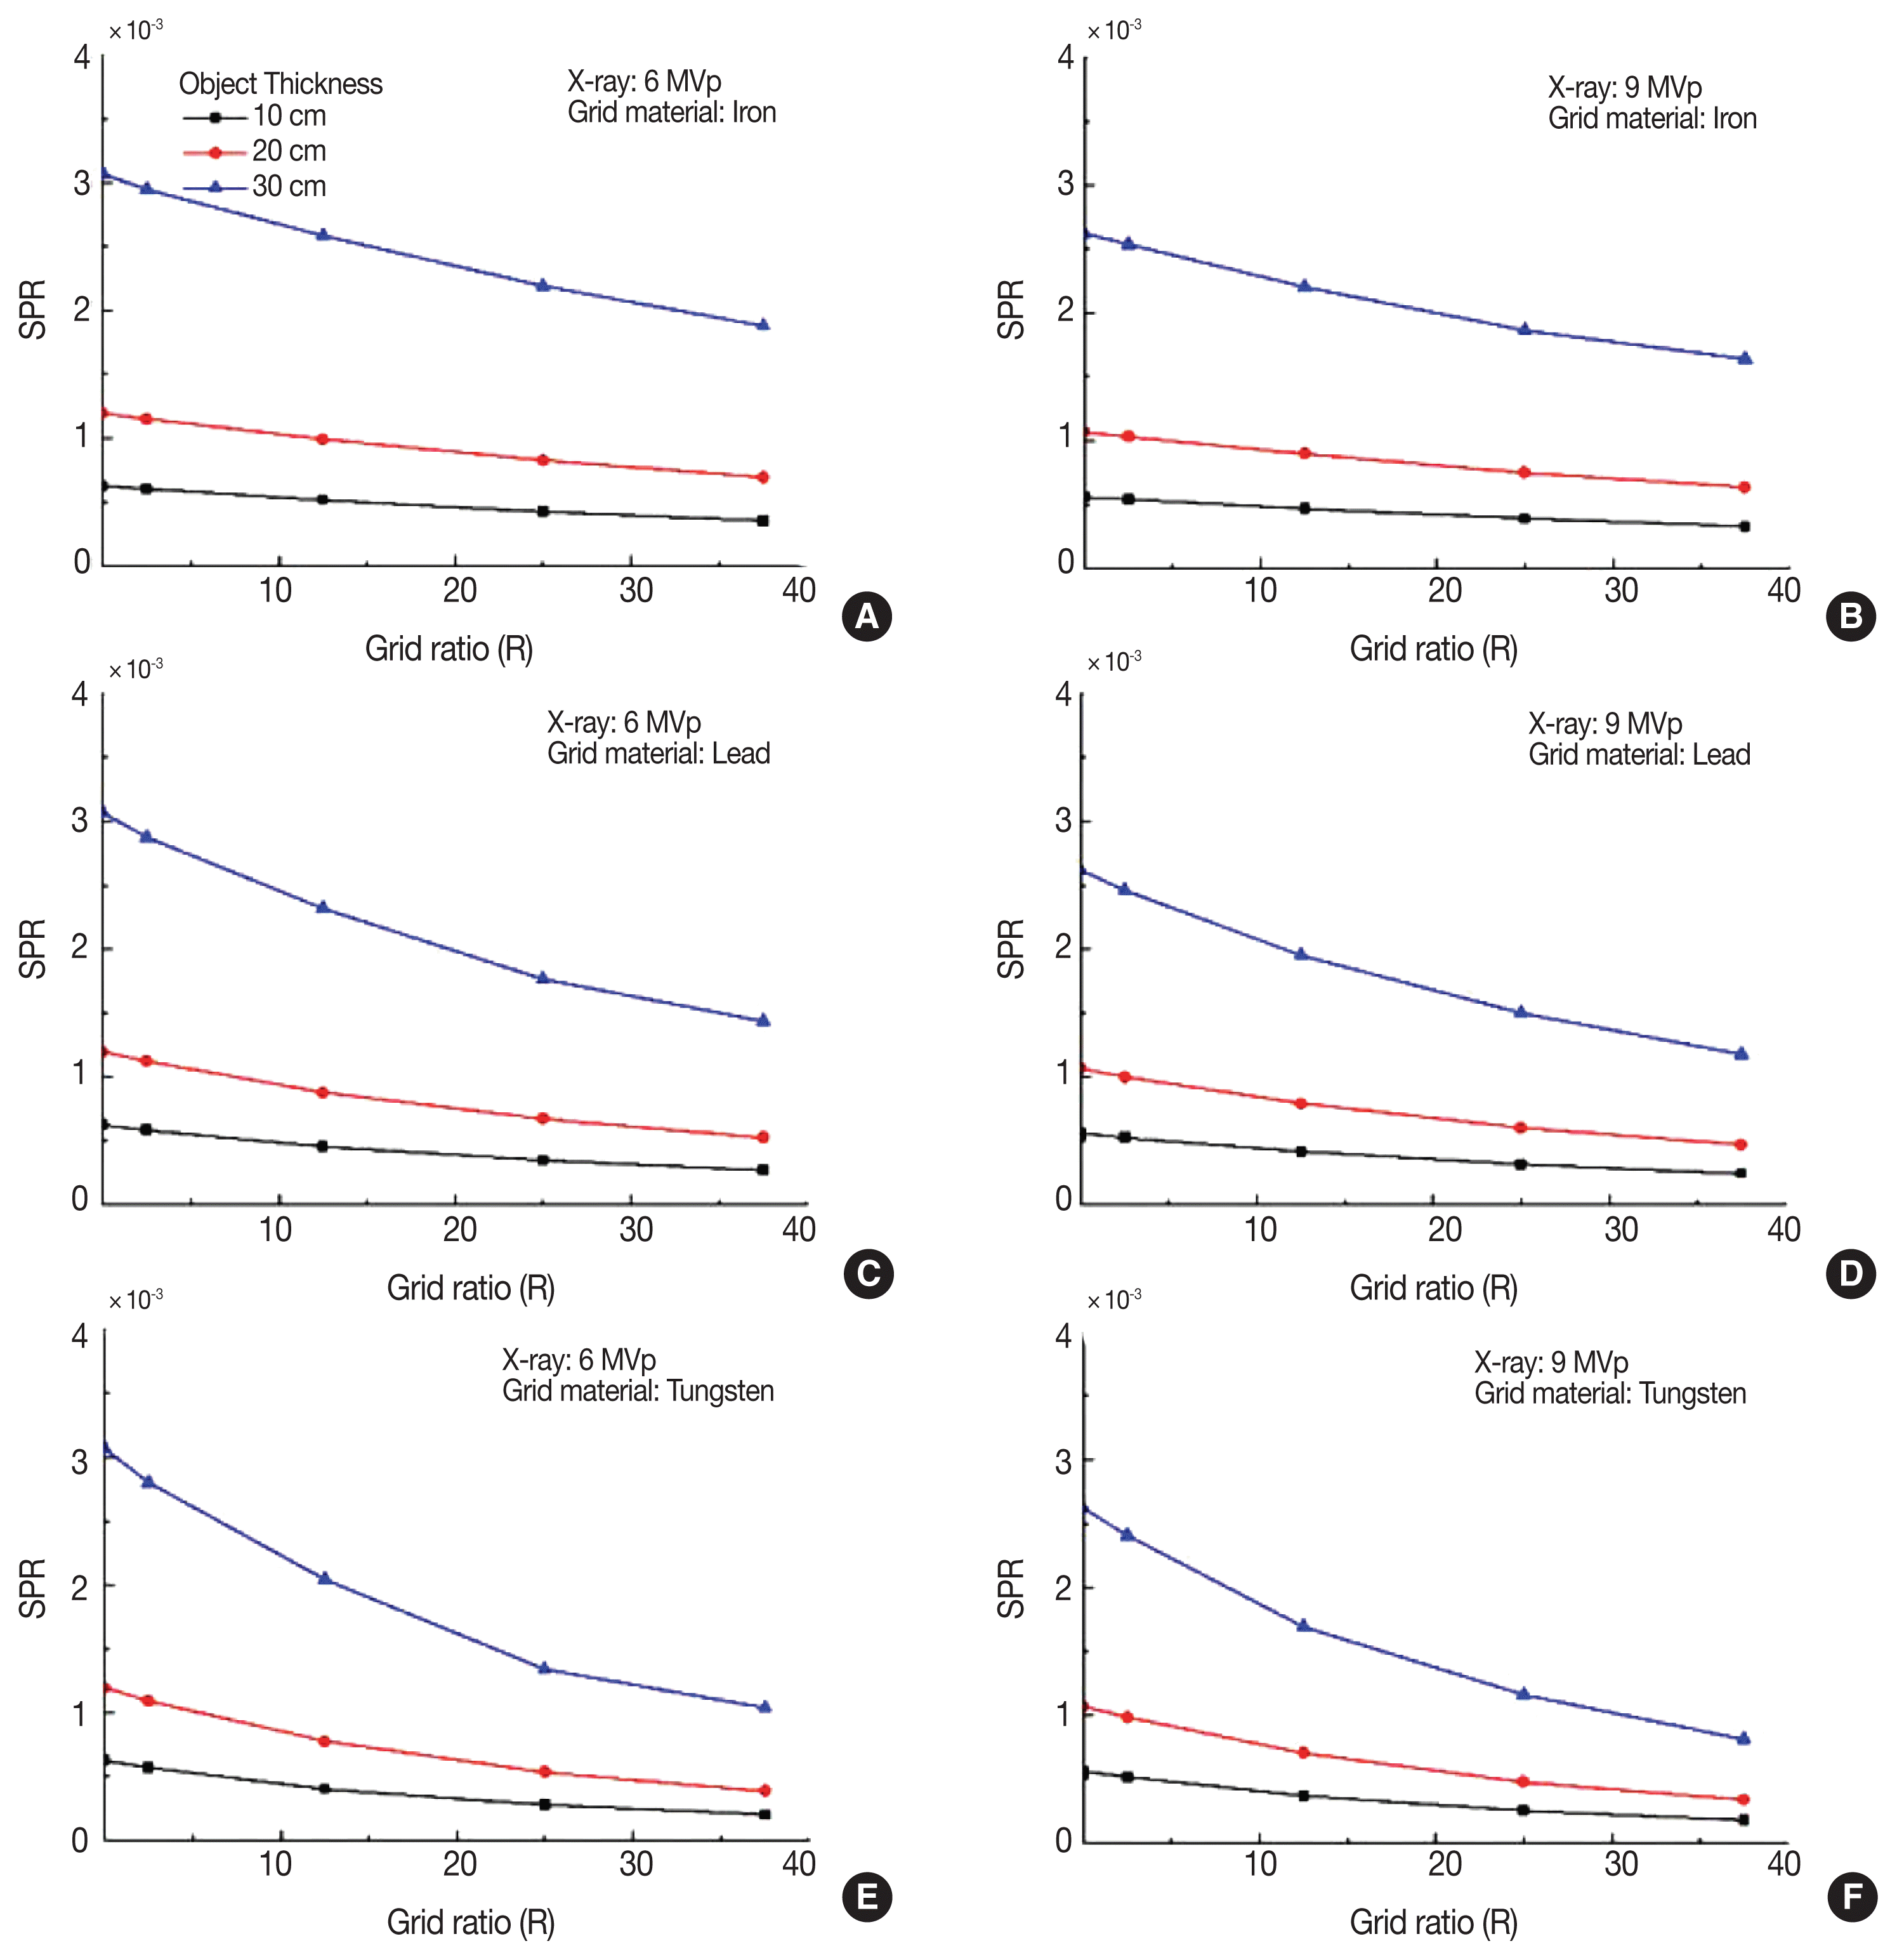
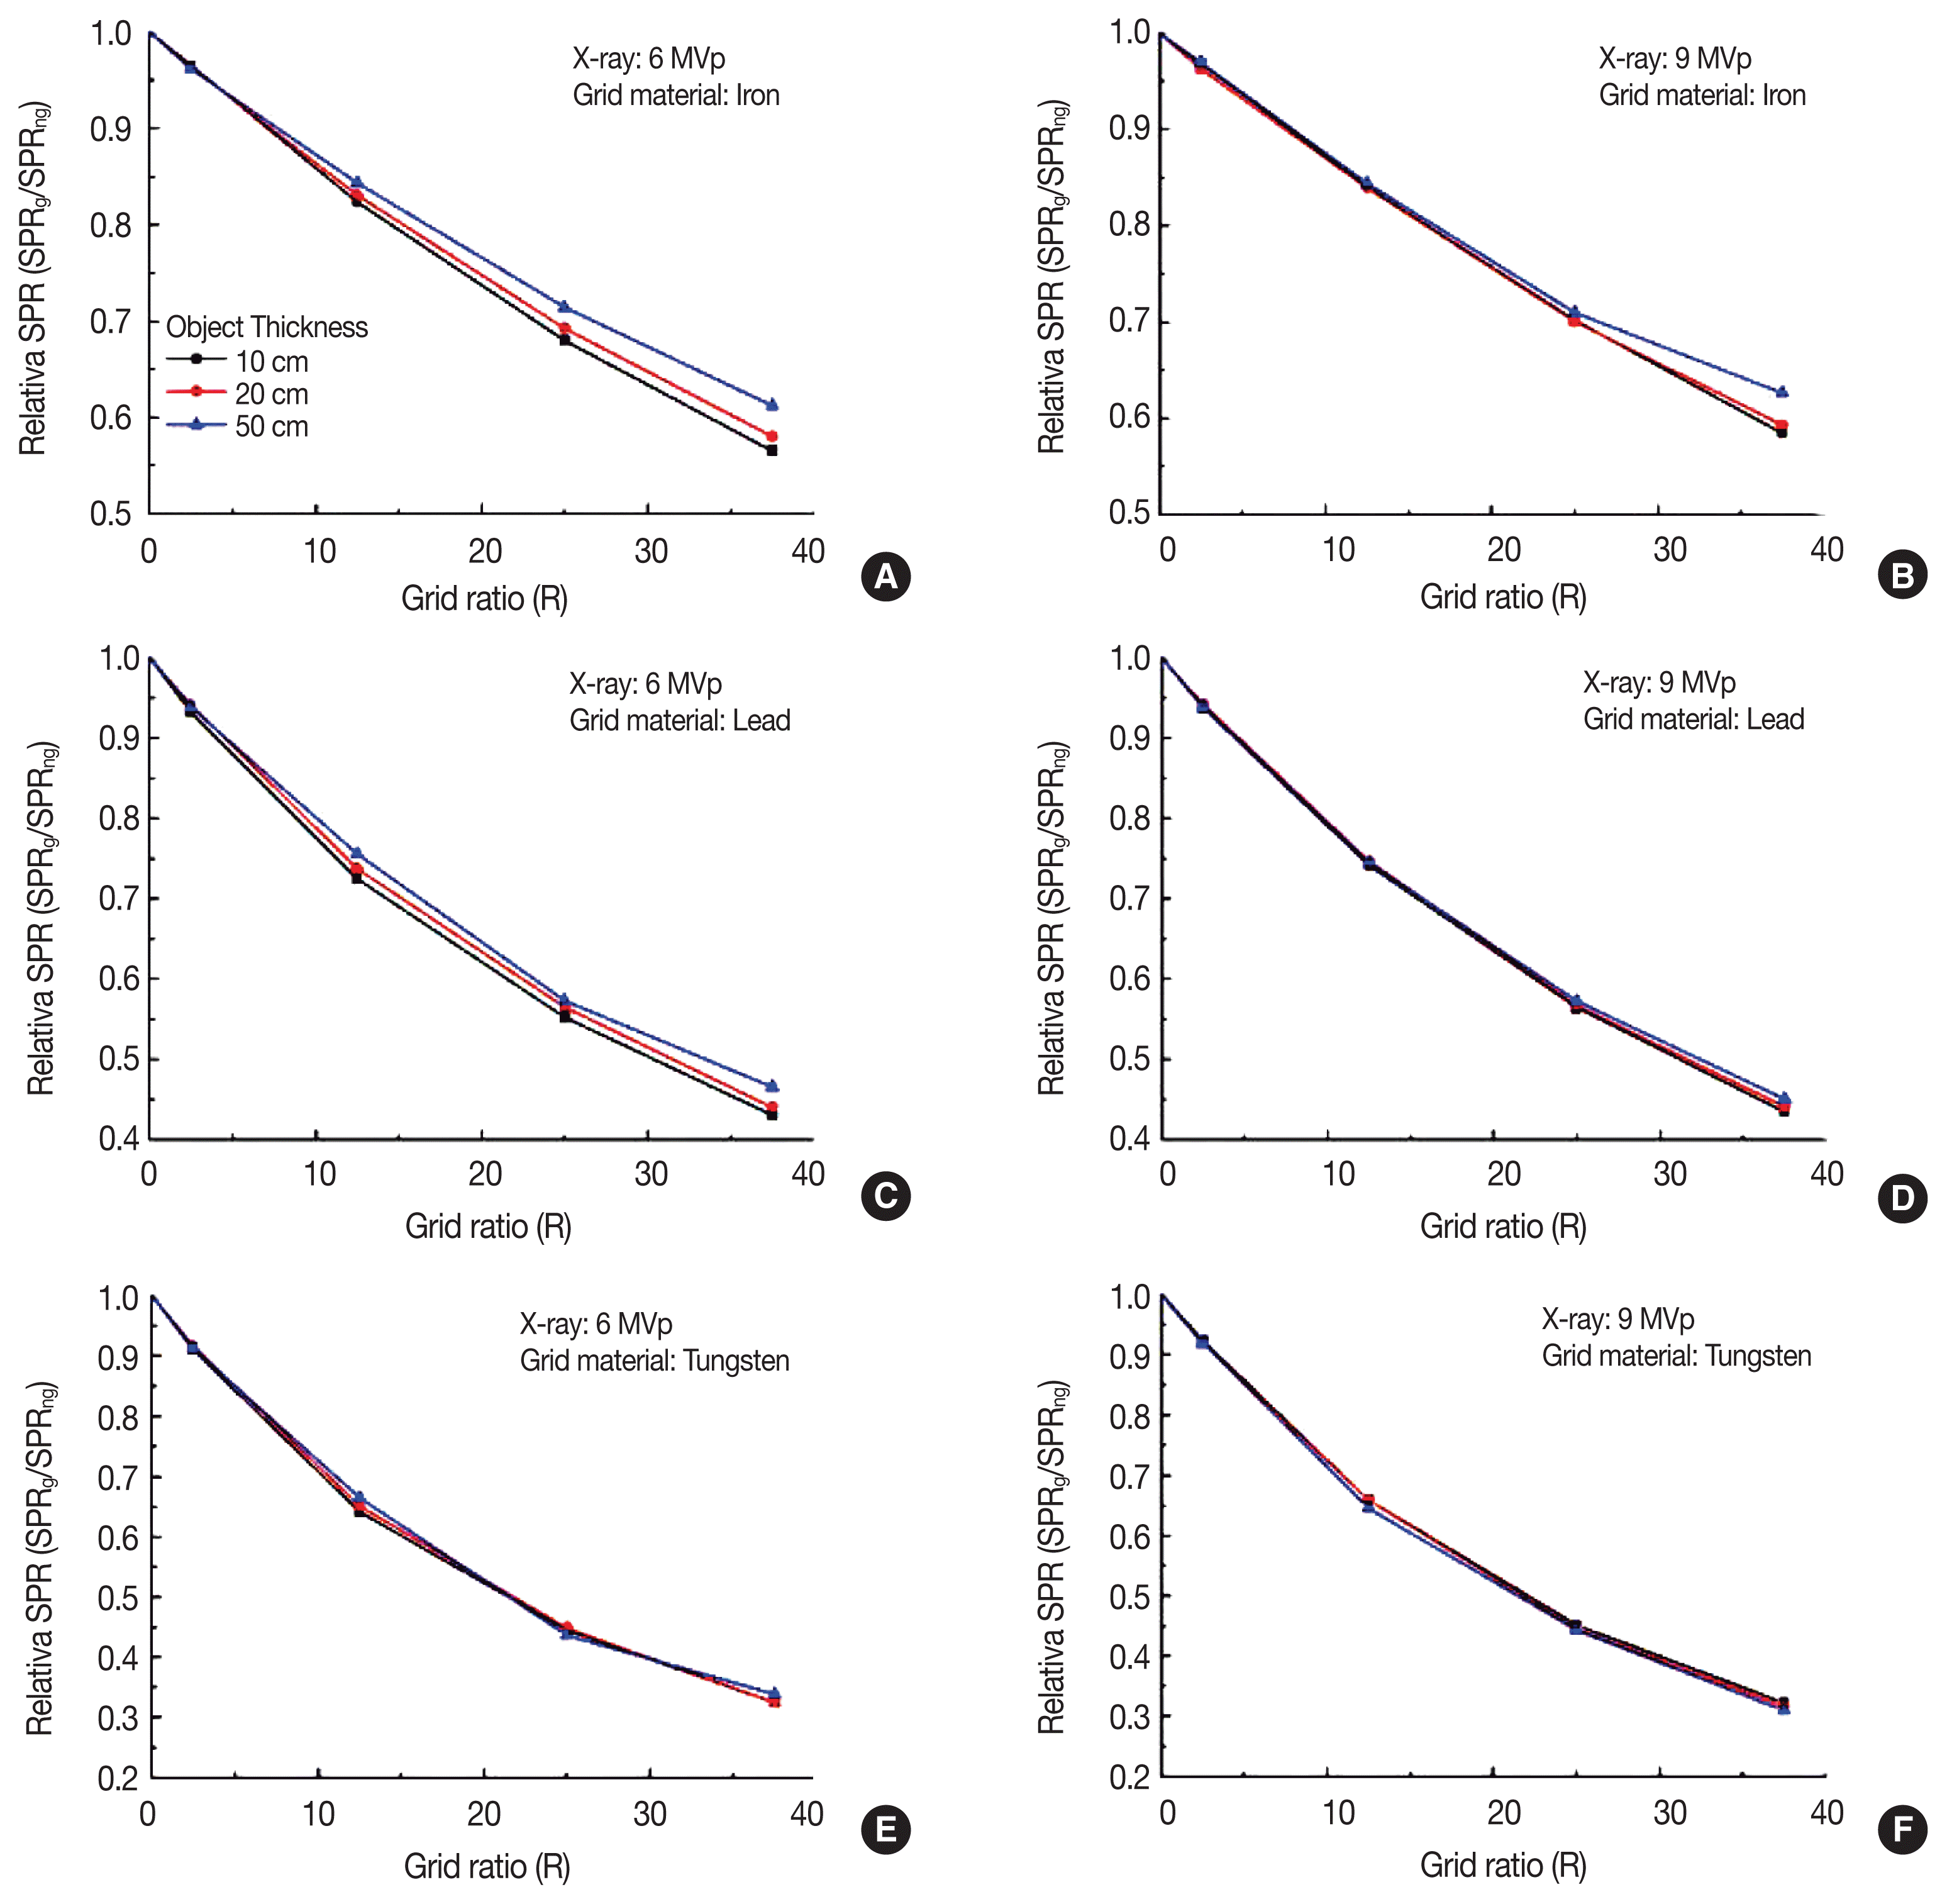
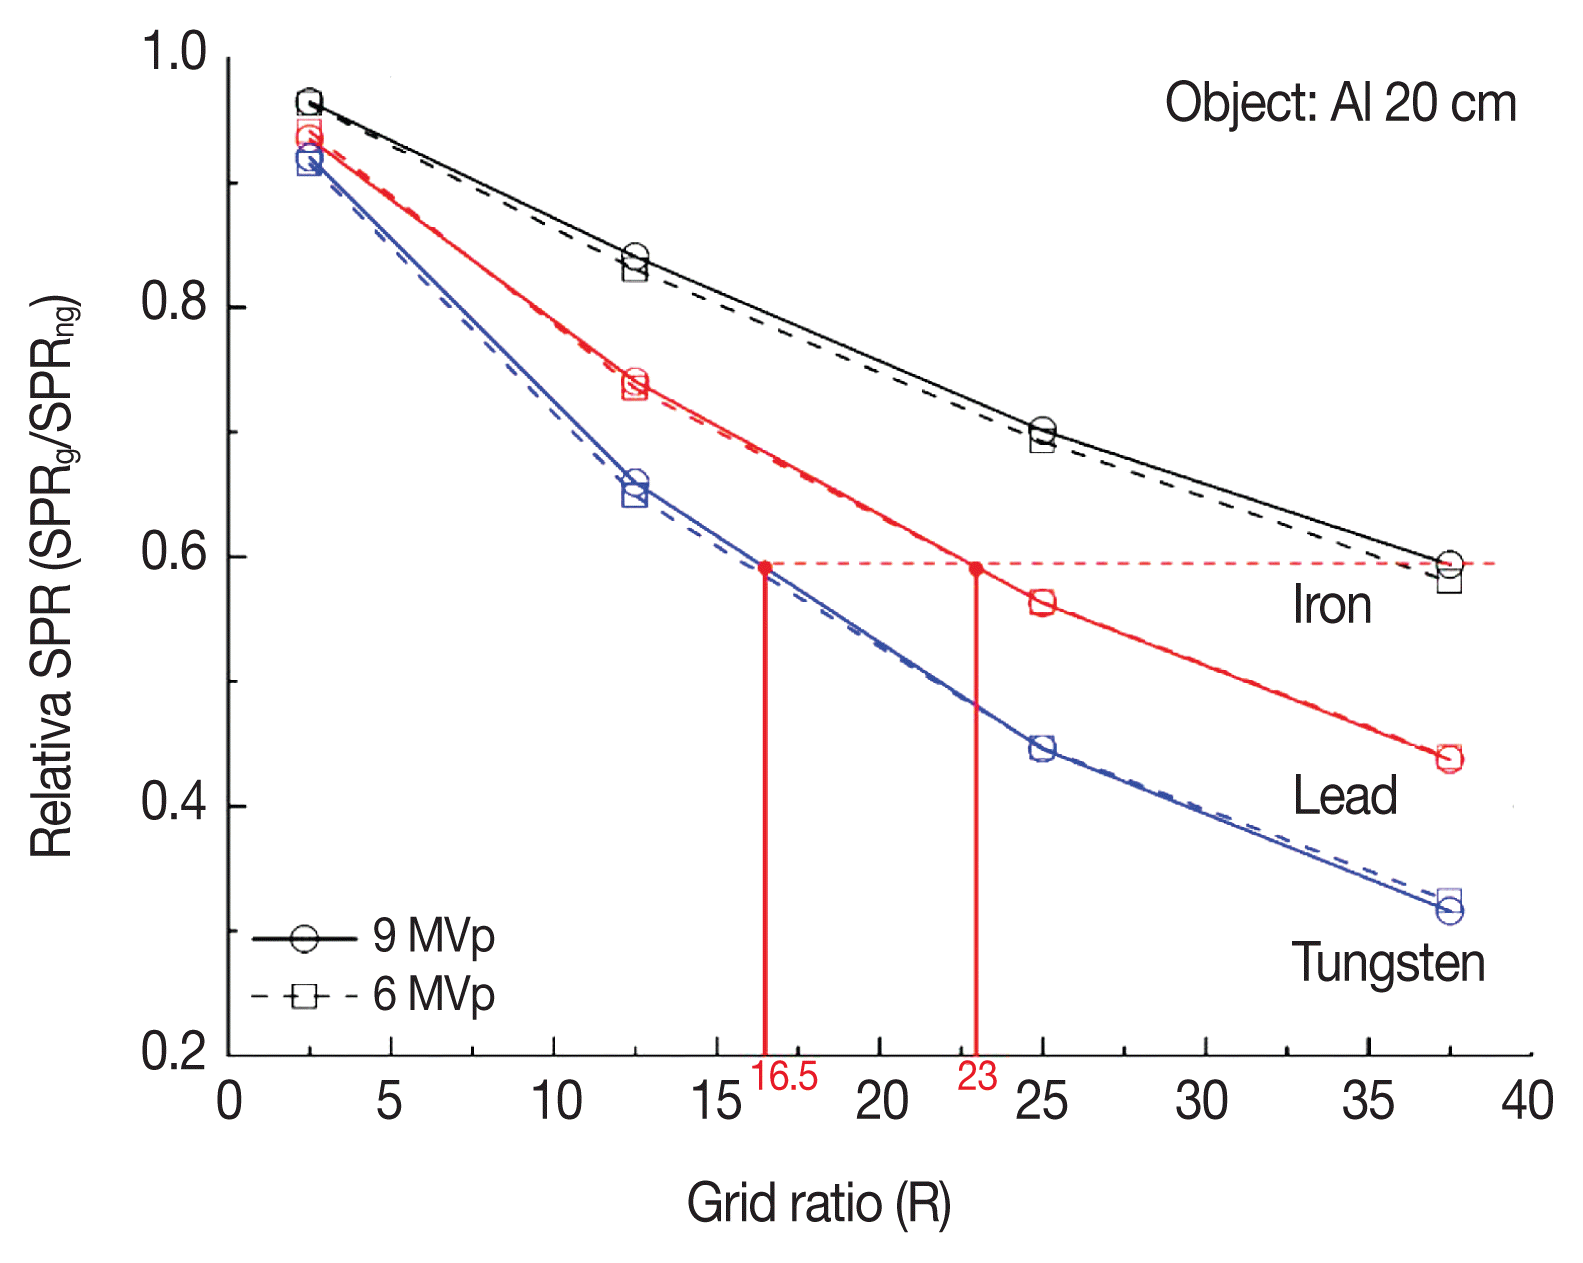
Moreover, the 6-MVp X-rays demonstrated a 5.5% higher rate of increase than the 9-MVp X-rays. This is because the latter are less likely to interact with the object than the former. The graphs in Figure 6 shows changing curves of the SPR by objects with thicknesses of 10 to 50 cm with varying grid ratios. Graphs of Figure 6A, 6C, and 6E present the paths of 6-MVp X-rays in grids made of iron, lead, and tungsten, respectively, while Figure 6B, 6D, and 6F represent 9-MVp X-rays in the same grid materials. These findings suggest that the SPR was inversely related to the grid ratio, and was higher when the grid was made of iron, followed by lead and tungsten. The curves in Figure 7 are relative SPRs plotted against the grid ratio by varying thickness and grid material. As in Figure 6A, 6C, and 6E are the paths of 6-MVp X-ray spectrum sources with grid materials of iron, lead, and tungsten, while Figure 6B, 6D, and 6F represent 9-MVp X-rays with the corresponding grid materials. These graphs imply that the relative SPR decreased as the grid ratio increased. The decrease rate of the relative SPR varied according to the grid material, decreasing to almost 30% for 6-MVp X-rays with a 47.5 grid ratio. This was a larger rate than was found with the iron and lead materials, with minima of 58% and 45%, respectively, implying that grids made of tungsten require a smaller size to provide relatively higher scatter rejection effects. Therefore, anti-scatter grids are considered to have better X-ray rejection effects through limiting scattered X-rays with larger incidence angles. Anti-scatter grids for high-energy X-ray imaging devices should be composed of high-density materials in order to minimize the degree to which scattered radiation penetrates and reaches the detector. As seen in Figure 8, the SPR with a grid ratio of 37.5 (grid height, 15 cm) for an iron grid was 0.6, while for lead and tungsten grids, the same relative SPR could only be found with a grid ratio of 23 (grid height, 9.2 cm) and 16.5 (grid height, 6.6 cm), respectively. This suggests that tungsten and lead grids can provide scatter rejection effects similar to iron grids that are 44% and 61% of the size. This also has to do with the fact that iron is 41% and 69% as dense as tungsten and lead, respectively, as well as with the possible impacts of secondary scattered X-rays and characteristic X-rays generated from scattered X-rays in each grid material. Despite such variation in the SPR, Figure 6 implies that the impact of grid ratio and materials was negligible, as scattered X-rays were generated in a proportion of less than 1% compared to primary X-rays. Considering this, the impact of scattering reduction by installing an anti-scatter grid is minor for X-ray imaging systems for container inspection.
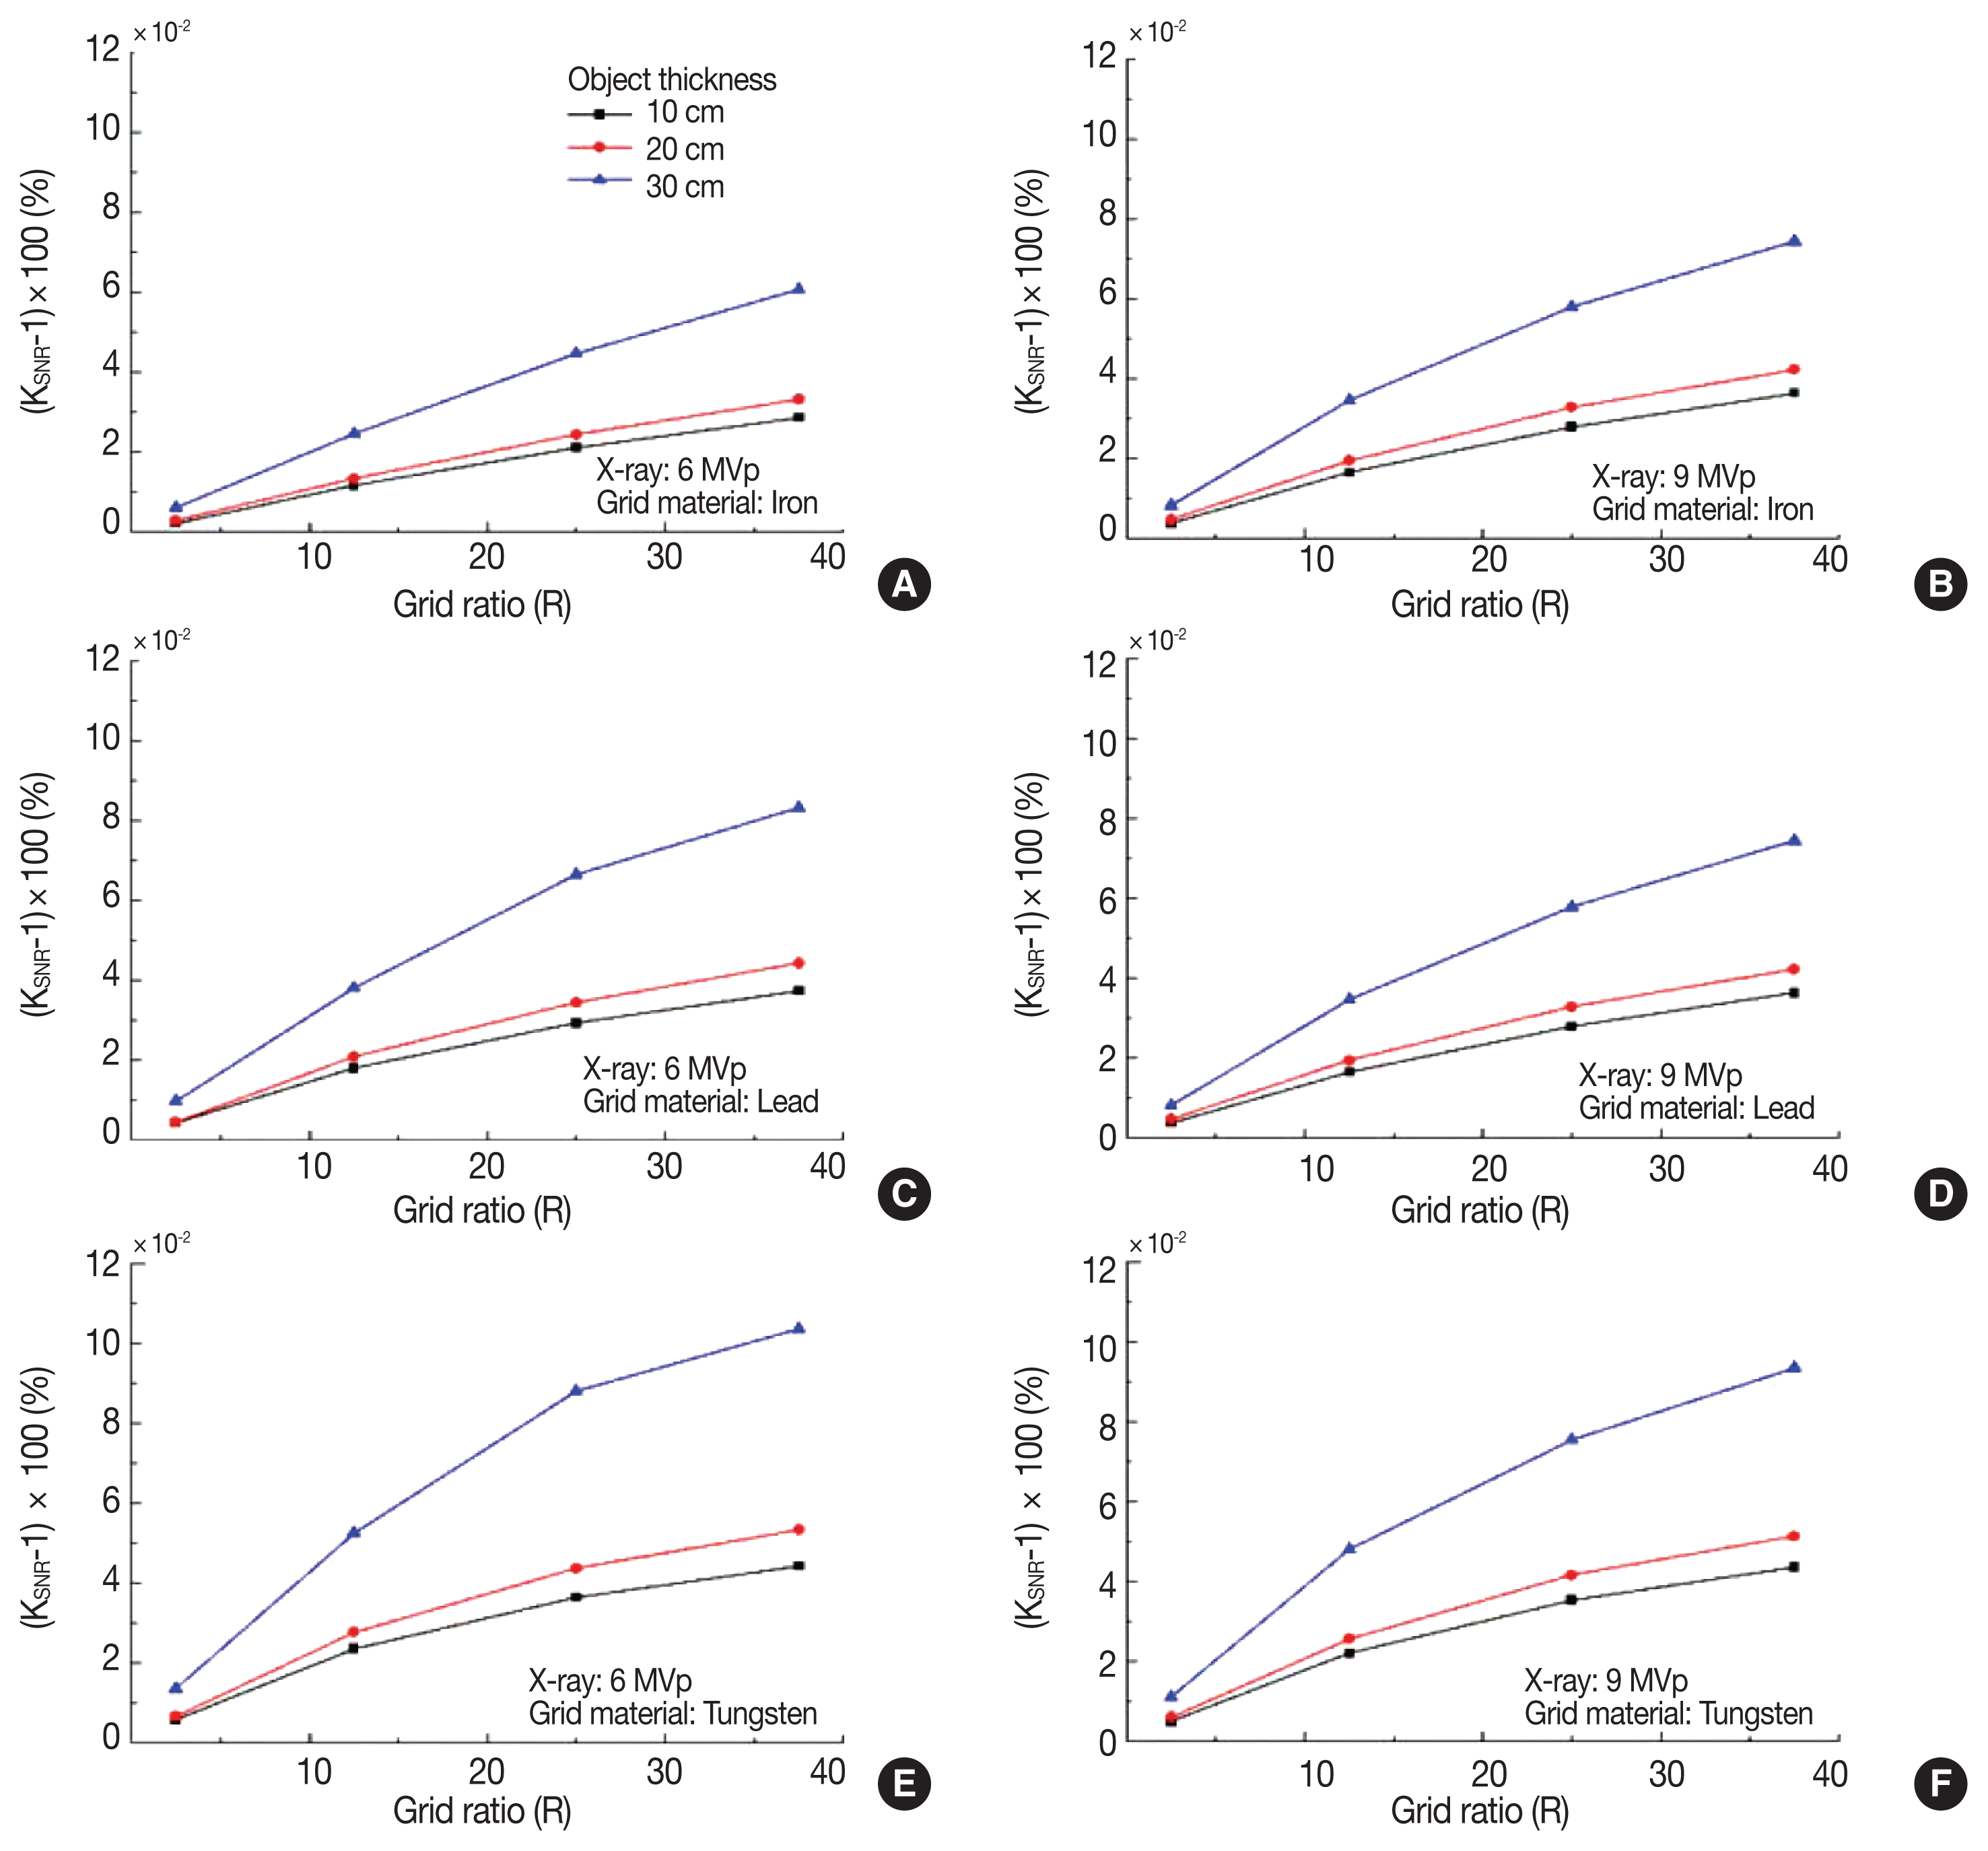
Figure 9 features KSNR curves plotted against the grid ratio for each material. Graphs Figure 9A, 9C, and 9E show the 6-MVp X-ray spectrum source, with grids made of iron, lead, and tungsten, while Figure 9B, 9D, and 9F show the 9-MVp X-ray curves with the corresponding materials. As seen in the diagrams, increasing the grid ratio influenced the KSNR. Tungsten had the highest increase rate among the materials, while the lowest rate was seen in iron. The KSNR was proportional to the grid ratio and density of the material, as was the case with the SPR. This may be due to fact that the KSNR was affected by the scattered X-ray ratio, as reflected in equations (4) and (5). Meanwhile, it can be concluded that the detector model used in this study had a total change in the KSNR of less than 0.1%, indicating that the anti-scatter grid made little difference.
There are significantly fewer scattered X-rays than primary X-rays, since the X-ray imaging systems of container scanner inspection devices have a detector positioned several meters from the object and utilize a linear array detector, which significantly diminishes the chance of scattered X-rays reaching the detector surface. Therefore, for container inspection X-ray imaging systems, the influence of scattered X-rays is considerably lower than in a detector system in which the distance between the detector and the object is smaller or in 2-dimensional systems. In conclusion, installation of anti-scatter grids in cargo container inspection imaging systems will contribute little to the improvement of image quality.
Conclusion
This study investigated the impact of anti-scatter grids on the SPR and of changes in the composition of the grid on the SNR in container scanner imaging systems. As explained in the paragraph above, the SPR of the signals measured by the detector was dependent on the presence of an anti-scatter grid and proportional to the density of the materials comprising the grid. The decrease rate of the SPR caused by the anti-scatter grid was consistent, regardless of the initial ratio of scattered X-rays. However, it was impossible to derive an optimal grid ratio within the ratios set up for this study, and the highest ratio was found for a 150-mm grid. The optimal grid size is presumably between 200 mm and 300 mm when the grid is composed of tungsten, given the information from the SPR and the KSNR transformation curves. Applying such a thick grid may unnecessarily lead to a bulky system and increase the cost, while the installation of an anti-scatter grid seems to have negligible effects for container scanners, especially since the amount of scattered X-rays remains extremely minor compared to the quantity of primary X-rays, as shown in Figures 6 and 8. In conclusion, although we were able to confirm that an anti-scatter grid and grid ratio variation certainly had an impact on the amount of scattered radiation that reached the detector and that scattered X-rays remained proportional to the SNR, it was also true that anti-scatter grids were found to play a relatively trivial role in container scanners. However, this does not justify any devaluation of the benefits of installing anti-scatter grids, and it is still best to put an anti-scatter grid in place with an appropriate grid ratio to guarantee higher-quality images.


