Radiation Dose Assessment Model for Terrestrial Flora and Fauna and Its Application to the Environment near Fukushima Accident
Article information
Abstract
Background
To investigate radiological effects on biota, it is necessary to assess radiation dose for flora and fauna living in a terrestrial ecosystem. This paper presents a dynamic model to assess radioactivity concentration and radiation dose of terrestrial flora and fauna after a nuclear accident.
Materials and Methods
Litter, organic soil, mineral soil, trees, wild crops, herbivores, omnivores, and carnivores are considered the major components of a terrestrial ecosystem. The model considers the physicochemical and biological processes of interception, weathering, decomposition of litter, percolation, root uptake, leaching, radioactive decay, and biological loss of animals. The predictive capability of the model was investigated by comparison of its predictions with field data for biota measured in the Fukushima forest area after the Fukushima nuclear accident.
Results and Discussion
The predicted radioactive cesium inventories for trees agreed well with those for evergreens and deciduous trees sampled in the Fukushima area. The predicted temporal radioactivity concentrations for animals were within the range of the measured radioactivity concentrations of deer, wild boars, and black bears. The radiation dose for the animals were, for the whole simulation time, estimated to be much smaller than the lower limit (0.1 mGy·d−1) of the derived consideration reference level given by the International Commission on Radiological Protection for terrestrial flora and fauna. This suggested that the radiation effect of the accident on the biota in the Fukushima forest would be insignificant.
Conclusion
The present dynamic model can be used effectively to investigate the radiological risk to terrestrial ecosystems following a nuclear accident.
Introduction
Assessment of the radiation dose for flora and fauna living in a terrestrial ecosystem contaminated by a nuclear accident is necessary to investigate the radiological effect on biota. The radioactivity concentration of the environmental components such as soil, plants, and animals is prerequisite to assess the radiation dose for flora and biota in a contaminated terrestrial ecosystem. The activity concentration of flora and fauna in a terrestrial ecosystem such as a temperate forest is generally appraised using the transport model of radionuclides in the forest. The diverse dynamic transfer models used to simulate the distribution of radionuclides in a forest system were studied in the International Atomic Energy Agency (IAEA)/BIOMASS project [1]. The models considered the generally accepted physicochemical processes of radionuclides in forests such as interception, weathering, root uptake, translocation, and rain percolation. Recently, Hashimoto et al. [2] successfully simulated the dynamics of radiocesium deposited in the forest in Japan following the Fukushima accident using the RIFE model [3], which was one of the models presented in the IAEA/BIOMASS project.
On the other hand, modeling studies for evaluating the exposure of non-human biota to ionizing radiation have been vitalized since the international recommendations were issued [4, 5]. The models for predicting the radiation dose for terrestrial flora and fauna were comprehensively studied through the exposure scenario test for the wildlife within the Chernobyl exclusion zone in the biota working group of the IAEA/EMRAS project [6]. In addition, a comparison study of various models was conducted for assessing the doses to wild flora and fauna at a radioactive waste disposal site in Australia [7]. The models used in the studies were all based on the equilibrium concentration ratio (CR) model. This model assumes the steady state transfer of radionuclides between components, which can be useful for calculating the absorbed radiation dose of non-human biota for the case of a planned and existing exposure situation. In the case of an emergency exposure situation, a dynamic model is suitable for simulating the radiation dose in the early phase of an accident, when the activity concentration of the environmental components is drastically varied. Recently, the radiation dose for terrestrial mammals and birds in the vicinity of the Fukushima accident was evaluated by the United Nations Scientific Committee on the Effect of Atomic Radiation (UNSCEAR) [8]. In this study, the FASTer model of the European Commission [9], which is a multi-compartment model, was used to calculate the temporal activity concentration in flora from the deposition densities, while the model did not deal with the dynamic transfer of radionuclides to fauna through the food chain.
This study presents a dynamic model to predict the radiation dose to flora and fauna living in a contaminated terrestrial ecosystem due to a nuclear accident. The transfer model of radionuclides in the forest ecosystem was developed by adding a food chain model of animals to the RIFE model [2, 3]. This was subsequently combined with the absorbed dose rate assessment model. The predictive capability of the model was tested through comparison with the measured radioactive cesium inventory of trees and the activity concentration of animals from the Fukushima forest after the Fukushima accident.
Materials and Methods
The present dynamic model consists of two parts. The first is a model to calculate the activity concentration for components consisting of the terrestrial ecosystem contaminated as a result of a nuclear accident, and the second is a model to calculate the radiation dose for the terrestrial flora and fauna using the calculated activity concentration.
1. Transport and Exposure Pathway
Fig. 1 shows the transport pathway of radionuclides in the forest ecosystem and the exposure pathway to fauna considered in the present model. The forest ecosystem consists of nine compartments of litter, organic soil, mineral soil, tree external, tree internal, wild crops, herbivores, omnivores, and carnivores. The physicochemical phenomena that occur between compartments are the decomposition of the litter layer, foliar absorption by the leaves, the litter-fall of tree leaves, the weathering of tree stems, the root uptake of trees from the surface organic soil, the leaching into deep soil, and the percolation from the surface organic soil to deeper mineral soil. The radionuclides dispersed into the atmosphere are partially deposited on the trees and the litter layers. The nuclides deposited upon the litter layer are transported into the organic soil by the decomposition of the litter, which is followed by transport to the lower mineral soil in percolating rainwater. The nuclides deposited on the trees are transported to the litter as fallen leaves or by weathering, while a portion of the radionuclides in the soil is transported into the trees through root absorption.
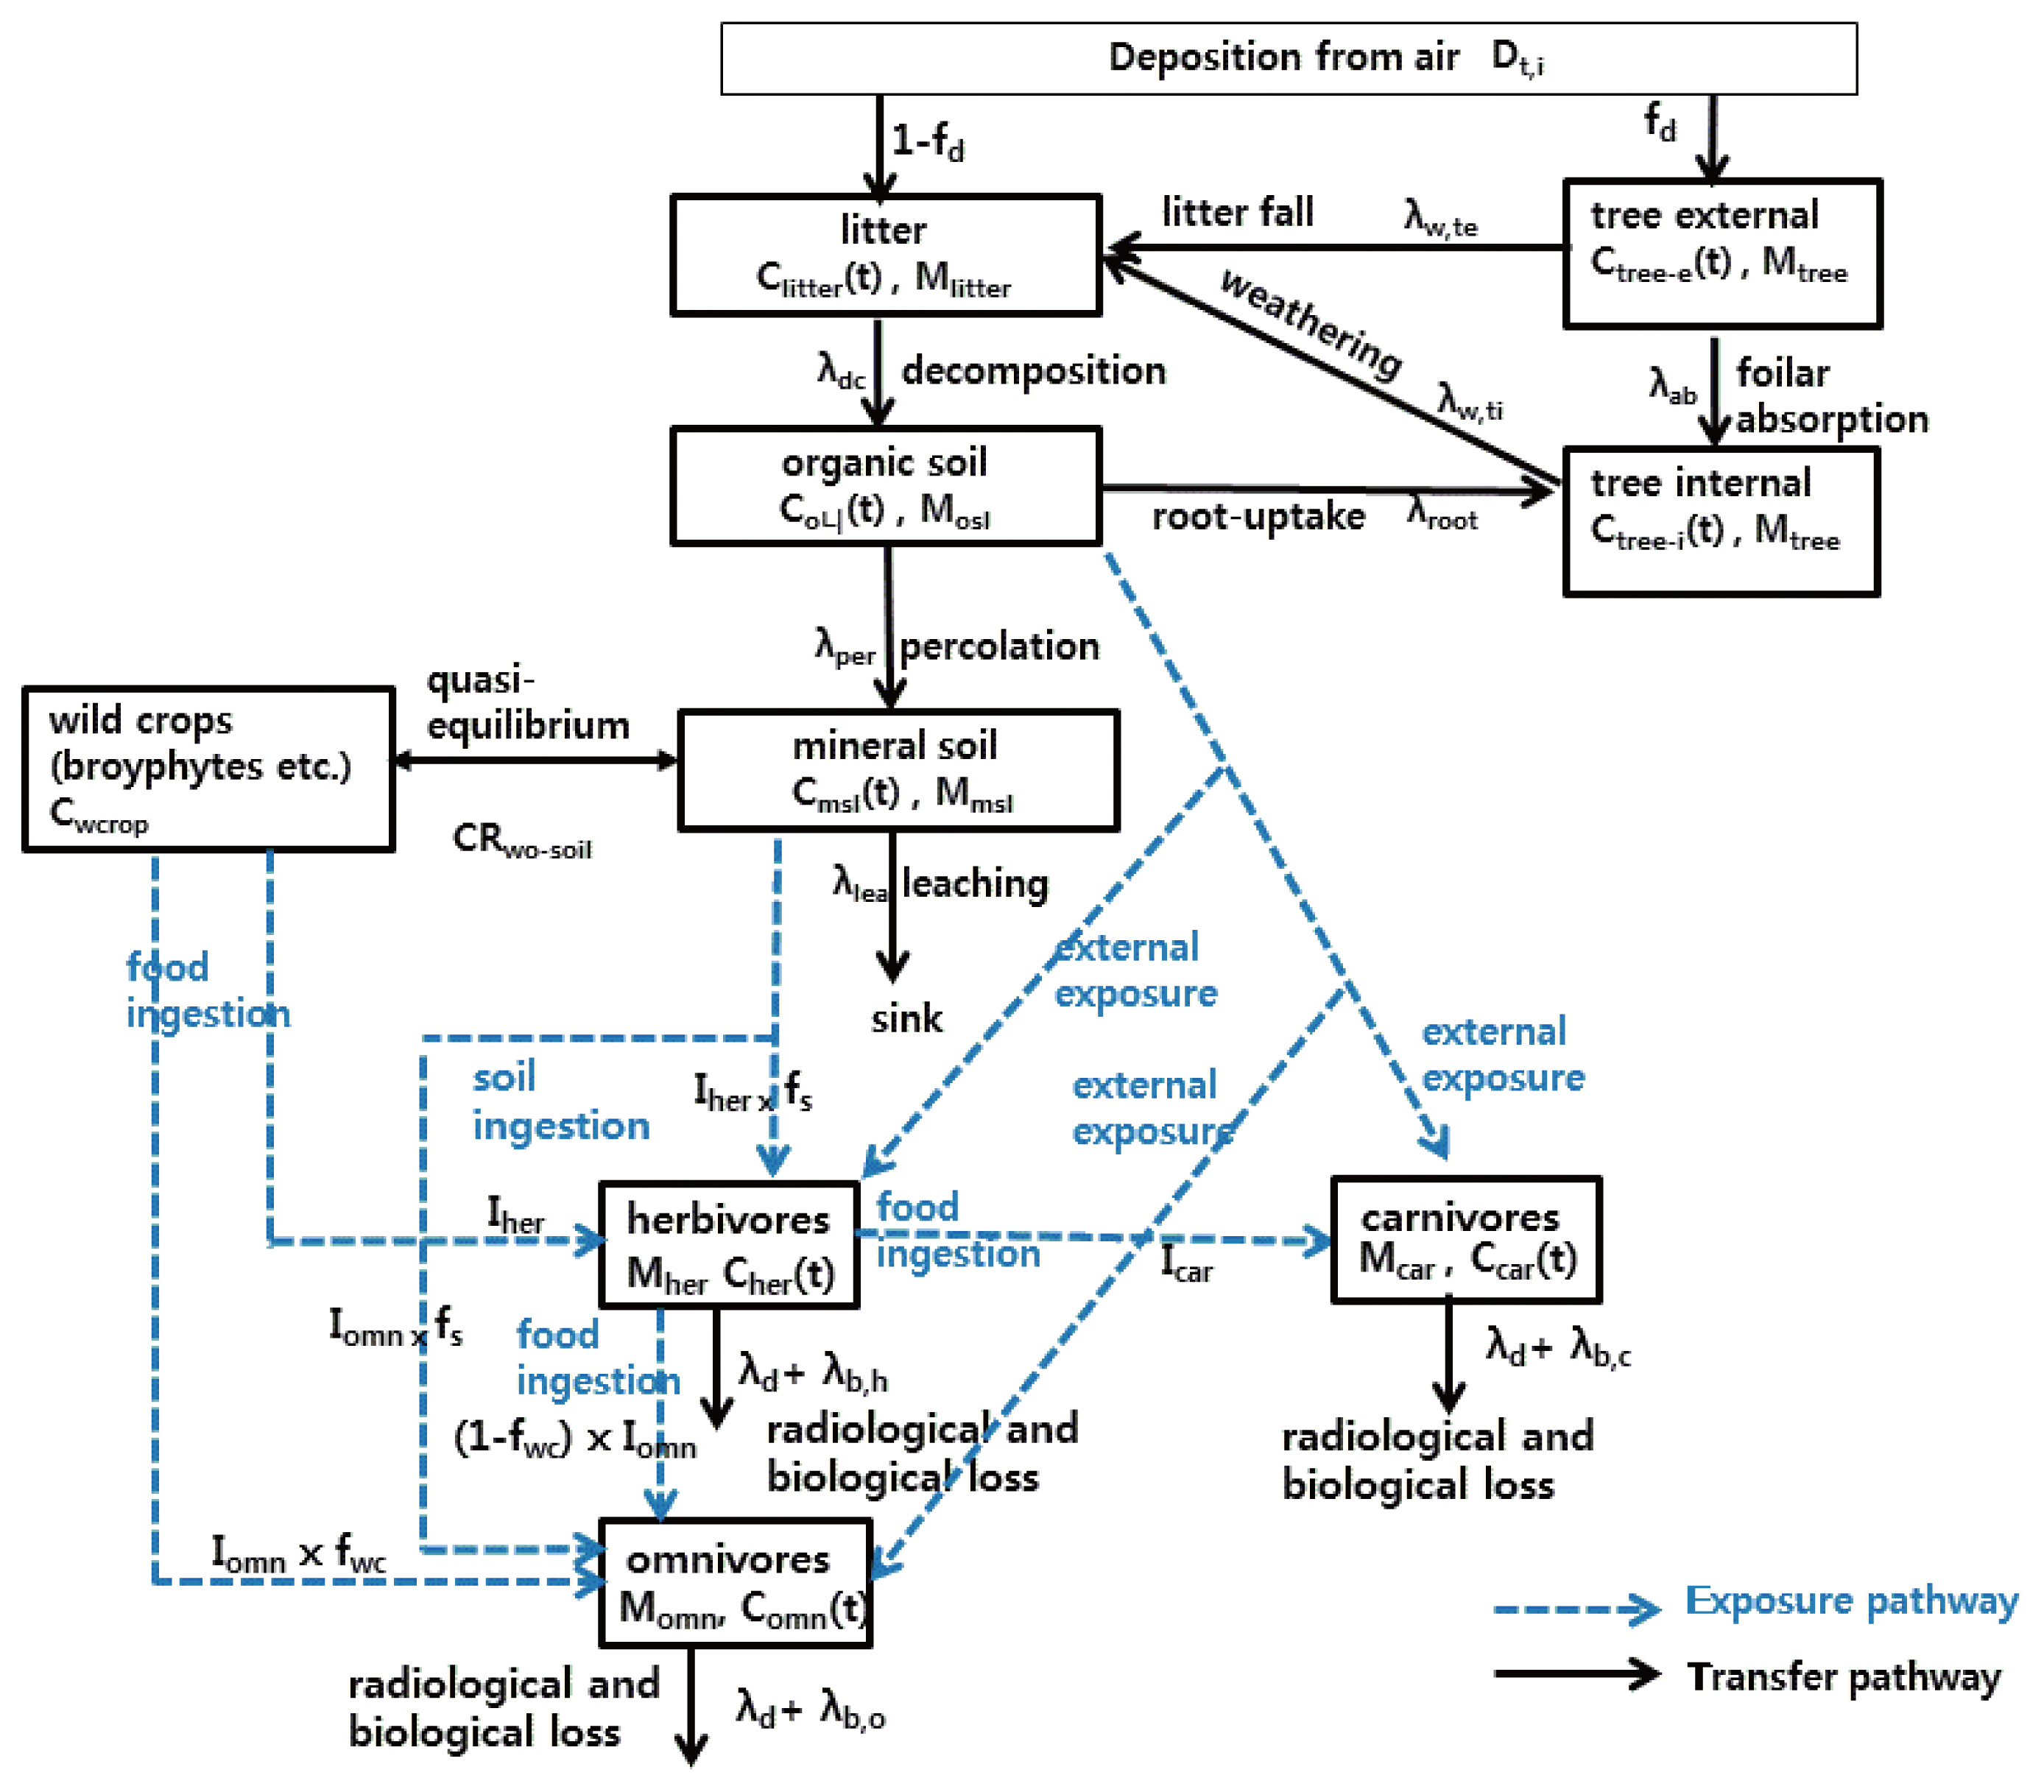
Transport pathway of radionuclide in forest ecosystem forest and the exposure pathway to faunas.
Terrestrial wild faunas have diverse and complex food chains, and thus it is not possible to model all phenomena in detail, nor is it necessary owing to the uncertainties of detailed models. Therefore, in this study, wild faunas were simplified into three types: herbivores, omnivores, and carnivores. The herbivorous animals feed only on contaminated wild crops (e.g., fern, mushroom, and berry, etc.), while omnivorous animals consume not only wild crops mainly as feed, but also consume some small herbivorous animals such as hares. Carnivorous animals feed only on herbivorous animals as their diet. The transport pathway of radionuclides to fauna can be summarized as follows.
Herbivores: litter→organic soil→mineral soil→wild crop→ herbivores
Omnivores: litter→organic soil→mineral soil→wild crop→ herbivores→omnivores or litter→organic soil→mineral soil→wild crop→omnivores
Carnivores: litter→organic soil→mineral soil→wild crop→ herbivores→carnivores
2. Transport Model
The temporal change of the activity concentration of radionuclide i in each component of forest ecosystem can be expressed as follows:
-
-litter
(1) -
-organic soil
(2) -
-mineral soil
(3) -
-tree external
(4) -
-tree internal
(5) -
-wild crops
(6) -
-herbivores
(7) -
-omnivores
(8) -
-carnivores
(9)where Clitter,i (Bq·kg-dry−1), Cosl,i (Bq·kg-dry−1), Cmsl,i (Bq·kg-dry−1), Ctree–e,i (Bq·kg-fresh−1), Ctree–i,i (Bq·kg-fresh−1), and Cwcrop,i (Bq·kg-fresh−1) are the radioactivity concentrations of radionuclide i for litter, organic soil, mineral soil, tree external, tree internal, and wild crops, respectively. In addition, Cher,i (Bq·kg-fresh−1), Comn,i (Bq·kg-fresh−1), and Ccar,i (Bq·kg-fresh−1) are the radioactivity concentration of radionuclide i for herbivores, omnivores, and carnivores, respectively, and Mher (kg), Momn (kg), and Mcar (kg) are the weight of herbivores, omnivores, and carnivores, and λd,i is the radioactive decay rate of radionuclide i.
Wild crops can be contaminated by the direct deposition as well as the root absorption. Since the surface of the temperate forest is mostly covered with the litter, it was assumed that the crops are contaminated by root absorption through the mineral soil. The loss of radionuclides from animals was assumed to have originated from the radioactive decay and the excretion through metabolism.
The daily ingestion rate of dietary components for animals is calculated by the following allometric equations for herbivores, omnivores, and carnivores, respectively [9].
The allometric constants of the above equations were assumed to be the same for both herbivores and omnivores because the foods of these animals were assumed to be mainly wild crops. The rate of biological loss through metabolism is calculated using the following allometric relationship [9].
The initial activity concentration of radionuclide i in each compartment is defined as follows.
where
Dt,i : total deposition of radionuclide i for the unit area, Bq·m−2
fd : fraction deposited on the tree surface relative to the total deposition
Mlitter: biomass density of litter per unit area, kg·m−2
Mtree: biomass density of trees per unit area, kg·m−2
3. Radiation Dose Assessment Model
Terrestrial fauna and flora can be exposed internally and externally. The internal exposure arises from the ingestion of contaminated food or soil, and the external exposure arises from the contamination of organic soil upon which the animals primarily move. The radiation dose rates for terrestrial faunas and floras are calculated through the following equations.
-
- Internal dose from radionuclide i
(15) -
- External dose from radionuclide i
(16) -
- Total dose from all radionuclides
(17)
where
Cbiota,i (t): animal activity concentration of radionuclide i, Bq·kg-wet−1
Cosl,i (t): organic soil activity concentration of radionuclide i, Bq·kg−1
DCCint,i: internal dose coefficient of radionuclide i, μGy·d−1 per Bq·kg-wet−1
DCCext,i: external dose coefficient of radionuclide i, μGy·d−1 per Bq·kg-wet−1
Equations (1) through (17) are a set of nonlinear ordinary differential equations, the solutions of which were numerically solved using the 4th order Runge-Kutta method.
Results and Discussion
The activity concentration and radiation dose for trees and animals in the Fukushima forest after the Fukushima accident were predicted, and the predicted results were compared with the measurement data used for the model validation.
1. Assumption and Input Data
1) Deposition density
In the UNSCEAR Fukushima report [8], the radiation dose rate for terrestrial animals and plants was determined by applying the measured deposition density for the town of Okuma, where the deposition density was known to be the highest. However, Okuma town is a residential area where wildlife is not able to live, and thus the use of the deposition density for the town seems somewhat unrealistic for predicting the radiation dose for wildlife. The deposition density of 137Cs in forests due to the Fukushima accident was known to be within the range 5×10⁴ to 5×10⁵ Bq·m−2 [2, 10], which was about 10-times smaller than that of the Okuma town. In this study, among the deposition density measurements in the Fukushima forest area, the maximum value (105 Bq·m−2) was applied as the deposition density of 137Cs in the forest. On the other hand, because the deposition densities for 134Cs and 131I were unknown, the deposition density for the radionuclides were determined using the deposition density of 137Cs, and the ratio of the activity concentration of other radionuclides to 137Cs [11]. The calculated deposition density for 134Cs and 131I were 9.1×10⁴ Bq·m−2 and 4.6×10⁵ Bq·m−2, respectively.
2) Flora and fauna
The radioactivity concentrations of terrestrial mammals such as deer, black bears, and wild boar were measured after the Fukushima accident [8]. Therefore, hare, deer, black bear and wild boar were selected as the model animals to compare the model predictions with the measured values. The hare and deer belong to herbivores, and wild boars and black bears belong to omnivores (Table 1). The hare was assumed to be one of the foods of omnivores and carnivores. Accordingly, the food chain pathway of omnivorous animals was assumed to be wild crop→hare→omnivores, and that of herbivores was assumed to be wild crop→herbivores. Two kinds of trees, conifers and deciduous, were considered in the model predictions with different input parameter values.
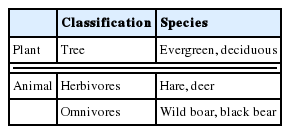
Terrestrial Floras and Fauns Considered in the Study
Table 2 summarizes the dose conversion coefficient (DCC) for the model animals and trees. The DCC values were obtained by applying the ICRP Publication 108 [12] method using a web-based ICRP dose conversion factor calculator [13]. The mass for the animals was the mean value of each animal captured.
Dose Conversion Coefficient of Model Organisms
3) Input parameters
Table 3 summarizes the values of the input parameters used in the model predictions. Most of the values were taken from the literature. The fraction of fallout deposited on the trees relative to the total deposition (fd) was assumed to be 0.5, and the fraction of wild crops among the food of omnivores (fwc) was assumed to be 0.9. The allometric constants for herbivores were assumed to the same as those for omnivores. The foliar absorption of trees was not considered because no cesium was found inside a tree [2].

Parameter Values Used in the Prediction
2. Calculated Results
The activity concentrations and radiation dose rates for tree and animals during the first 3 years (from March 11, 2011) were simulated.
1) Radioactivity concentration
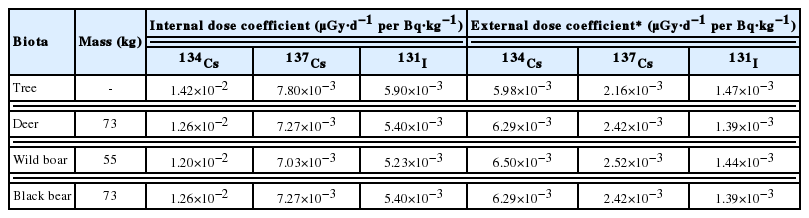
Fig. 2 shows the temporal radioactivity concentration of forest components when radionuclides were deposited onto an evergreen forest. Similar results were also obtained for the deciduous trees, which are omitted here. The radionuclides deposited on litter and trees are transported to the soil over time, and subsequently to animals along the food chain. Although the same fraction of deposition on the litter and trees was assumed (fd=0.5) in the calculation, the initial radioactivity concentration of the litter was greater than that of the trees owing to the difference in their biomass density. The radioactivity concentration of the trees decreased continuously owing to the effect of the weathering and radionuclide decay. The radioactivity concentration of the litter also showed a trend of continuous decrease because the loss due to the decomposition of the litter was larger than the gain due to the weathering of tree. On the other hand, the radioactivity concentration of 131I decreased sharply, whereas that of radioactive cesium decreased moderately, owing to the difference in the decay rate of the radionuclides. Although 134Cs and 137Cs have the same transport characteristics in the environment, the radioactivity concentration profile for 134Cs increased gradually over time due to the shorter half-life of 134Cs.
Predicted radioactivity concentration of forest components: (A) litter and tree, (B) soils, and (C) animals.
The radioactivity concentration of radioactive cesium in the organic soil showed a peak around 130 days, whereas the concentration of 131I in the organic soil decreased to a negligible level after an initial small peak owing to its short half-life. The radioactivity concentration peak of 134Cs in the mineral soil appeared after about 780 days, whereas the peak concentration of 137Cs did not appear even after 1,000 days. This different result was ascribed by the fact that in the present study, the leaching rate constant (3.03×10⁻⁶ d−1) of radioactive cesium was about one to two orders of magnitude less than the radioactive decay constant of radioactive cesium (9.2×10⁻⁴ d−1 and 6.32×10⁻⁵ d−1 for 134Cs and 137Cs, respectively). This indicates that the decrease in radioactive cesium concentration in mineral soil was mainly caused by radioactive decay. Consequently, the different peak time of radioactive cesium was caused by the difference in the decay rate of the radionuclides. On the other hand, the radioactivity concentration of 131I in mineral soil was estimated to be negligible owing to its short half-life.
According to the allometric equation, the rate of biological excretion of radioactivity increases with the mass of animals, and thus it may result in a higher radioactivity concentration in animals of smaller mass. The radioactivity concentration of 137Cs in animals was greater than that of 134Cs owing to its higher deposition density and lower decay rate. The radioactivity concentration of 131I was negligible for all animals. This was attributed to the fact that the radioactivity concentration of 131I in the mineral soil and the wild crops was very small, and consequently resulted in almost no contamination with 131I in animals through the food chain.
2) Radiation dose rate
The predicted total radiation dose rate for trees (evergreen and deciduous) and animals are shown in Fig. 3. The total dose rate is the sum of the internal and external exposures for all radionuclides. The dose rate profiles for the evergreens and deciduous trees showed similar trends, but the amount of dose rate was different due to different values of model parameters. It resulted in the difference in the dose rate profile for the animals. The total dose rate of animals was higher than that of the plants. The total dose rate for the small-mass animals was higher than that of the large-mass animals because of the difference in the radioactivity concentration. After about 130 days, the total dose rate of animals reached the maximum (about 25 μGy·d−1). This is less than 100 μGy·d−1, which is the lower band limit of the Derived Consideration Reference Level (DCRL) for terrestrial animals proposed in ICRP Publication 124 [18]. This suggests that the forest contamination caused by the Fukushima accident was not at such a level that it harmed the health of the populations of wild animals and plants in the forest.
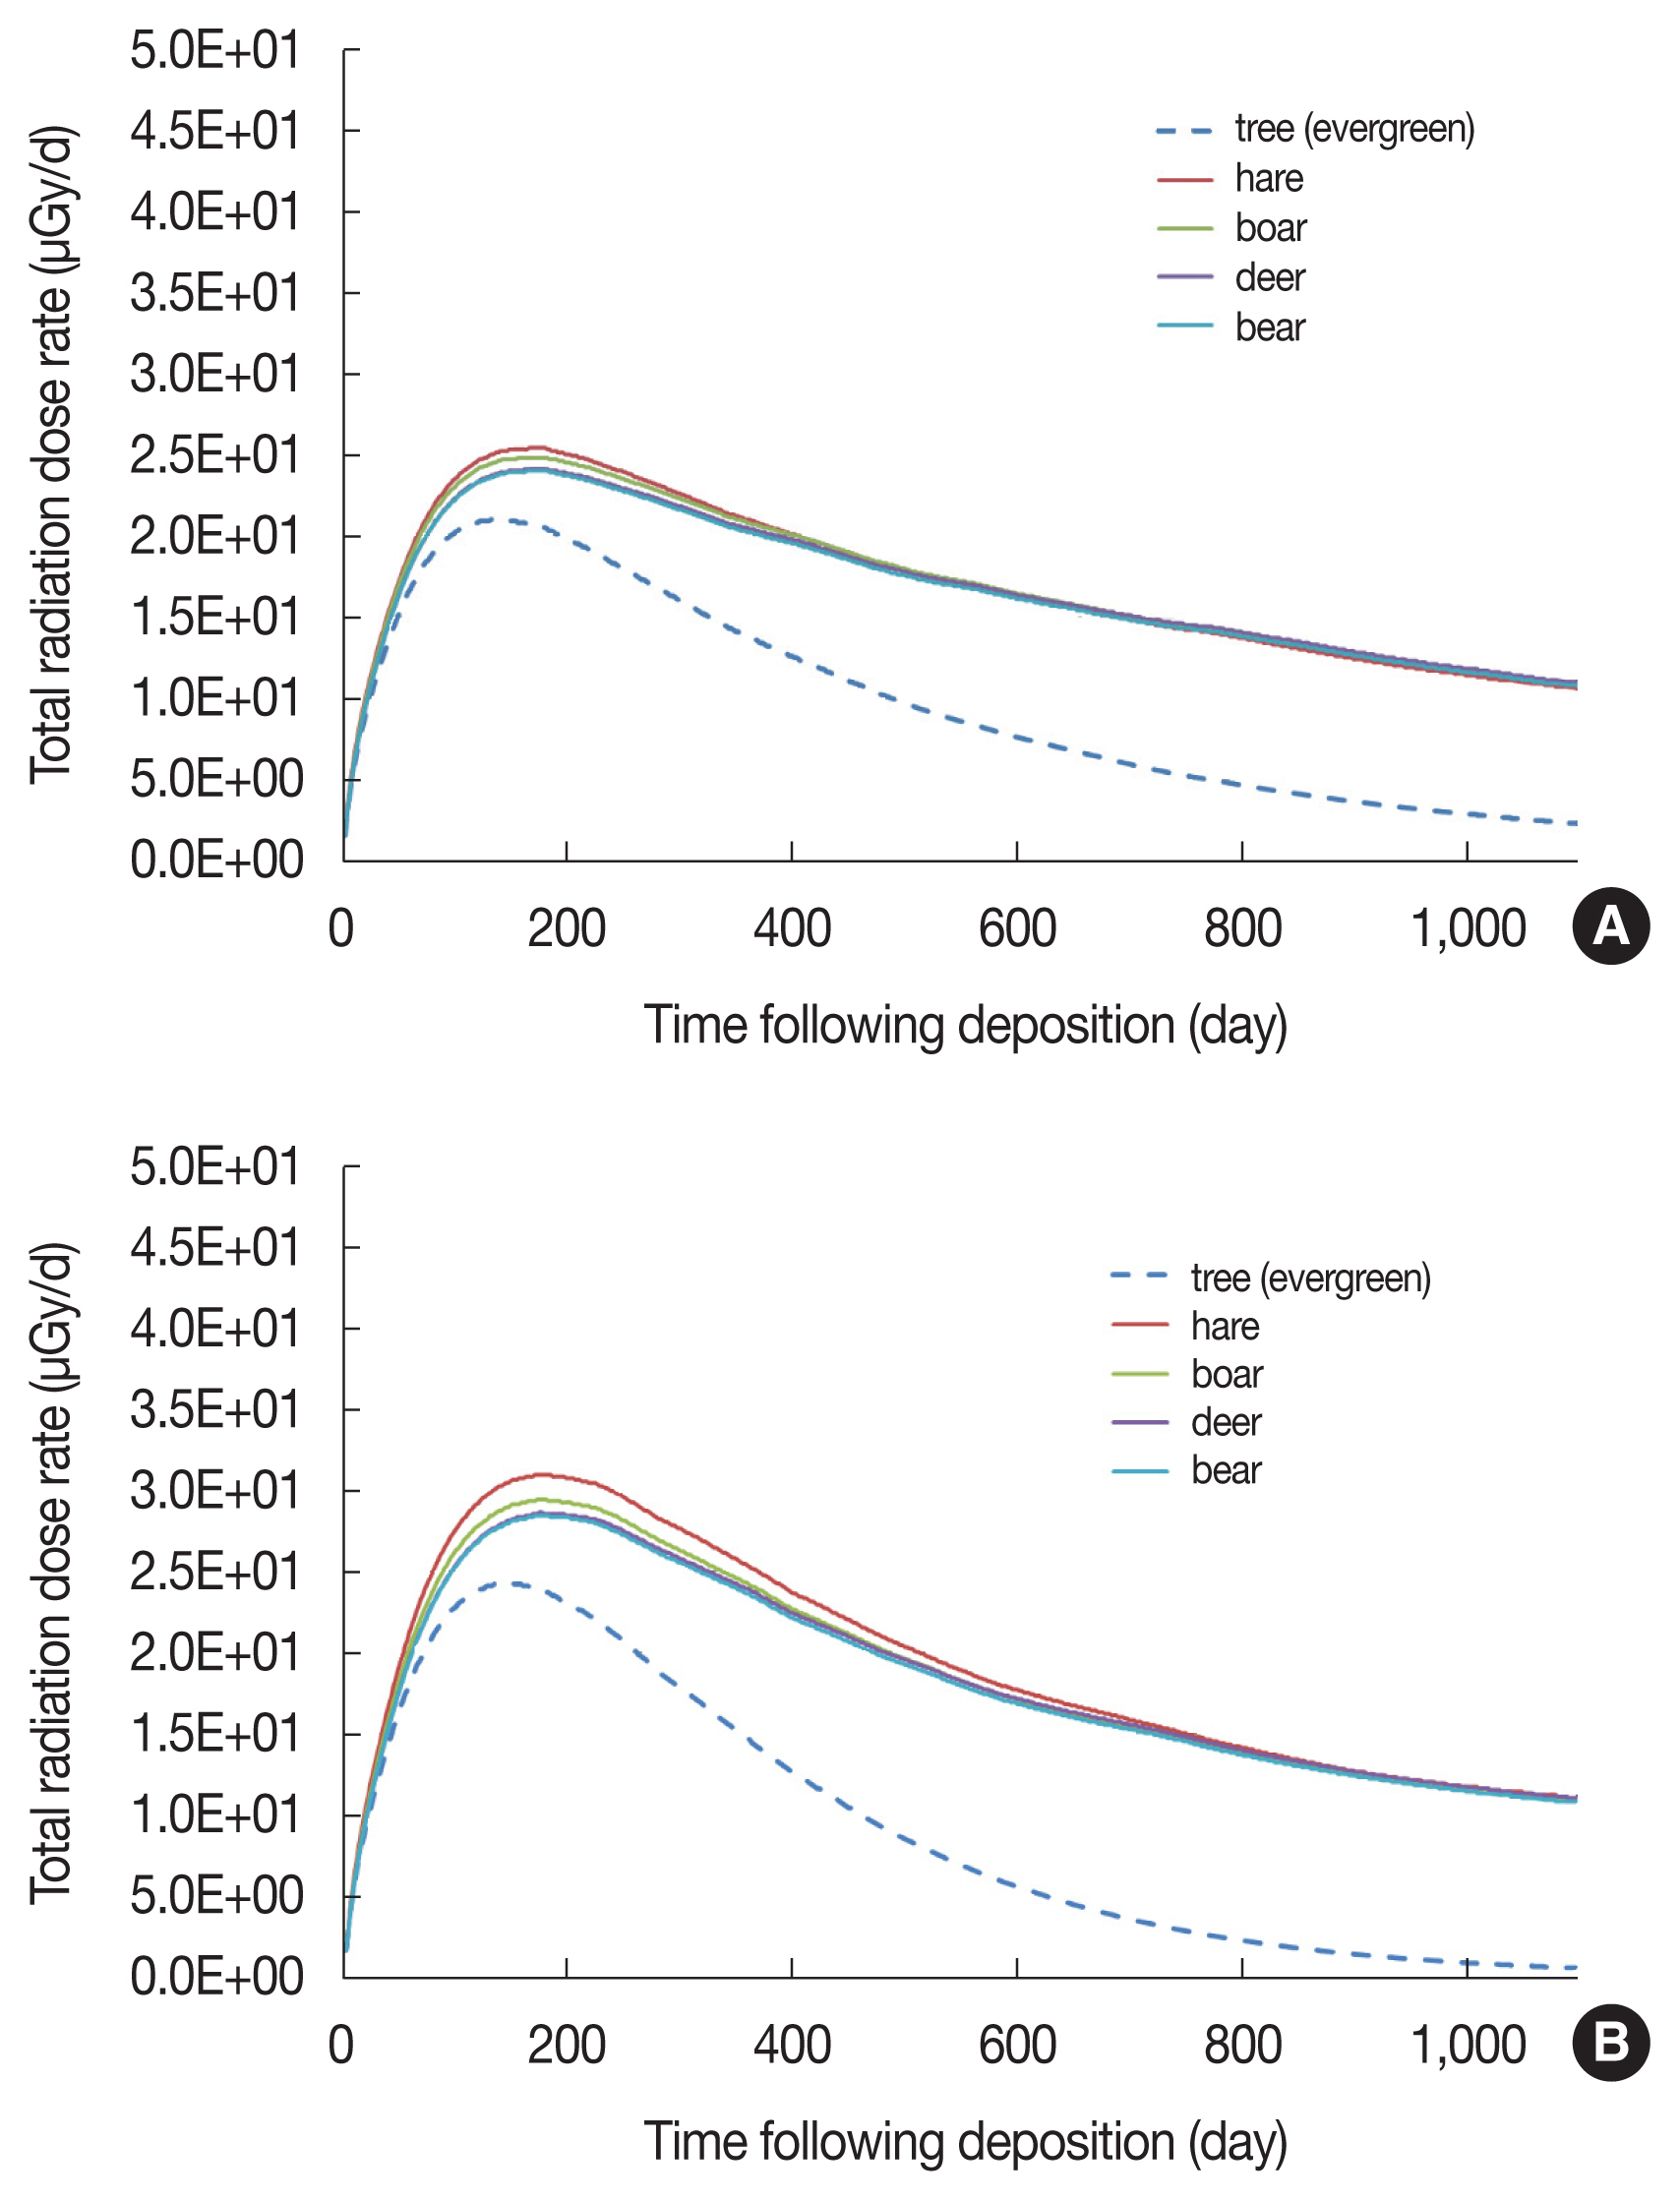
Predicted total radiation dose rate for (A) evergreens and (B) deciduous.
Fig. 4 shows the contribution of exposure pathways and radionuclides to the total radiation dose rate for animals. It can be seen that the external exposure owing to the contaminated organic soil was the main contributor of animal exposure for the initial period, while the internal exposure owing to ingestion of contaminated food was the dominant pathway of animal exposure after about 550 days. The external dose rate decreased continuously after the peak at about 130 days. This result was consistent with the decreasing trend for the radioactivity concentration profile of organic soil shown in Fig. 2. In contrast, the peak of the internal dose rate occurred at about 780 days owing to the effect of the delayed transfer of radionuclides through the food chain.
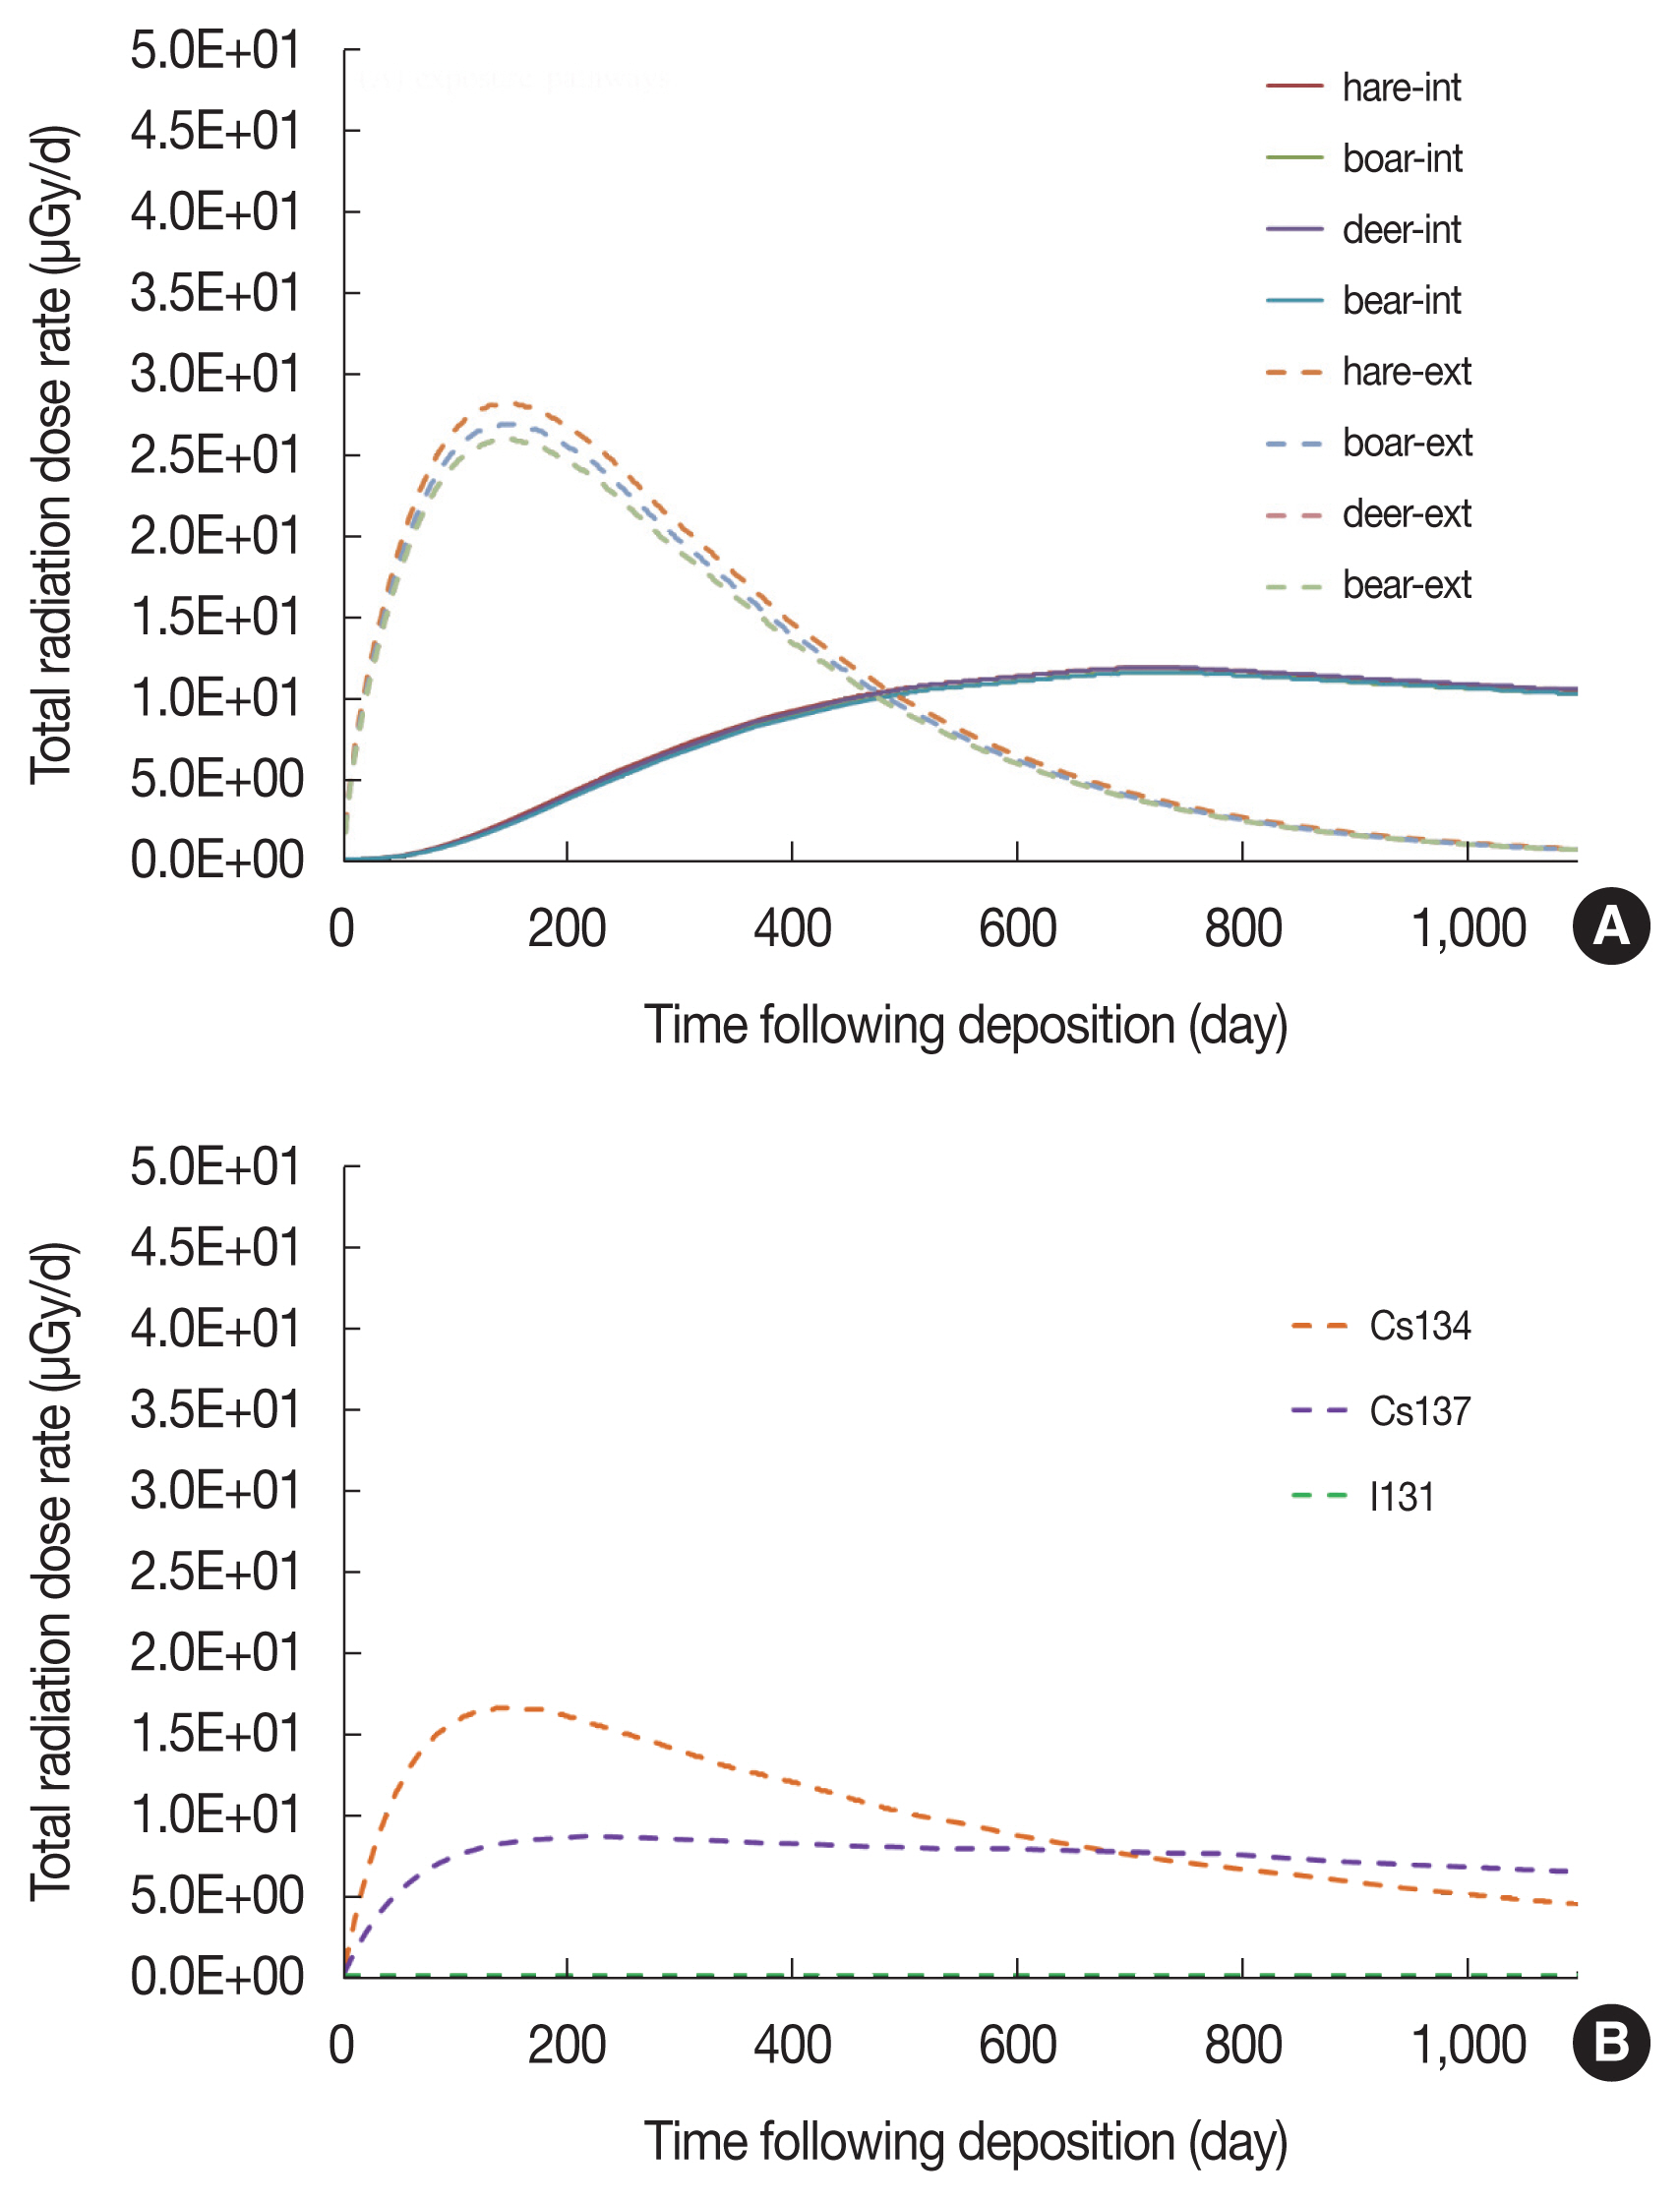
Contribution of (A) exposure pathways and (B) radionuclides on the total radiation dose rate.
Radioactive cesium mainly influenced the total dose rate for the animals, whereas 131I had little effect. Although the 134Cs concentration was smaller than the 137Cs concentration owing to the difference in the initial deposition density and radioactive decay rate, the contribution of 134Cs to the total dose rate was larger for the early phase because the dose conversion coefficient for 134Cs is larger than that for 137Cs. This trend was reversed after around 700 days, i.e., the contribution of 137Cs to the total dose rate was larger than that of 134Cs. Over the long term, 137Cs among the radionuclides became the main contributor of exposure.
3) Comparison of model predictions with measurements
Fig. 5 shows a comparison of the model predictions with the radioactive cesium inventory of the forest components, which were measured in the forests in Fukushima Prefecture in September 2011. Because the dates of measurement were not known exactly, the measured data were compared with the results predicted for September 1 and 30, 2011, respectively. Among the parameters used in the calculation, the percolation rate constant (λper) representing the transport of radioactive cesium from the organic to the mineral soil was only a fitting parameter. The value obtained by comparing the calculated results with the measured values while fixing other parameter values was 4.2×10⁻³ d−1 and 5.0×10⁻³ d−1 for evergreens and deciduous trees, respectively. The predicted inventory of radioactive cesium in tress agreed well with the observed values for both evergreens and deciduous trees.
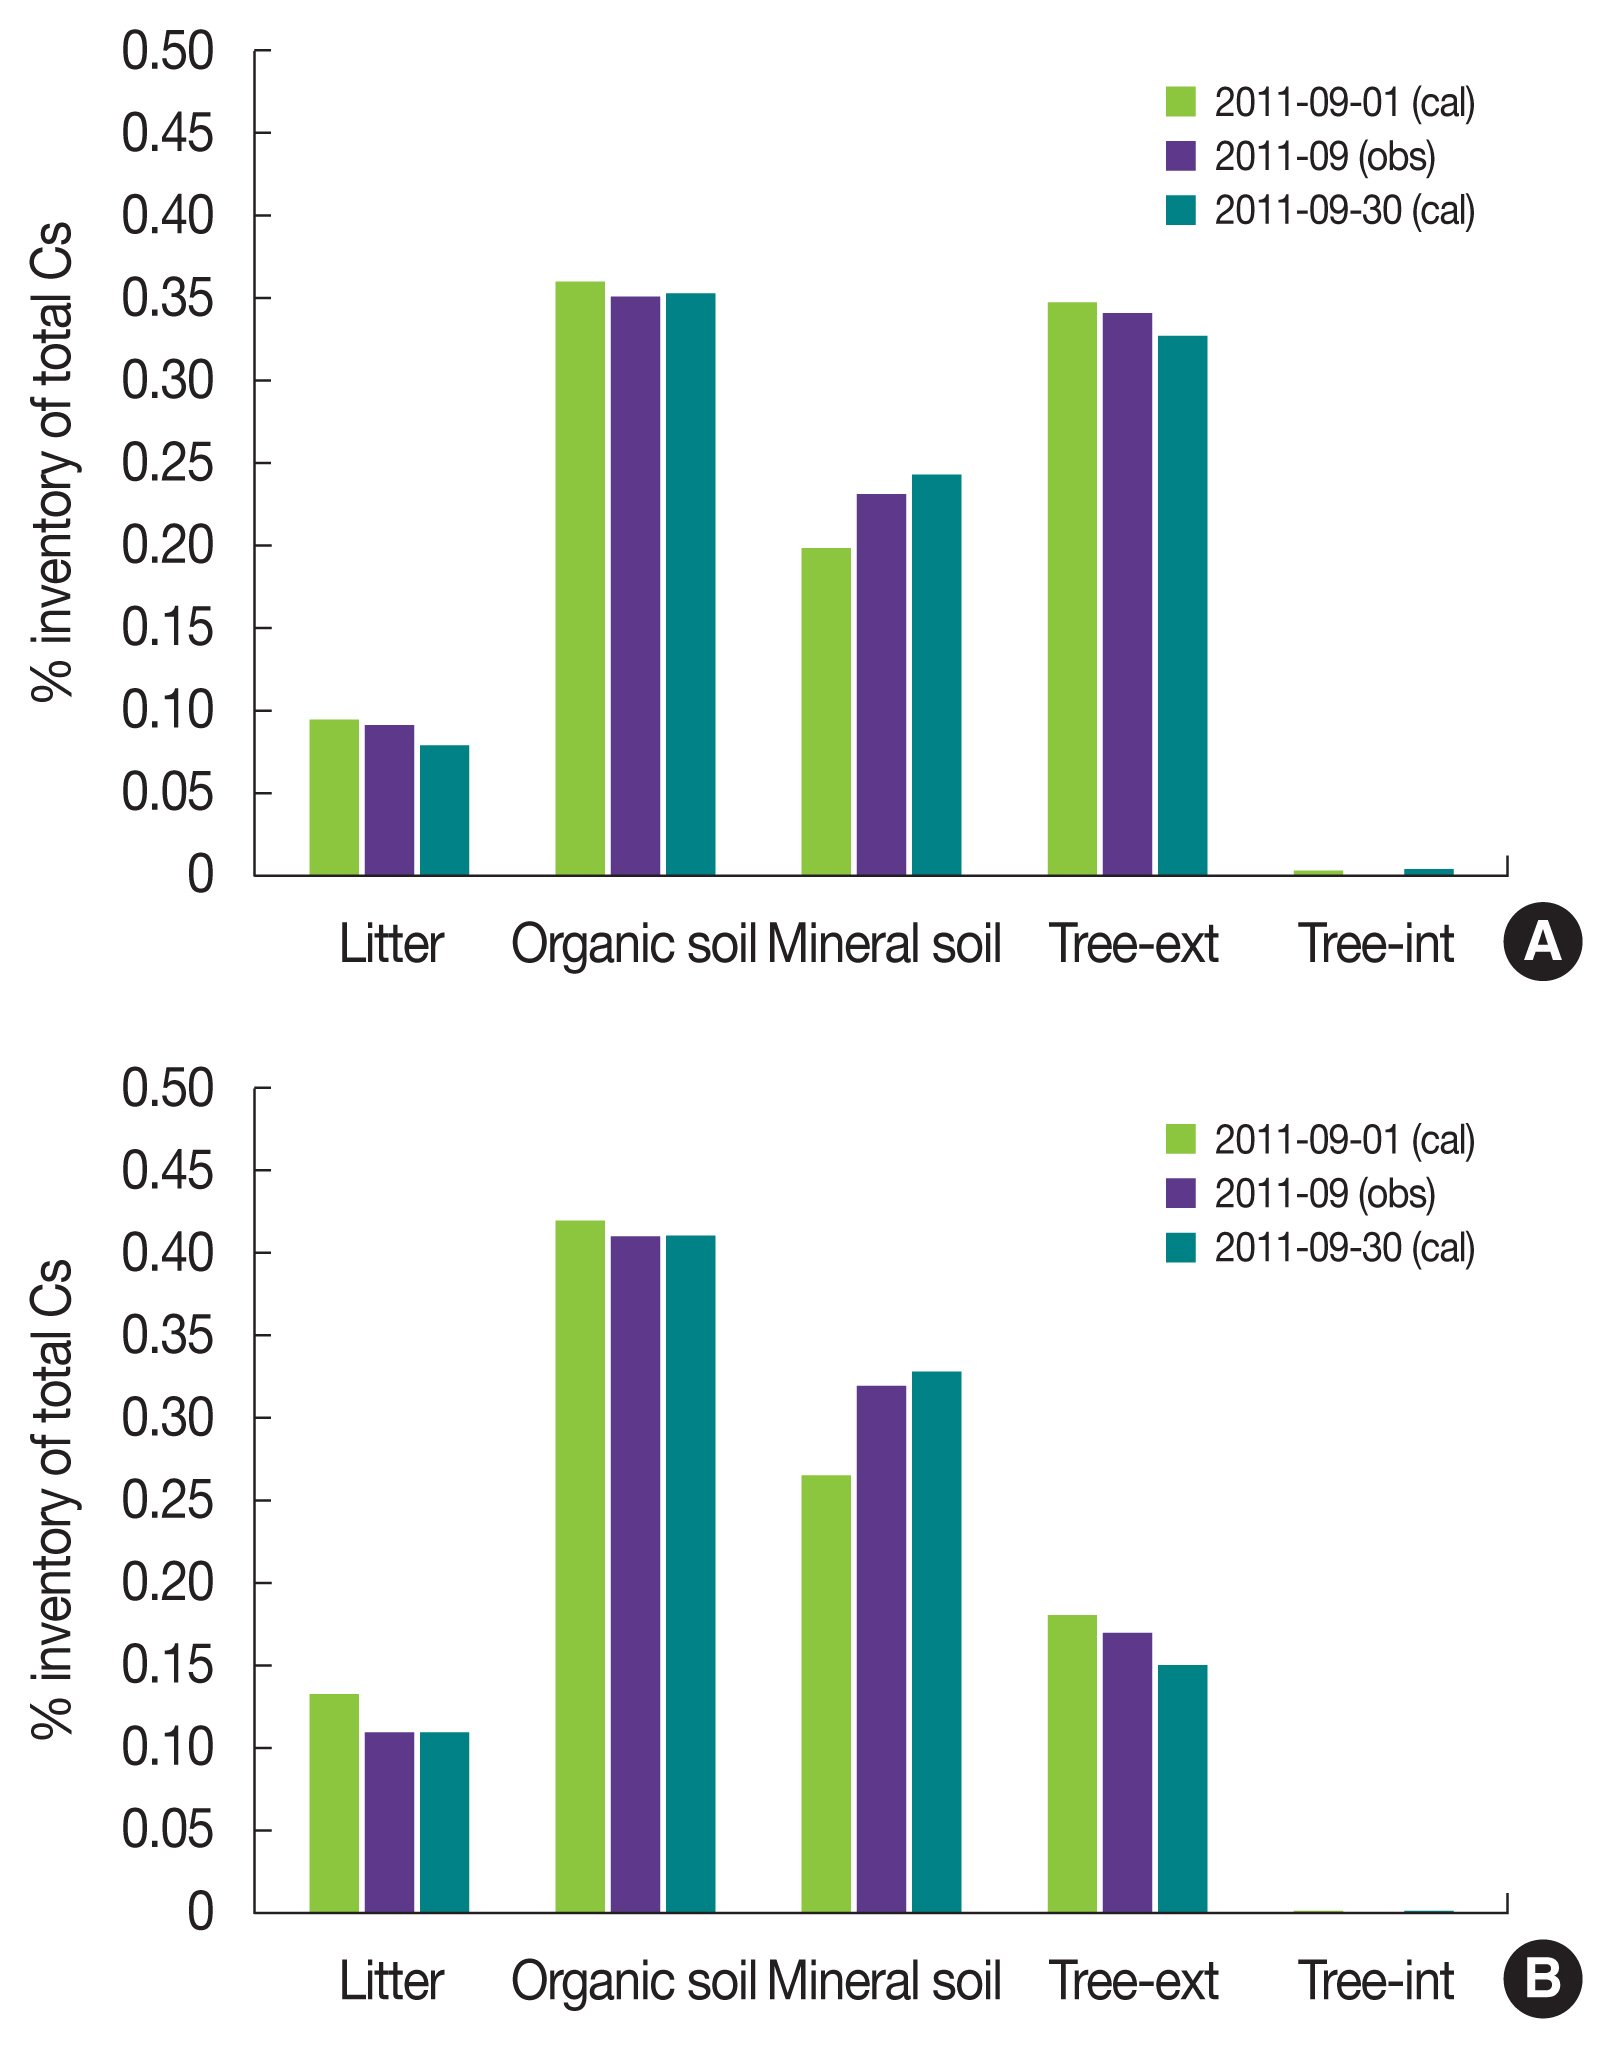
Comparison of model predictions with the measured radioactive cesium inventory for (A) evergreens and (B) deciduous.
Fig. 6 shows a comparison of the model predictions with the measured radioactivity concentration of cesium in wild animals. The measured data shows a very scattered result through sampling in a wide forest area of Fukushima. This suggests that there will be some uncertainty in a direct comparison of the model predictions for animals at a specific location with the measured results. In the case of black bears and wild boars, the model predictions were, as a whole, in the center region of the measured value, and in the case of the deer, the model predictions were somewhat larger than the measured values. Taking the intrinsic uncertainty of the transport model in the forest ecosystem and its parameter values into consideration, the present model predictions seem to be acceptable.
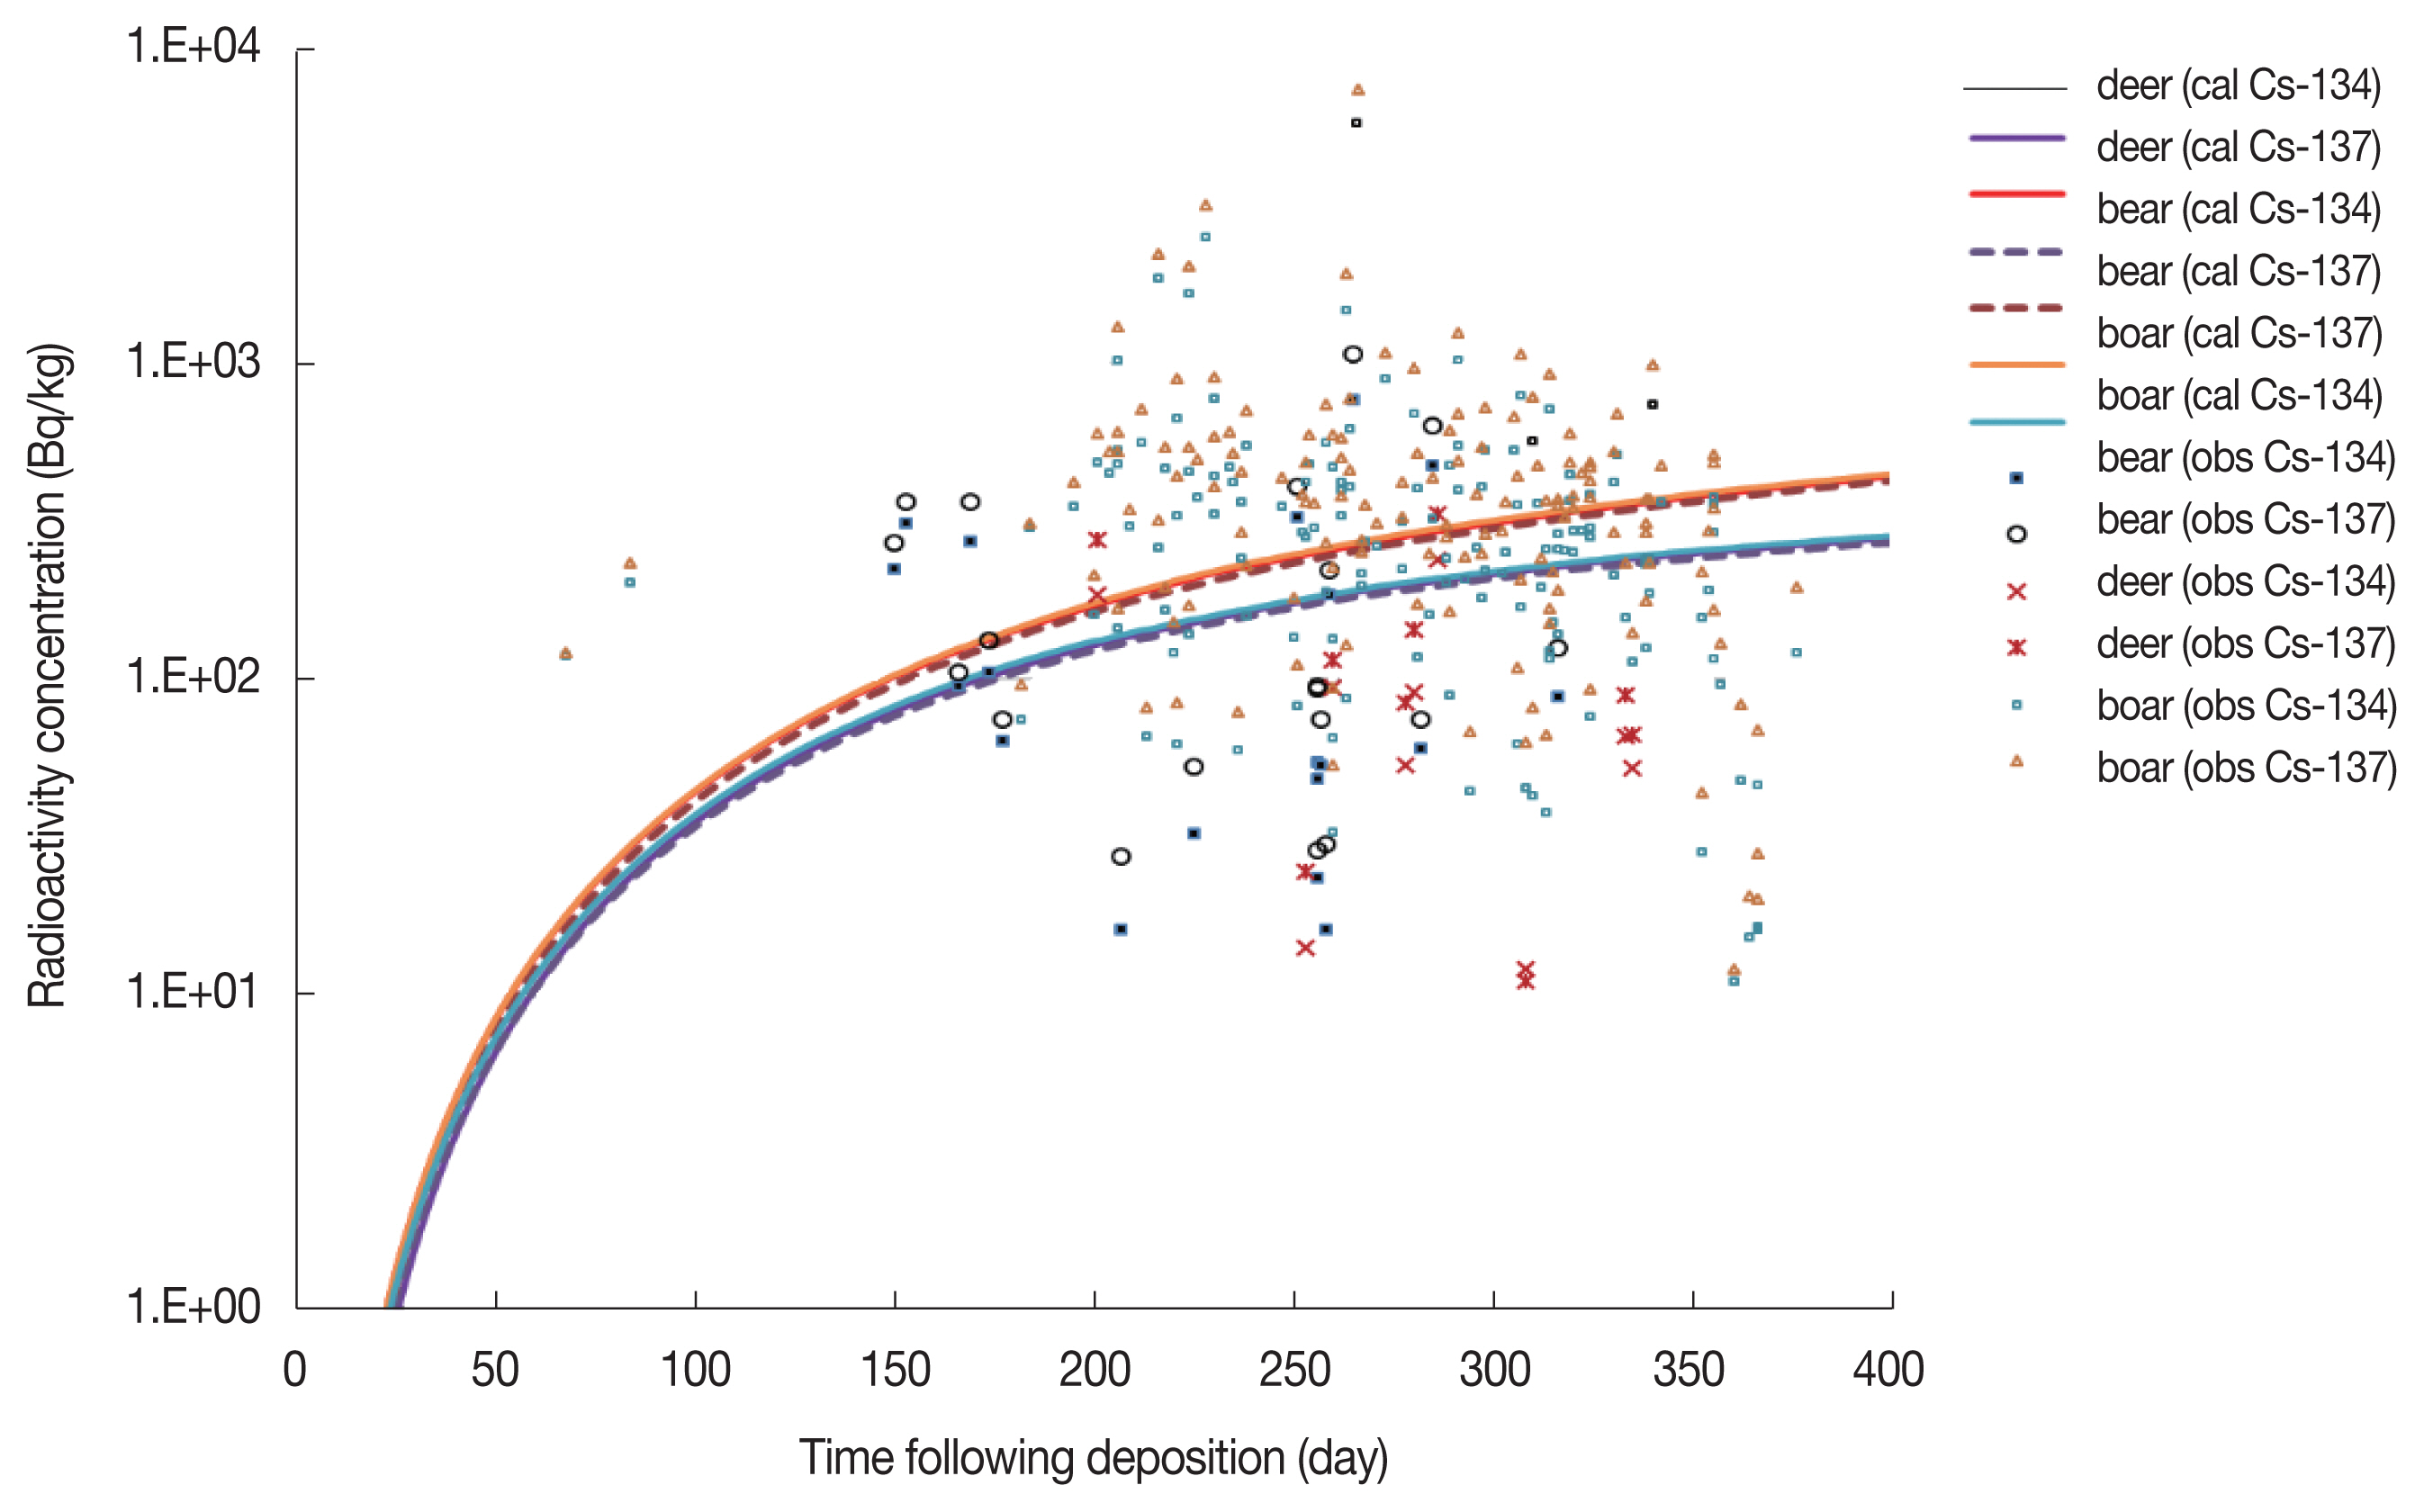
Comparison of model predictions with the measured radioactive cesium activity concentration in wild animals.
On the other hand, the largest measured concentrations were 5,830 and 7,430 Bq·kg−1 for 134Cs and 137Cs, respectively, which were obtained for wild boars at about 266 days. Based upon these measured activity concentrations, the calculated total absorbed dose of wild boars was 141 μGy·d−1 (internal dose rate, 121.8 μGy·d−1; external dose rate, 18.9 μGy·d−1), which is in the band (100–1,000 μGy·d−1) of the ICRP’s DCRL for terrestrial animals. This indicates an insignificant radiological effect on the forest wildlife.
Conclusion
To assess the radioactivity concentration and the radiation dose of terrestrial flora and fauna, a dynamic transfer model of radionuclides in a forest ecosystem was developed. In the model, nine forest components of litter, organic and mineral soil, and wild crops that are in equilibrium with the mineral soil, herbivores, omnivores, and carnivores were considered. The transfer model of radioactivity between the forest components was combined with the dose rate assessment models.
The predictive capability of the model was investigated by comparing predictions with the field data from trees and fauna measured in the Fukushima forest area after the Fukushima nuclear accident. The predicted radioactive cesium inventories for trees agreed well with those for evergreens and deciduous trees measured in the Fukushima area. The predicted temporal activity concentrations for animals were within the range of the measured activity concentration of deer, wild boars, and black bears, which exhibited a very scattered trend in the sampling over a wide area. The radiation dose rates for wild animals were, for the whole simulation time, estimated to be much smaller than the lower limit (0.1 mGy·d−1) of the DCRL of the ICRP for terrestrial plants and animals. This suggested that the radiation effect of the Fukushima accident on the wildlife in the Fukushima forest would be insignificant.
Acknowledgements
This work was supported by a National Research Foundation of Korea (NRF) grant funded by the Korea government (No. NRF-2017M2A8A4015252).
Notes
Conflict of Interest
No potential conflict of interest relevant to this article was reported.