One-Year Continuous Measurement of Outdoor Radon Progeny Concentration in Beijing Area
Article information
Abstract
Background
Compared with reported data of radon concentration, data of radon progeny concentration is limited in general, especially in outdoor environment.
Materials and Methods
To know both the level and the variation of radon progeny concentration in outdoor environment in Beijing area, one-year continuous measurement with a cycle of 60 minutes was carried out by a step-advanced filter (SAF) monitor for radon progeny measurement. The observation site was located in a park in Eastern Beijing area, and the observation period was from October 17, 2018 to September 29, 2019.
Results and Discussion
The equivalent equilibrium concentration (EEC) of radon progeny varies from 0.7 to 19.1 Bq·m−3, with an annual average of 4.9±2.7 Bq·m−3. A clear diurnal variation of EEC, higher in the early morning and lower in the late afternoon, is observed due to the high sensitivity of the SAF monitor.
Conclusion
Vertical convection of atmospheric boundary layer is thought to be the main reason of this phenomenon. For annual variation, the lowest monthly average EEC appeared in April, while the highest appeared in November, which might attribute to the atmospheric stability in different seasons.
Introduction
Radon is a naturally occurring radioactive gas generated by the decay of 226Ra-bearing mineral in rocks and soils. Since radon is an inert gas, it can move freely through the soil or building materials, enabling it to escape into the atmosphere or seep into the indoor environment. Radon decays into a series of short-lived products (218Po, 214Bi, and 214Pb, abbreviated by radon progeny usually). They are radioactive particles with relatively short half-lives existing in air, and the inhalation of radon and its progeny can increase the risk of lung cancer which is confirmed by epidemiological studies reported by the World Health Organization [1]. Radon progeny is not only the largest contributor to the natural occurring radiation exposure of human [2], but also an ideal radioactive tracer which can be widely used for environmental and atmospheric studies [3]. Especially in recent years, the variation of radon progeny concentration seems to have relationship with local air pollution [4, 5]. In Beijing area, air pollution, PM2.5 particularly, is well known worldwide in recent years [6], and the correlation between equivalent equilibrium concentration (EEC) and PM2.5 concentration was also reported [7]. So this enables us to be more interested in accurate and long-term continuous measurement on radon progeny concentration, which is highly demanded for the purpose of both exposure dose assessment and to be used as a tracer for related environmental scientific studies as well.
Compared with the reported data of radon concentration in both indoor and outdoor environments, the amount of radon progeny data is very limited, especially for long-term continuous measurement. In Beijing area, a 5-year continued measurement of atmospheric radon concentration was carried out during 2003–2007 [8], however, there is no long-term measurement on radon progeny until this study. The typical value of average EEC in outdoor air in mainland China was reported to be 8 Bq·m−3 [9], which was the result evaluated from grab sampling or very short time of sampling. Measurement of radon progeny is usually more complex than that of radon gas, the main reason of this situation might be the current fact that fixed-filter is used for particle sampling for nearly all the commercial devices for radon progeny measurement. Accumulation of dust on the surface of filter will cause self-absorption of alpha particles and affect the measurement accuracy of alpha spectrometry. Such defect makes fixed-filter monitor cannot be used for continuous radon progeny measurement for a long period, especially in the environment with air pollution.
As a response to the defect of fixed-filter, the idea of step-advanced filter (SAF) monitor for radon progeny measurement was raised and realized by Hattori and Ishida [10] in 1994, which was big in size and weight, and could only be installed on a fixed site. Due to the development of calculation method and accompanied with the progress on electronic technology, a portable SAF monitor with high sensitivity for radon progeny measurement has been developed by author’s group as preliminary study, and it makes the long-term continuous measurement on radon progeny possible in practice.
In this paper, aiming to understand the level and the variation of radon progeny in outdoor environment in Beijing area, a one-year continuous measurement on EEC was performed by adopting an SAF monitor. The real-time field measurement result may contribute a lot to our knowledge on the behavior of radon progeny in outdoor environment.
Materials and Methods
1. SAF Monitor for Radon Progeny Measurement
An SAF monitor for continuous measurement of radon progeny is adopted for the long-term observation (RPM-SF01; Sairatec Co. Ltd., Beijing, China). The sketch map and the picture of the SAF monitor are shown in Fig. 1, with some improvement on appearance design and more working mode added after the study of Zhang et al. [11].
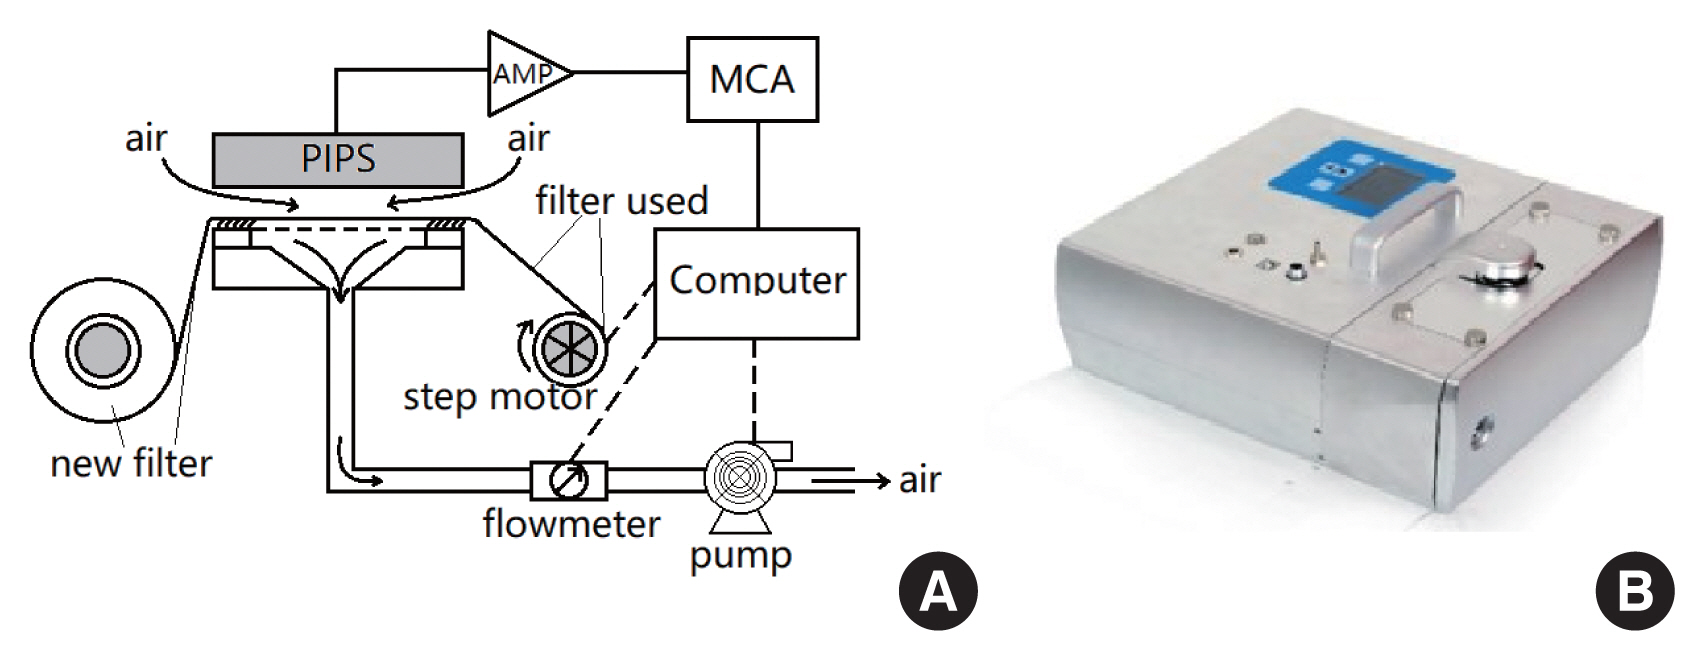
The sketch (A) and the photo (B) of the step-advanced filter monitor. PIPS, passivated implanted planar silicon; MCA, multichannel analyzer.
A roll of 0.45-μm polytetrafluoroethylene (PTFE) filter with a width of 35 mm (Beijing Haichengshijie Filter Equipment Co. Ltd., China) is used for sampling and the calibration collection efficiency is 98.3±3%. The step advanced motor rolls the filter to keep a piece of “fresh filter” ready for sampling at the beginning of each cycle. The filter has a total length of 25 m to guarantee the unattended measurement for at least one month. An diaphragm pump (Parker C187-12; Parker-Hannifin, Marysville, OH, USA) is used for sampling and the sampling flowrate is controlled at 2.5 L·min−1 for longtime stability and higher sampling volume with a variety of 0.1 L·min−1, which recorded by a mass flowmeter (Honeywell AWN43600; Honeywell, Charlotte NC, USA) and traced back to national standard by Gilian Gilibrator-2 Calibrator (Sensidyne, St. Petersburg, FL, USA). A 400-mm2 passivated implanted planar silicon (PIPS) detector (SARAD GmbH, Dresden, Germany) is used for alpha detection and alpha spectrum is recorded by a multichannel analyzer with detection efficiency of 22.0± 1.0%. Because outdoor radon progeny concentration is sometimes lower than 1 Bq·m−3, continuous measurement mode is selected for this measurement, which sampling and measuring with the same time at each interview. The radon progeny concentration could be calculated using the following equation at the end of each cycle.
where N1, N2, and N3 is the total counts of 218Po, 214Po, and 212Po. ɛ and η is the detection efficiency and collection efficiency, respectively. Q is the sampling flowrate and T is the measurement interview. CF1 is the calibration factor (Bq·m−3/cph) which is calibrated in the Chinese national radon chamber of the National Institute of Metrology (NIM) at reference environment [12]. So the measurement sensitivity S (cph/Bq·m−3) which is defined as the effective counts due to unit radon progeny could be calculated as following.
And the lower level detection limit of radon progeny concentration could be calculated as following, ignoring the thoron interference.
where the BGROI1 and BGROI2 is the background of 218Po and 214Po. For 60-minute cycle, the sensitivity of this continuous mode is nearly 50 cph/Bq·m−3, and the lower limit of detection is 0.2 Bq·m−3 for this monitor. Due to the SAF, the influence of dust and radon progeny accumulation can be neglected.
For the quality control of the monitor, the calibration was carried out in the standard radon chamber at NIM of China before and after the measurement. And the sampling flowrate was checked using Gilian Gilibrator-2 Calibrator (Sensidyne, St. Petersburg, FL, USA) each season at field to assure the quality during field measurement.
2. The Observation Site
Beijing is a large city with heavy population, located in the North China Plain. The North China Plain has a typical temperate monsoon climate, characterized by hot and rainy summers, cold and dry winters, short and windy springs and stable autumns.
The observation site is located on the grass inside a spacious park in eastern Beijing area (116.715°E, 40.202°N). There are no tall buildings located in the close vicinity. The SAF monitor is installed inside an instrument shelter, about 1.5 m from the ground. The measurement data can be automatically uploaded to data-center through GPRS (general packet radio service) and recorded in instrument simultaneously.
Results and Discussion
1. General Result
Radon progeny concentration (EEC) in outdoor environment was continuously measured and recorded hourly from October 17, 2018 to September 29, 2019 at the observation site. Effective data acquisition rate was 92.26%, and mainly missing was due to data overwritten from March 3 to March 27, 2019. The measurement results is shown in Fig. 2.

Measurement result of equivalent equilibrium concentration (EEC) in Beijing area from October 2018 to September 2019.
EEC varies in a large range in general, the maximum was 19.1 Bq·m−3 appeared in November and the minimum was 0.7 Bq·m−3 appeared in April. The annual average of EEC is 4.9±2.7 Bq·m−3, which is lower than both the world wide average value of 6 Bq·m−3 [13] and Chinese nationwide average value of 8 Bq·m−3, which is derived from grabbing sampling mentioned in previous.
It is known that the equilibrium factor is often used to link the active concentration of radon and EEC, the typical value of it is 0.6 in outdoor environment recommended by the United Nations Scientific Committee on the Effects of Atomic Radiation (UNSCEAR) [13]. Compared with the former atmospheric radon concentration from January 2003 to December 2007 in Beijing area [8], in which the average concentration was 12.1±4.9 Bq·m−3, with the maximum value of 49.8 Bq·m−3, and the minimum of 1.1 Bq·m−3, EEC measured by this study seems reasonable but the equilibrium factor, 0.40, seems much lower than the above typical vale of world average. Here considering the concentration of radon and EEC were measured neither at the same site nor during the same period, for verification simultaneously measurement on both radon and its progeny are desired in the future
The frequency distribution of EEC over the 1-year is shown by Fig. 3, which appears Poisson distribution not Guess distribution clearly, and the coefficient of determination R is 0.954.
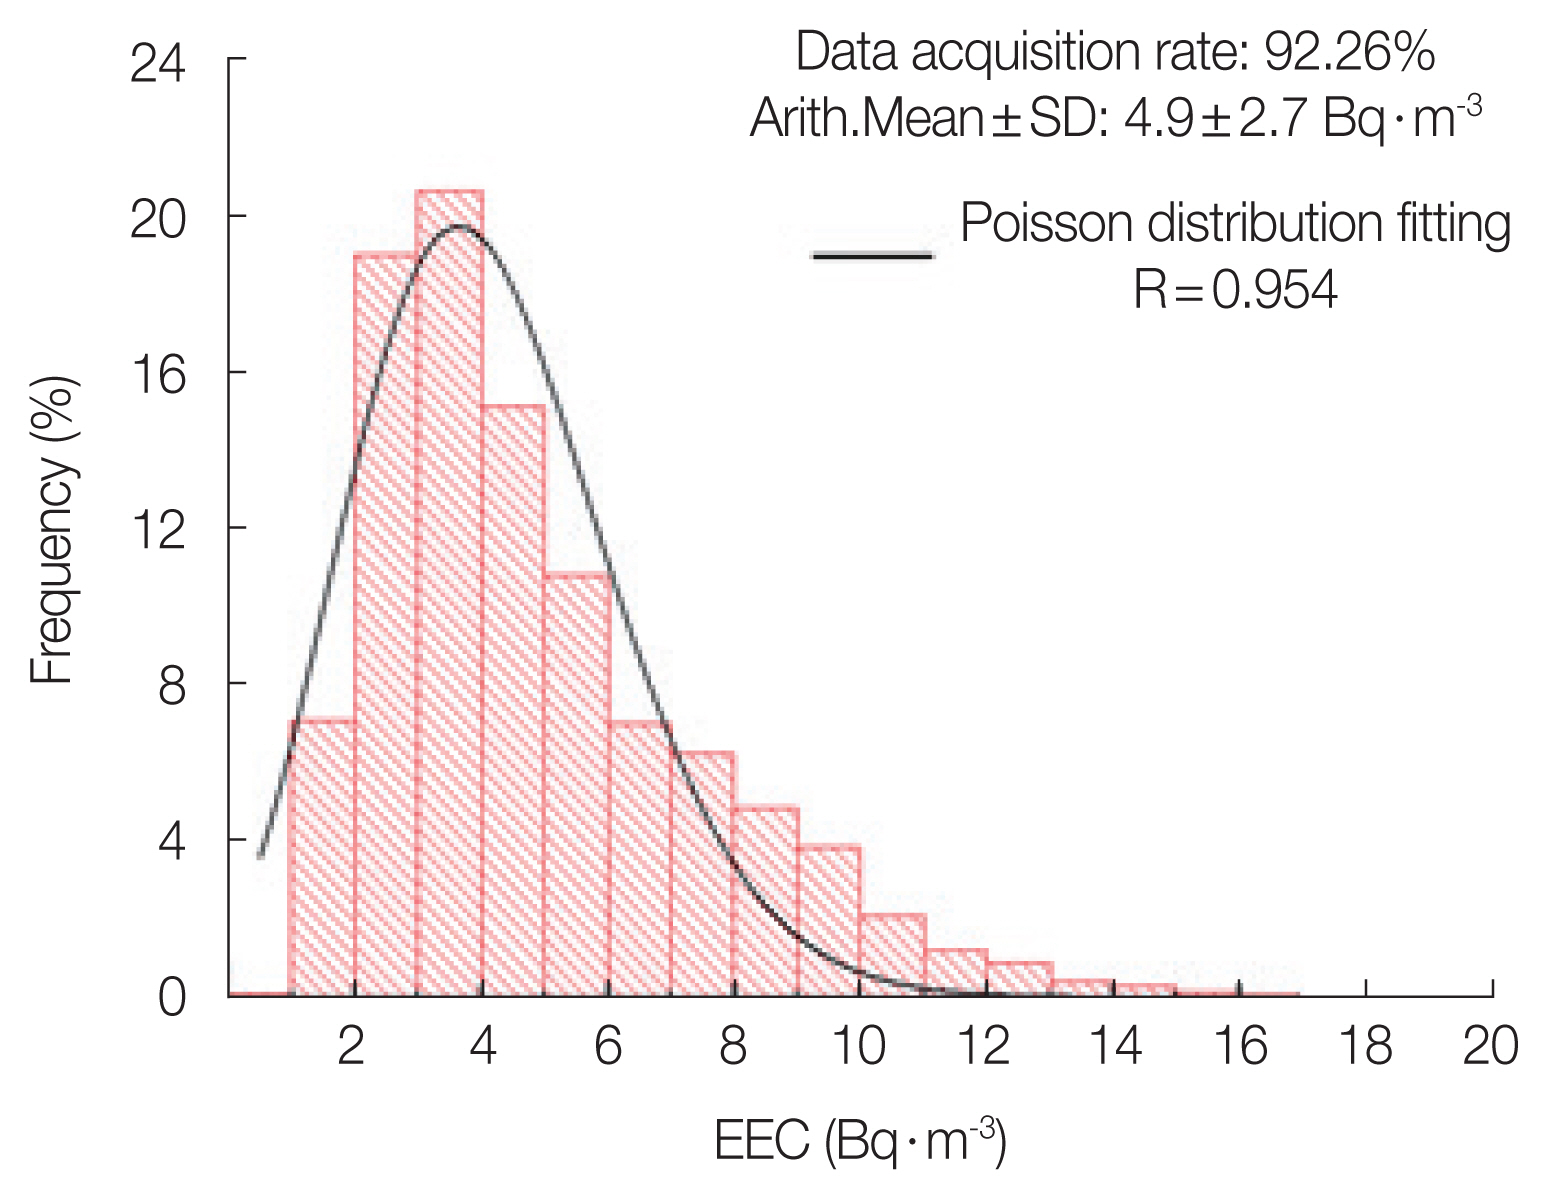
The frequency distribution of equivalent equilibrium concentration (EEC) from October 2018 to September 2019. SD, standard deviation.
2. Diurnal Variation
For the purpose of studying the diurnal variation of EEC, the measurement results of each hour over the observation period are statistically analyzed. The results are presented in the form of box-plot in Fig. 4, in which a clear diurnal variation of EEC can be observed. The diurnal minimum has a high frequency to appear in the late afternoon (16:00–17:00) of each day, followed by a maximum in the early hours in the morning (6:00–7:00), which is similar to the reported 222Rn, the mother nuclide’s behavior worldwide [8, 14, 15].
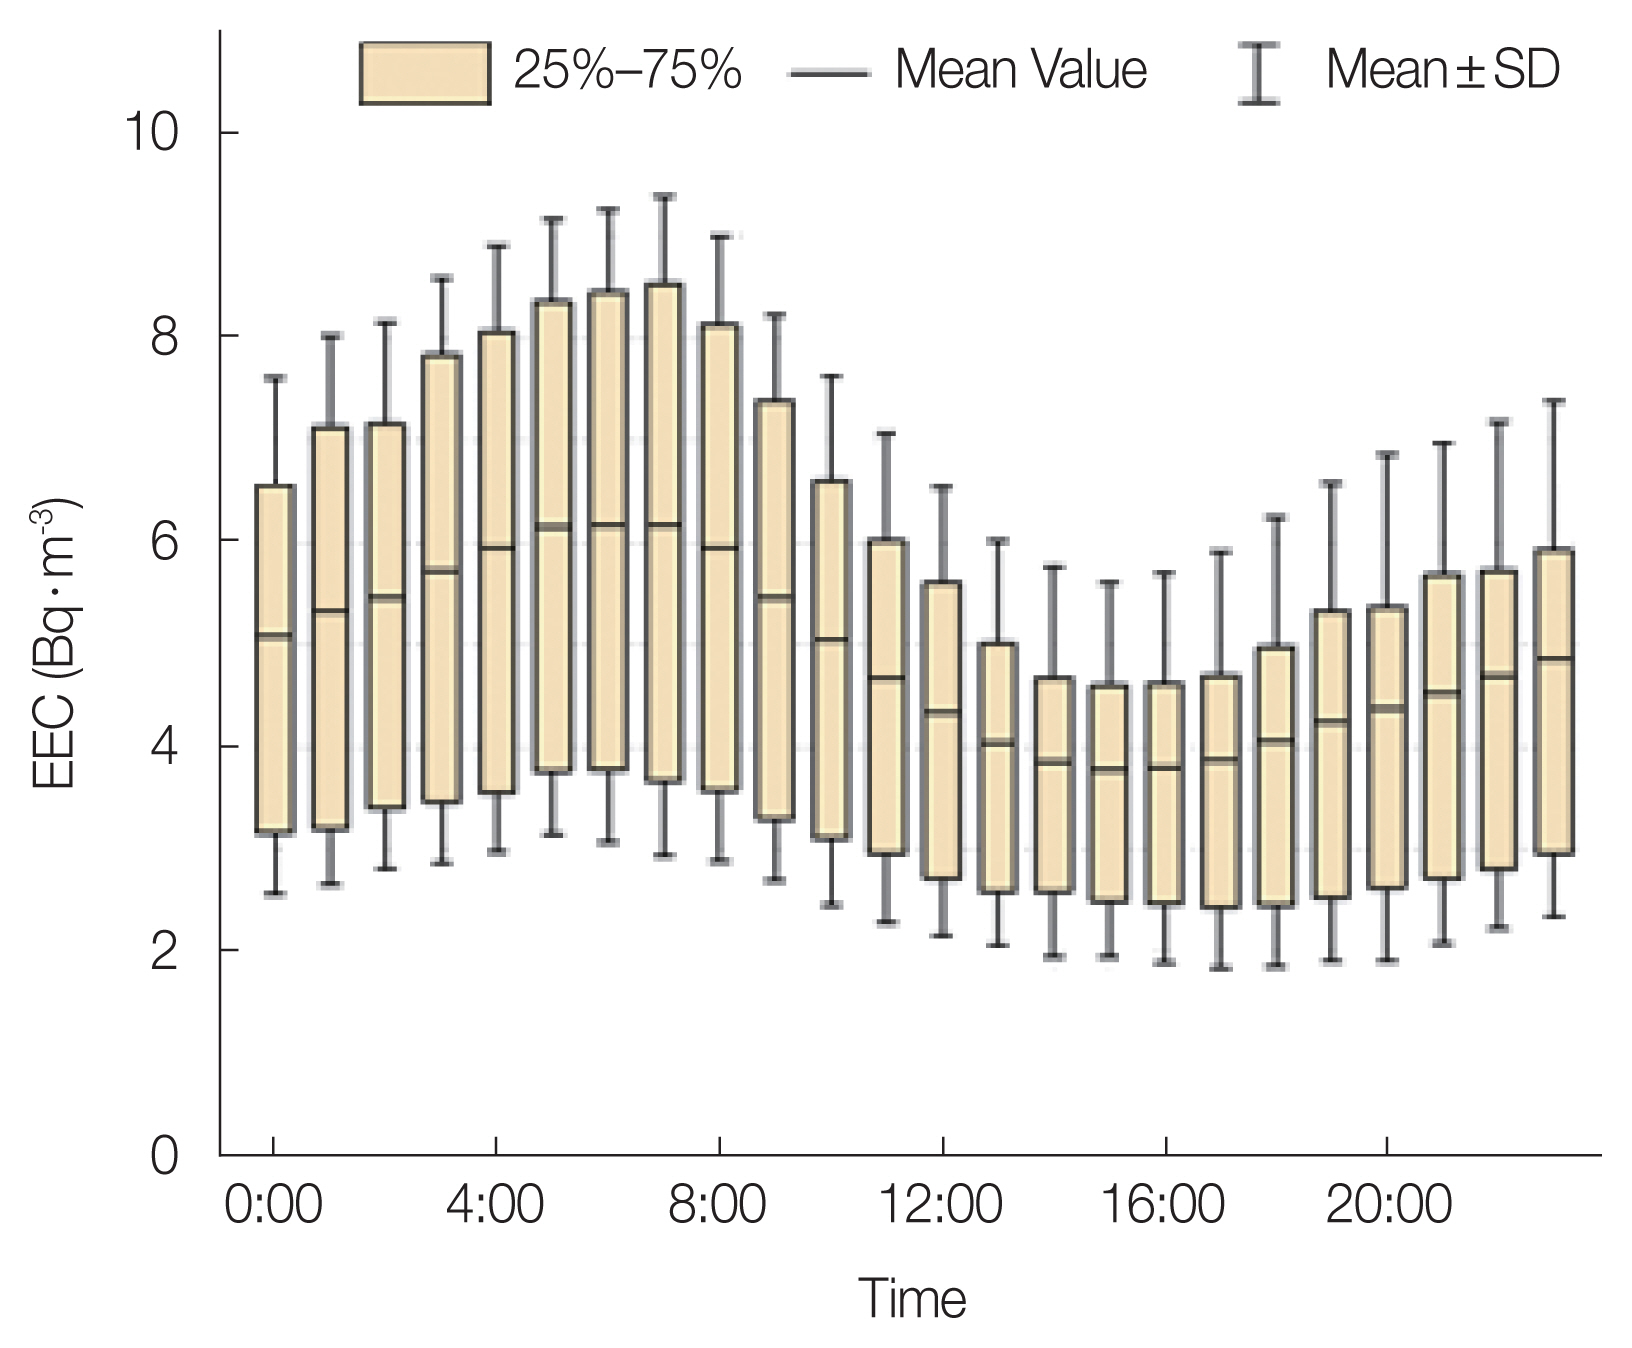
Diurnal variations of equivalent equilibrium concentration (EEC) during the measurement period. SD, standard deviation.
Even though the behavior of radon progeny in outdoor environment is not fully understood due to the limited long-term investigation on it as mentioned in previous, the similar diurnal variation of radon and its progeny observed by this study is reasonable and easy to understand according to the decay chain of them, especially the rather short half-life of radon decay products. As the explanation for radon gas behavior, this phenomenon can be attributed to the vertical convection of low layer air mass near the ground surface, which is dominated by the change of ground temperature.
3. Annual Variation
To observe the annual variation of EEC, average concentration of each month was calculated and the result is shown in Fig. 5. It can be seen that in Beijing area, EEC is higher in the Spring, April and May, lower in late Autumn and early Winter, November and December, which shows the same behavior as 222Rn’s annual variation observed in the area [8]. Differing with diurnal variation, in which the same variation is observed worldwide, annual variation of radon and its progeny in outdoor environment appears more local characteristics. For example, in central Italy, the highest concentration appears in Winter and the lowest one appears in Summer [14].
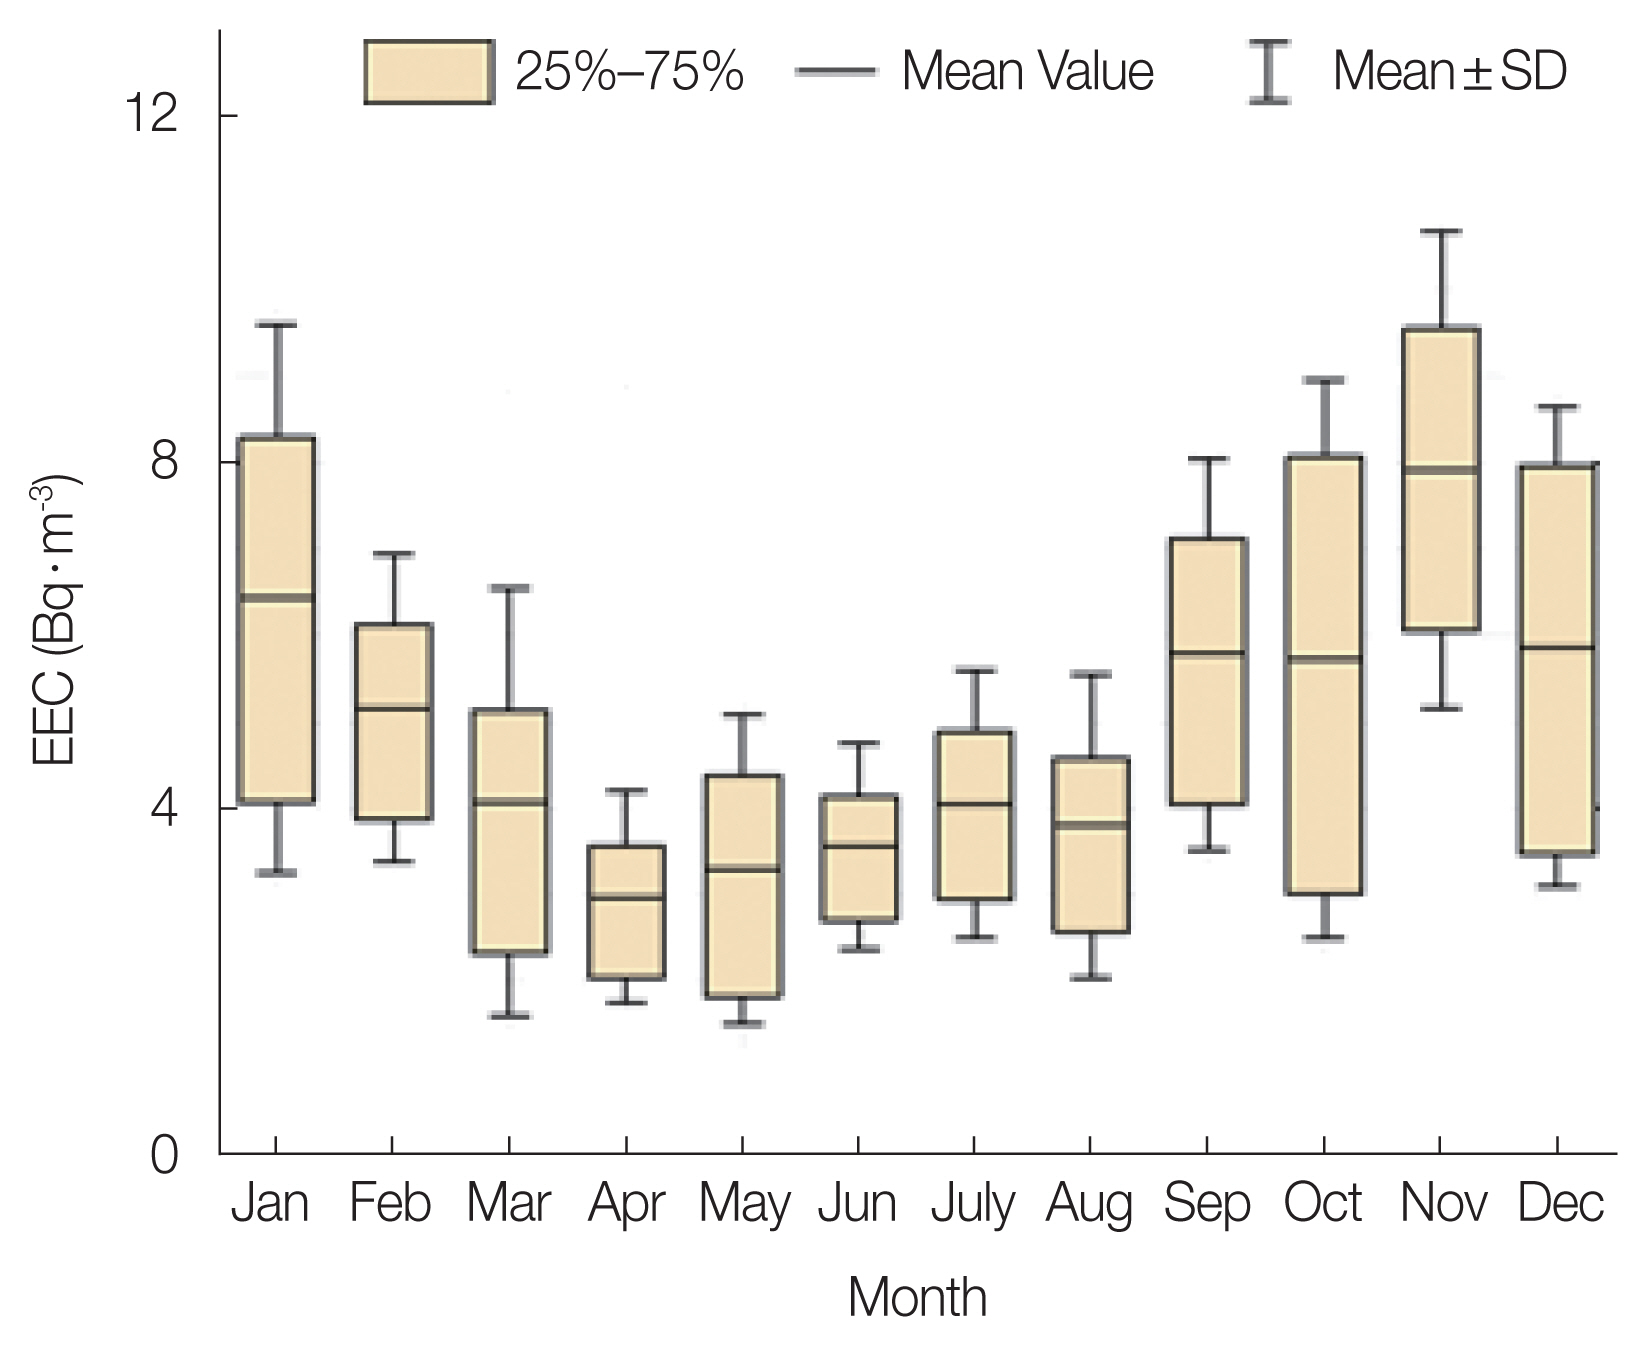
Monthly average of equivalent equilibrium concentration (EEC) during the measurement period. SD, standard deviation.
The concentration level of radon and its progeny is affected by many factors, including both meteorological factors and some pollution related factors, like particle concentrations, where a weak positive correlation of radon progeny and PM2.5 was observed in Beijing years ago when PM2.5 pollution occurs frequently [7].
As introduced at the beginning, there is a high frequency of windy weather in spring in Beijing area, which makes atmospheric stability lower than the other seasons. On the contrary, the atmospheric stability is higher during late Autumn and early Winter, causing less diffusion of air mass, making the concentration of air pollutants higher. This is also the reason that severe air pollution frequently occurs in this period.
Conclusion
The concentration of both radon and its progeny in outdoor environment is dominated by many factors, and it varies at any time with large variety. There is no doubt that long time field observation based on continuous measurement is an effective way to help us understand the variation and their related environmental factors. Continuous measurement on EEC is usually more complicated and with higher cost comparing with that of 222Rn. The good performance on one-year observation of the portable SAF monitor shows the progress and reliability of this measurement technology.
One-year observation on the concentration of radon progeny in outdoor environment in Beijing area shows that the annual average of EEC is 4.9±2.7 Bq·m−3, varying in a large range. A clear diurnal variation of EEC, higher in the early morning and lower in the late afternoon, is observed, and for annual variation, the lowest monthly average of EEC appears in April, while the highest one appears in November, which might attribute to the atmospheric stability in different seasons.
The long-term continuous measurement on concentration of radon and its progeny throughout a year can contribute a lot on our knowledge on their levels, behavior and correlation with related environmental factors in outdoor environment. As the second phase of our research project, a small metrological station is installed in our monitoring station, continuous measurements on radon and its progeny, PM2.5 concentration and gamma ray dose rate are ongoing.
Acknowledgements
This work is supported by the National Natural Science Foundation of China (No. 11975310).
Notes
Conflict of Interest
No potential conflict of interest relevant to this article was reported.
Author Contribution
Data curation: Wang Y. Formal analysis: Wang Y. Funding acquisition: Zhang L. Methodology: Zhang L. Project administration: Guo Q. Investigation: Wang Y. Supervision: Guo Q. Writing-original draft: Zhang L. Writing-review & editing: Guo Q.