Preliminary Study on Rapid Measurement of Gross Alpha/Beta and 90Sr Activities in Surface Soil by Mobile ZnS(Ag)/PTV Array and Handheld PVT Rod with Gated Energy Channels
Article information

Abstract
Background
Surface soil radiation monitoring around nuclear facilities is important to classify and characterize the contaminated areas. A scanning and direct measurement technique can survey the sites rapidly before starting sampling analysis.
Materials and Methods
Regarding this, we test and suggest a measurement technique for gross alpha/beta and 90Sr activities in surface soil based on a mobile ZnS(Ag)/PVT (polyvinyltoluene) array and a handheld PVT rod, respectively. To detect 90Sr selectively in soil mixed with naturally occurring radioactive materials, chosen energy channel counts from the multichannel analyzers were used instead of whole channel counts. Soil samples contaminated with exempt liquid 90Sr with 1 Bq·g−1, 3 Bq·g−1, and 10 Bq·g−1 were prepared and hardened by flocculation.
Results and Discussion
The mobile ZnS(Ag)/PVT array could discriminate gross alpha, gross beta, and gamma radiation by the different pulse-shaped signal features of each sensor material. If the array is deployed on a vehicle, the scan minimum detectable concentration (MDC) range will be about 0.11–0.17 Bq·g−1 at 18 km·h−1 speed, highly sensitive to actual sites. The handheld PVT rod with 12 mm (Φ)×20 mm (H) size can directly measure 90Sr selectively if channels on which energies are from 1,470 and 2,279 keV are gated, minimizing cross-detection of other radionuclides. These methods were verified by measuring soil samples fabricated with homogeneous 90Sr concentrations, showing static MDC of 2.16 Bq·g−1 at a measurement time of 300 seconds.
Conclusion
Based on the results, comprehensive procedures using these detectors are suggested to optimize soil sites survey.
Introduction
Soil constitutes various types of natural radionuclides, called naturally occurring radioactive material (NORM), that emit alpha, beta, and gamma radiation. However, natural soil can be contaminated with artificial radionuclides (e.g., 134Cs, 137Cs, 60Co, 131I, 90Sr, etc.) by nuclear power plant accidents [1, 2] or nuclear weapons tests [3, 4]. For the assessment of such contamination, radiation detection is required. Depending on the ionizing radiation nature for different types, appropriate detection techniques are used. Because alpha and beta particles with rest mass have positive or negative charges, in contrast to massless gamma-ray photons, their penetration capability in the matter is weak, where their ranges are short until absorption, unlike the gamma-ray with the same energy, which gets attenuated exponentially in matter. The Bethe formula, for example, governs the stopping power of alpha and beta particles [5] and the energy loss rate as a function of length in an absorber. Also, the expected ranges of alpha and beta particles can be scaled using approximated derivation for different energy and absorbers. For the NORM of our concern, consisting of 238U series, 232Th series, and 40K [6], maximum alpha, beta, and gamma radiation energies are represented in Table 1 [7].

To survey nuclear sites comprehensively, the areas where contamination has occurred, and the depth of contamination should be profiled fairly. Additionally, the concerned artificial radionuclides affecting the public in different doses should be discriminated. Soil samples from Chernobyl and Fukushima accidental sites were investigated by researchers in this regard [1–3, 8–11]. For a more efficient and effective survey, our team suggested on-site measurement techniques for alpha, beta, and gamma activity in surface soil. For example, Lee et al. [12] developed a vehicle-based mobile scanning system of gross alpha/beta and gamma activities, using five ZnS(Ag) and polyvinyltoluene (PVT) phoswich detectors (Fig. 1) and a gamma-ray spectrometer comprising two NaI(Tl) surrounded by PVT, respectively. As described in Fig. 1, specifically, commercial handheld alpha/beta radiation detectors (model CS170; Coliy Group, Shenzhen, China) with 200 ns decay time were arrayed. ZnS(Ag) phosphor was applied to each detector onto a polyethylene terephthalate (PET) sheet of 0.25 mm thickness, which was sufficient for beta particles to enter it nearly without energy loss.

Array of five commercial ZnS(Ag)/PVT detectors. (A) Front and underside view of the individual detector. (B) Detector array with the controller. PMT, photomultiplier tube; PVT, polyvinyltoluene; PET, polyethylene terephthalate.
The performance of the gamma-ray spectrometer was successfully tested in cases of timely detecting, tracking hotspots, and estimating depth profiles [12]. When potentially contaminated areas were scanned and hotspots with higher radioactivity levels were detected, rapid quantitative analysis of gamma radionuclides would be conducted by direct measurement of hotspots.
Using the same approaches as above, alpha/beta scanning would be possible only when the system moves at a constant speed. However, due to their abovementioned short ranges, self-absorption effects of alpha/beta particles in soil render depth profiling difficult on the soil surface. Accordingly, Bae and Kim [13] designed a direct measurement method for beta particles in soil with depth up to 0.1 m using a 12 mm (Φ)× 20 mm (H) size PVT scintillator. The scintillator is interconnected to a photomultiplier tube (PMT) using the same diameter 12 mm (Φ)×100 mm (H) poly(methyl methacrylate) (PMMA) rod as a light guide, thus enabling the insertion of a rod to a certain depth.
Although gross alpha/beta activity in a contaminated site may show valid results statistically by comparing them with the background level, 90Sr is an important artificial radionuclide that should be evaluated separately from others. The amount of 90Sr generated during nuclear activity is significant, and many nuclear-decommissioning projects listed it as one of the derived concentration guideline levels (DCGLs) for radionuclides [14–16].
Therefore, in this study, we evaluated the scanning and direct measurement capability of gross alpha/beta activity using the devices developed by us and suggest a unique method to measure selective 90Sr concentration. Specifically, in the Materials and Methods section, the general survey process and goal for potentially contaminated nuclear sites based on the regulations are described. Evaluation methods of scanning and direct measurement are explained for each of the mobile ZnS(Ag)/PVT array and the handheld PVT rod. Based on optimized timelines and conditions, results and discussions are presented, and finally, the concluding remarks are given in the last section.
Materials and Methods
1. Existing Manual: Site Classification and Characterization
1) Classification
The Multi-Agency Radiation Survey and Site Investigation Manual (MARSSIM) (NUREG-1575, Revision 1), which was developed to provide the industry standard for decommissioning surveys, guides historical site assessment, scoping, and characterization of final status surveys [17, 18]. Initially, the decommissioning areas are classified based on potential existence and levels of identified residual contaminants. Here, the DCGLs are dose-based release criteria for site classification and are determined by site-operating history and radiation survey judgement. The DCGLs can be gross beta or gamma activity or specific radionuclides including 90Sr, thus of interests in this study.
2) Characterization
After classification, the areas would be subdivided into survey units using the guidance of MARSSIM. Survey units, ranging from 2,000 to ≥10,000 m2 for land areas, are specified physical areas on which decision to site release will be separately made. Each survey unit should be characterized via survey activities, including surface scanning, activity and exposure rate measurements, and sampling [17]. Among survey activities, scanning and direct measurement are conducted sequentially on site, and the detectability is highly dependent on the scan speed and measurement time, respectively. It is important that static and scan (for beta emitters) minimum detectable concentrations (MDCs), as in Equations (1) and (2) [12, 17, 18], which are quantitative measures of the measurability, should be lower than the DCGLs (gross or radionuclide-specific) in scanned areas for appropriate decision making.
where CB is the background count in time T; ɛ is the efficiency for unit mass or surface concentration (in g−1 or m−2); T is the measurement time (in second); d’ is the sensitivity index; CB,i is the background counts for observation interval i; p is the survey efficiency; and i is the observation interval (i.e., assumed hotspot size/scan speed) (in second).
Specifically, it is recommended that static MDC should be approximately 10%–50% of the DCGL [18]. The abovementioned vehicle-based mobile scanning system in the Introduction section, for example, could track contaminated areas with gamma emitters during scanning at constant speed of <10 km·h−1, by comparing gamma dose rate and spectrum data between each side NaI(Tl) detector [12].
2. Methods
1) Mobile ZnS(Ag)/PVT array: gross alpha/beta scanning and direct measurement
In addition to the gamma-ray spectrometer of the vehicle-based scanning system [12], the performance of mobile ZnS(Ag)/PVT array was tested to find hotspots contaminated with alpha and beta emitters. Since a total of five alpha/beta phoswich detectors are in an array, the same number of representative check sources for alpha, beta, and gamma sources (210Po, 90Sr, and 137Cs, respectively) were located at distances of up to 100 mm, which is the minimum possible distance for scanning in realistic cases to avoid physical collisions with the ground at different slopes and curvatures over distances. Distances over 100 mm were excluded because we assumed a situation where direct measurement techniques would be adopted right after vehicle-based scanning at a distance as low as 100 mm.
The array was then calibrated as a function of source-detector distance. Since the ZnS(Ag) is used to detect alpha emitter and PVT to detect beta emitter, the data recorded in each sensor after pulse discrimination were compared. The counts collected from the five detectors were averaged for analysis. Their uncertainty was evaluated based on error propagation rules because mm-scale changes in the distance of the detector are sensitive to the counts, where alpha and beta radiation have short ranges. After calibration of response functions, scan MDCs, considering representative MARSSIM examples as 95% true positive and 60% false positive rates (d’=1.38) and p-value of 0.5 were calculated and compared with the preliminary DCGL values of South Korea’s Kori-1 nuclear power plant (NPP) [14]. The array was further demonstrated by the identification of randomly located check sources. Fig. 2 depicts the test procedures for mobile ZnS(Ag)/PVT detectors.
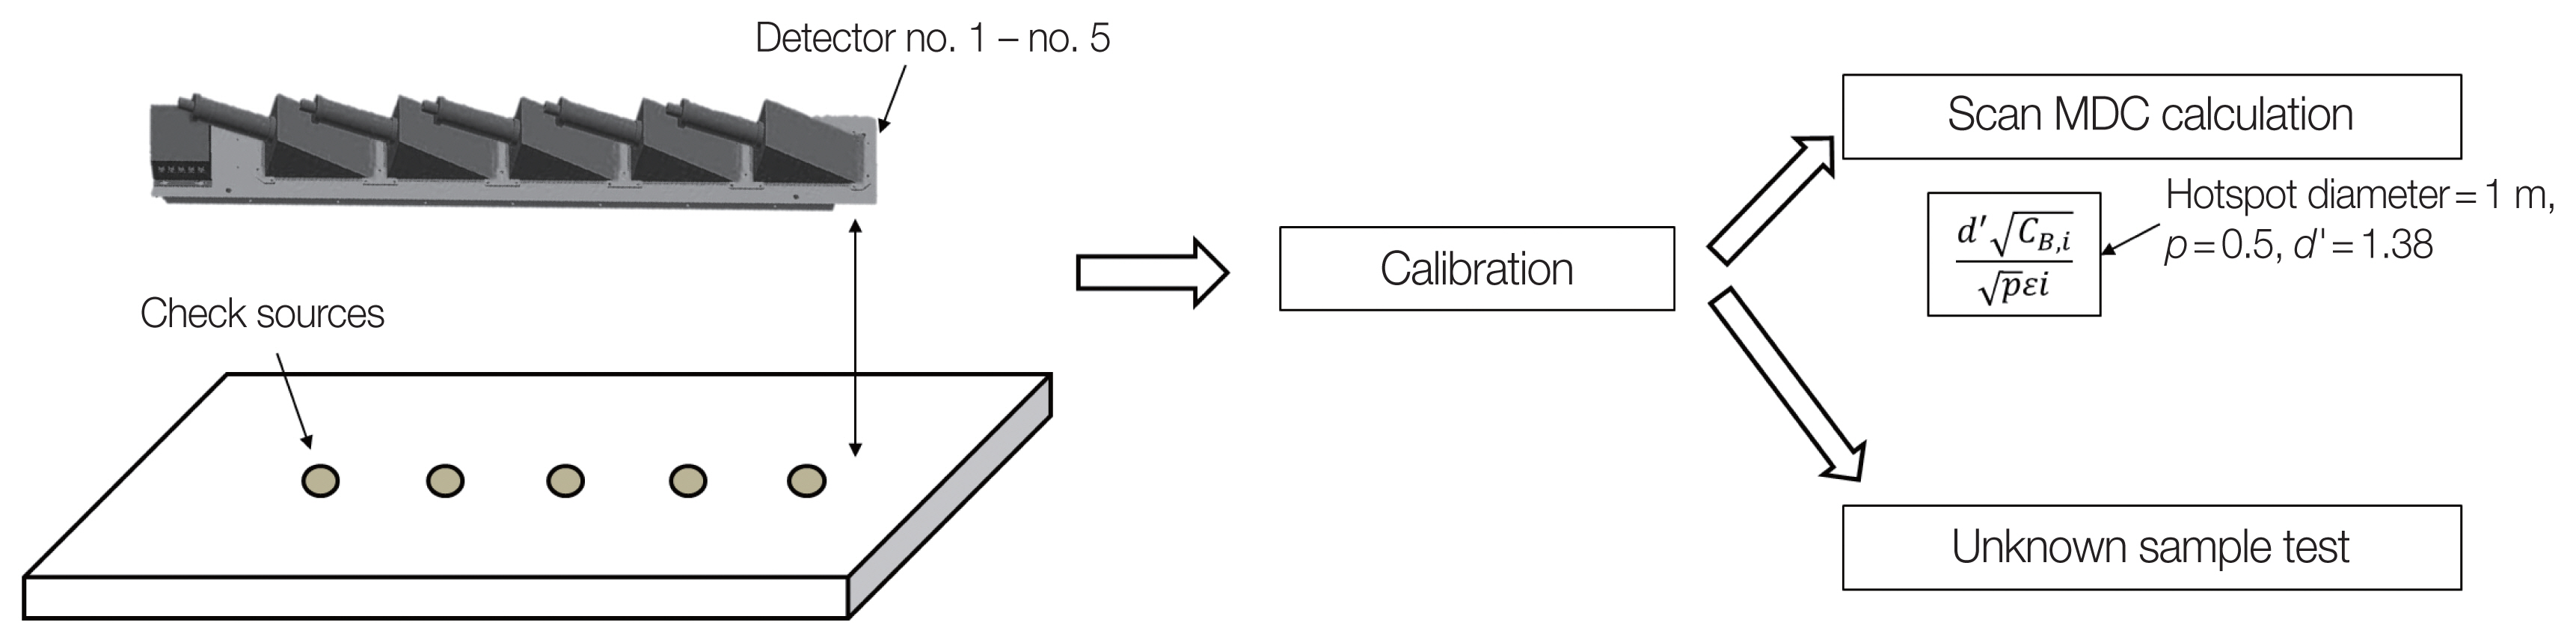
Test procedures for mobile ZnS(Ag)/PVT array. MDC, minimum detectable concentration; PVT, polyvinyltoluene.
2) Handheld PVT rod: 90Sr direct measurement
As shown in Fig. 3, the handheld PVT rod consists of the commercial multichannel analyzer (MCA) (digiBASE; ORTEC, Oak Ridge, TN, USA) and PMT (R878; Hamamatsu, Shizuoka, Japan) to obtain a signal from the PMMA light guide connected to the PVT crystal. The crystal and light guide were coated by a total of 0.8 mm thickness PTFE (polytetrafluoroethylene) with 0.3 mm of light-reflective white tape and 0.5 mm of light-absorbing black tape and are optically coupled to the PMT by an epoxy resin with refractive index of 1.56 (BC-600; Saint-Gobain Crystals, Hiram, OH, USA), close to those of PVT and PMMA. Because of the PTFE coating, the natural and artificial alpha particles would not penetrate the PVT rod. Two types of experiments were conducted by using a handheld PVT rod; test with check sources in air and with homogenous 90Sr samples in soil.
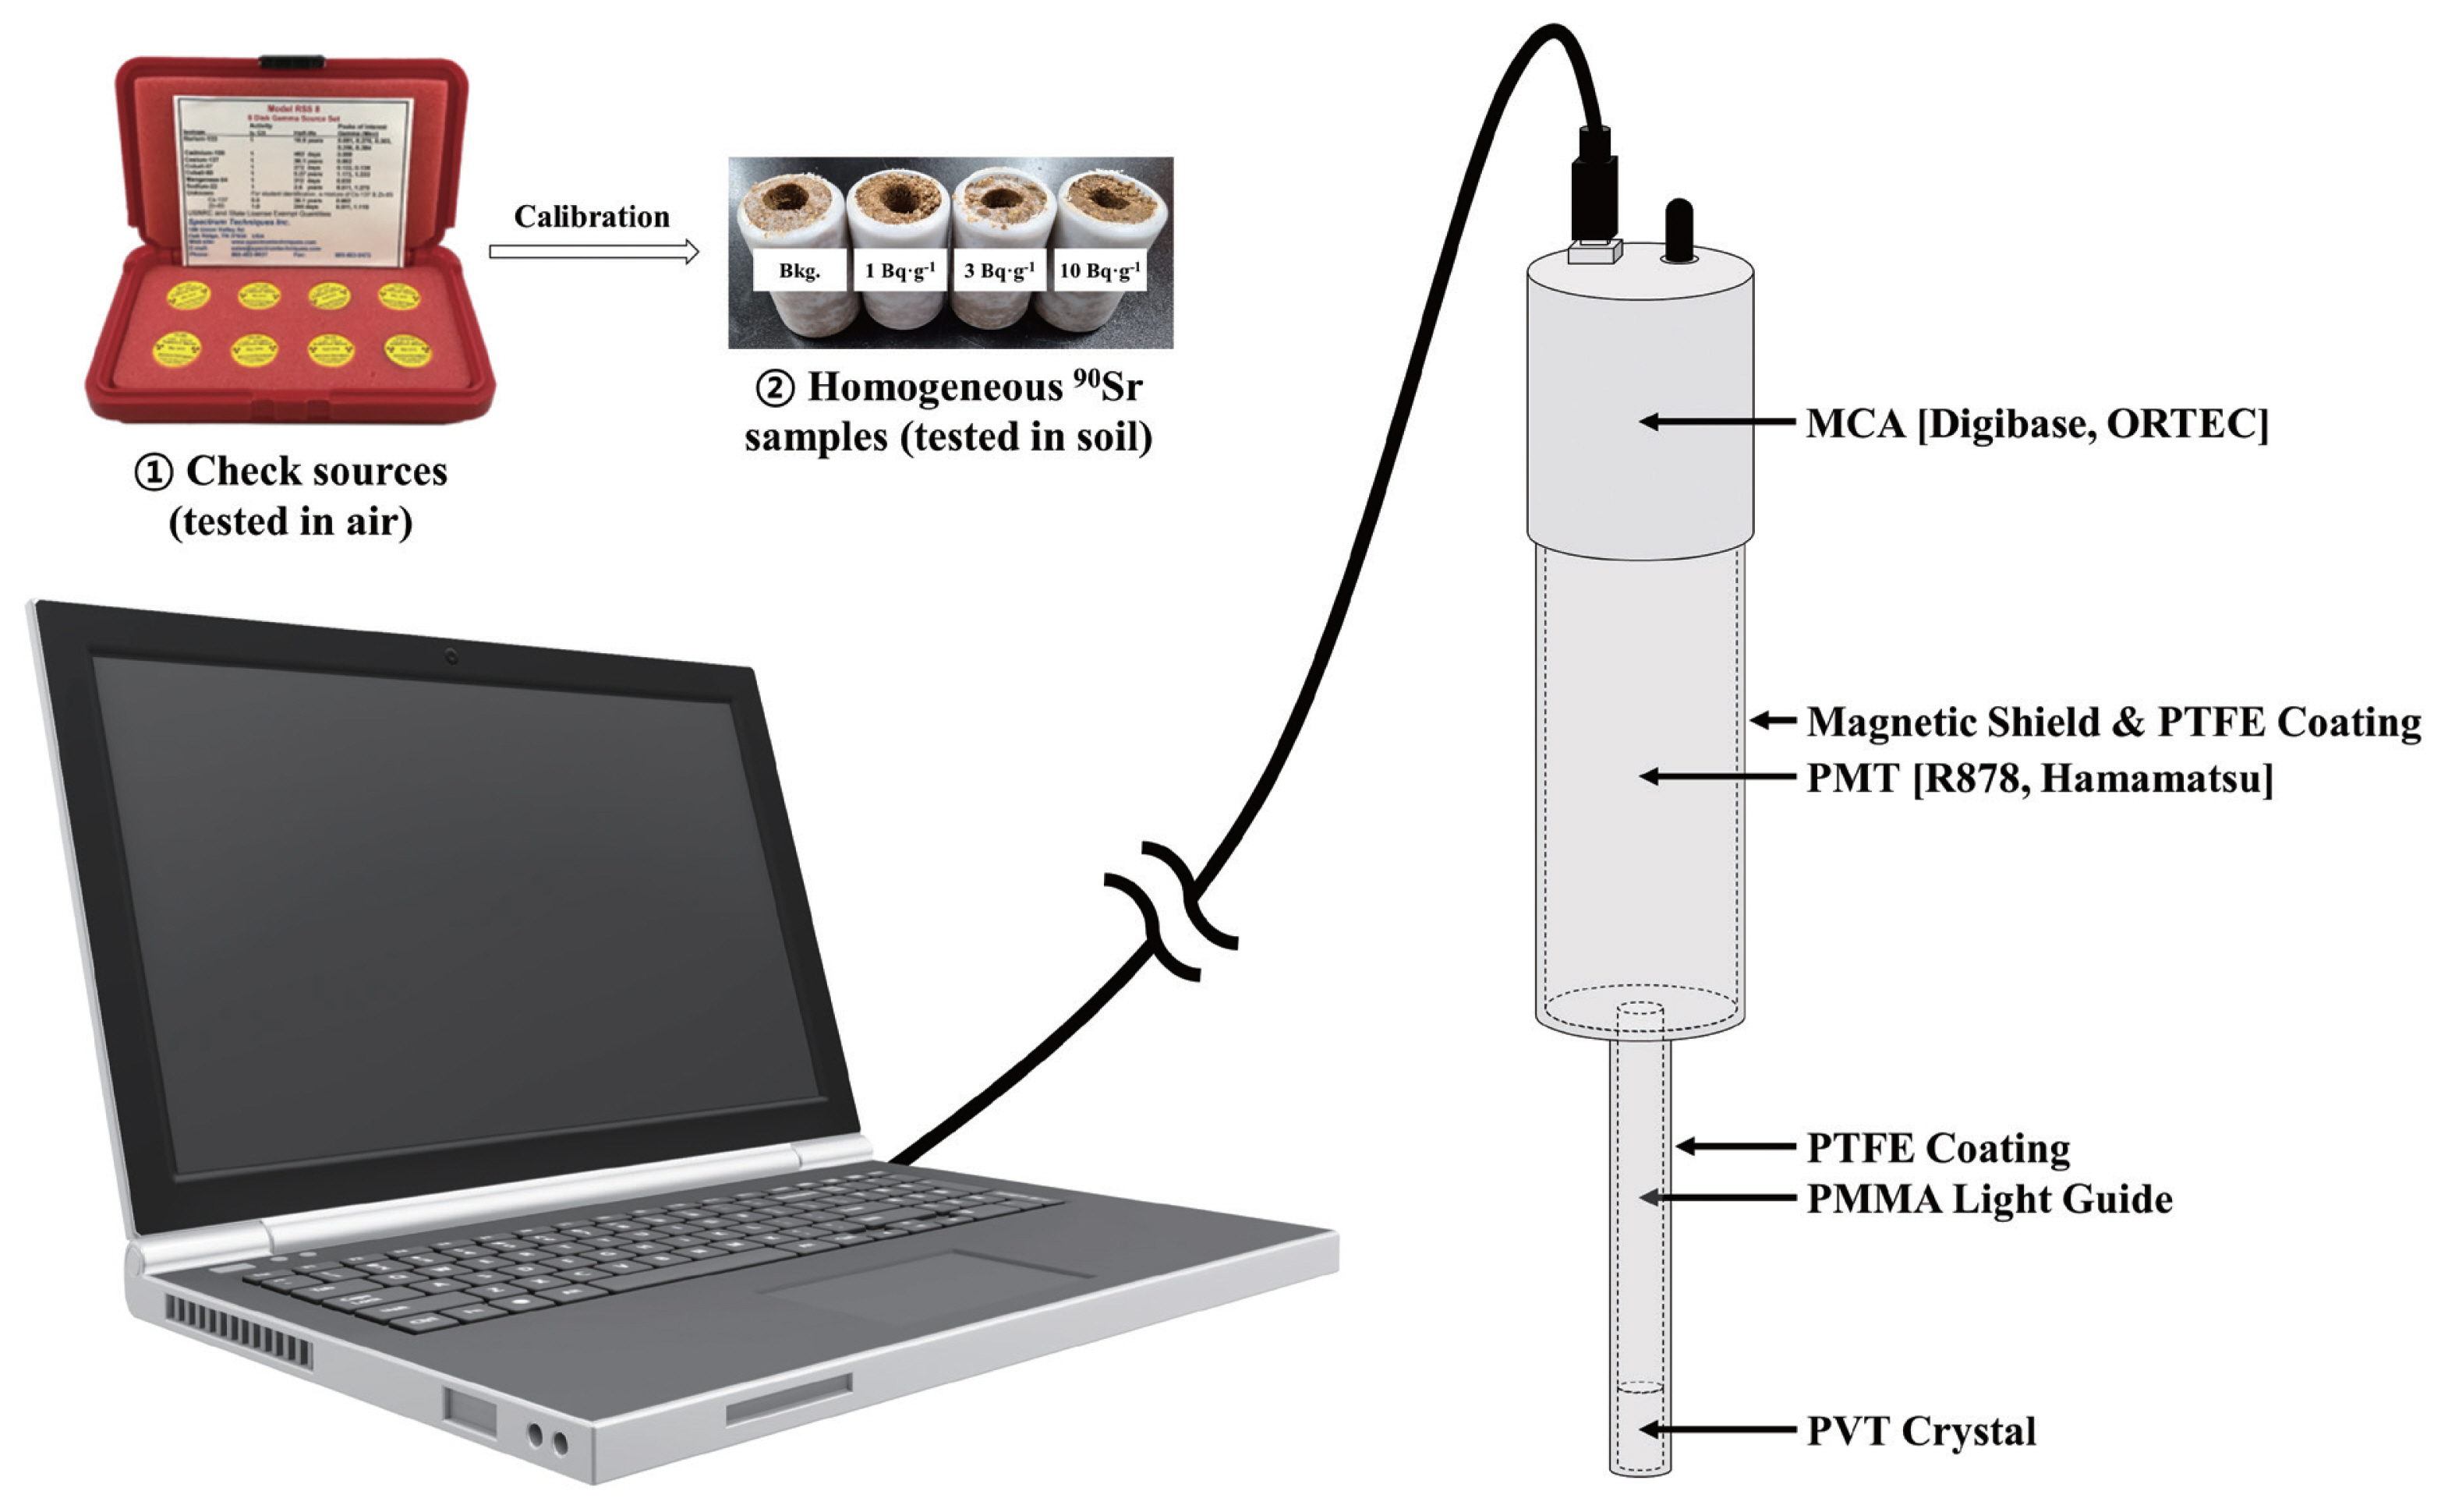
Test procedures for handheld polyvinyltoluene (PVT) rod. MCA, multichannel analyzer; PTFE, polytetrafluoroethylene; PMT, photomultiplier tube; PMMA, poly(methyl methacrylate).
Before the measurement of soil samples for radioactivity, the handheld PVT rod was tested in the air with existence of different beta and gamma check sources. Especially, 90Sr, 137Cs, 60Co, 152Eu, and 204Tl check sources were measured for 180 seconds by locating them at 10 mm distance from the detector. Then, the channel numbers versus the radiation energy for each emitter were calibrated to determine the effective selection of energy channel that can selectively allow the signals of 90Sr other than NORM. Specifically, among the NORM in Table 1, we assumed that the 40K, having a lot of abundances in soil compared to uranium (U) and thorium (Th) series [19], would be the most interfering radionuclide from solely measuring beta particles from 90Sr. For the channels selection to be gated, we neglected the relatively small contributors such as 234mPa, 214Bi, 210Tl, 228Ac, high energy cosmic rays, and intrinsic radiation.
The three homogeneously contaminated samples with 90Sr radioactivity concentrations of 1, 3, and 10 Bq·g−1 were fabricated in addition to the background soil sample without the addition of contaminants. Regarding that, a 16 mm (Φ)× 100 mm (H) acrylic rod was fixed at the center of a 45 mm (Φ)× 70 mm (H) plastic cylinder to make a hole, where the handheld PVT rod would be inserted for direct measurement: In the actual case, the soil that removed to make a hole (approximately 20 g) would be sampled during direct measurements and analyzed in a laboratory as recommended by the MARSSIM. To harden soil samples by flocculation, NaCl, NaOH, polyacrylic acid, and poly (diallyldimethylammonium chloride) (20 wt% in H2O) were mixed together with weight fractions of 6:1:7.5:50. Then, distilled water containing an exempt amount of 90Sr open sources was added with the same amount of the mixtures and were stirred with soils by weight fractions of 1:3 [20], and poured into a plastic cylinder. After 7 days, acrylic rods inserted in center were removed.
Once the effective energy channels were determined, we measured efficiency and static MDC values for 90Sr counts in soil samples, acquired for approximately 300–3,000 seconds from gross channels and gated channels. ORTEC MAESTRO software was used for spectra analysis, and relevant conditions of the PMT and the MCA for handheld PVT rod are represented in Table 2.
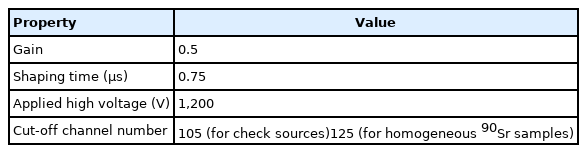
Test Conditions for the Photomultiplier Tube (PMT) and the Multichannel Analyzer (MCA)
Results and Discussion
1. Mobile ZnS(Ag)/PVT Array
In Fig. 4, efficiency data recorded using the ZnS(Ag) sensor indicated that the sensor was sensitive to both the alpha emitter (210Po) and the beta emitter (90Sr). On the other hand, the beta from 137Cs, whose maximum beta energy is relatively low, 512 keV, could not be identified after intrinsic pulse shaping. The 210Po shows a high measurement efficiency of more than 4% at 10 mm, but the efficiency value becomes lower, resulting in the values between the two sources reversed after approximately 20 mm. At a distance ≥approximately 22 mm, the detection of 210Po was impossible below static MDC due to the significant loss of particle energy in the air and detector window.
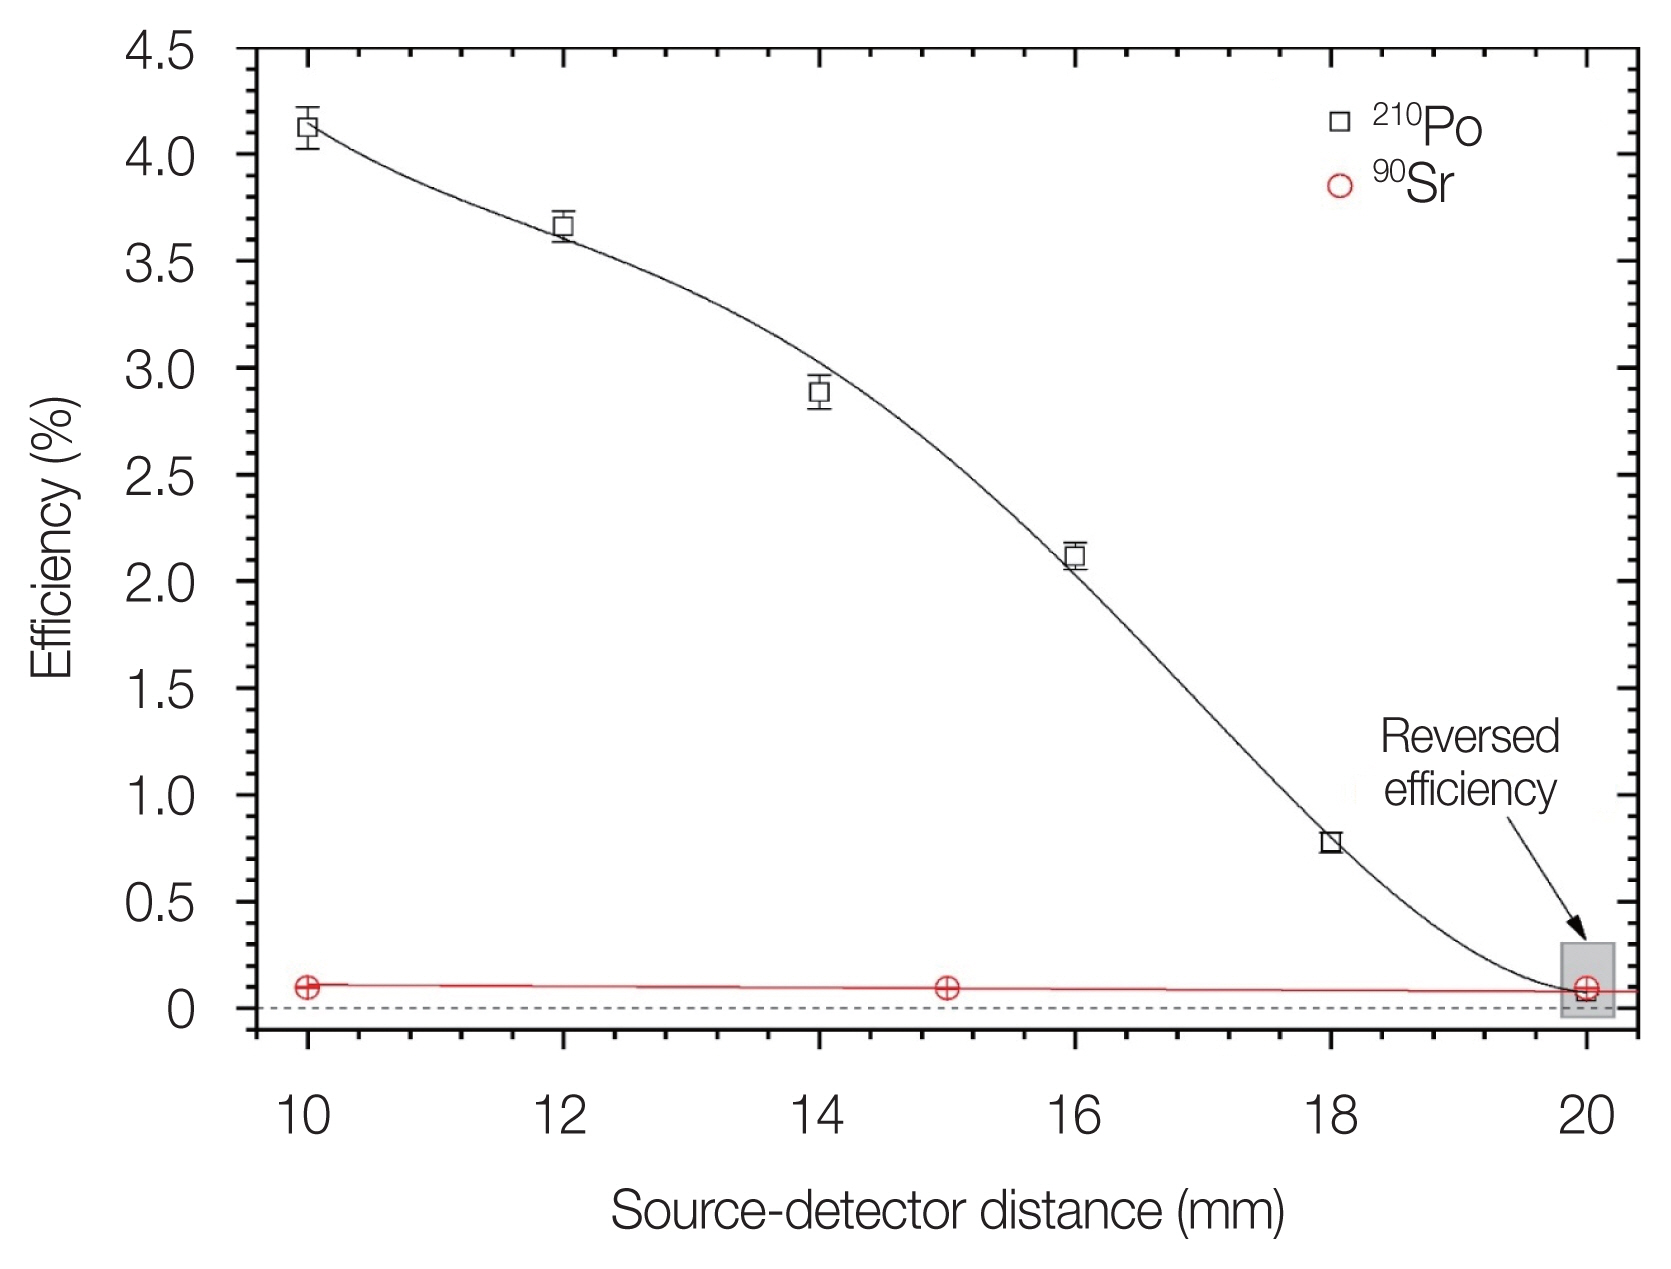
Efficiency curves of ZnS(Ag) sensor on mobile ZnS(Ag)/PVT array as a function of source-detector distance. PVT, polyvinyltoluene.
In the case of the PVT sensor (Fig. 5), all alpha, beta, and gamma sources were sensitive at approximately 20 mm. For our considered source-detector distance, 90Sr showed the highest measurement efficiency among the three sources, and the influence of alpha particles was negligible as in the ZnS(Ag) sensor after 22 mm, around where the Bragg peak region exists.
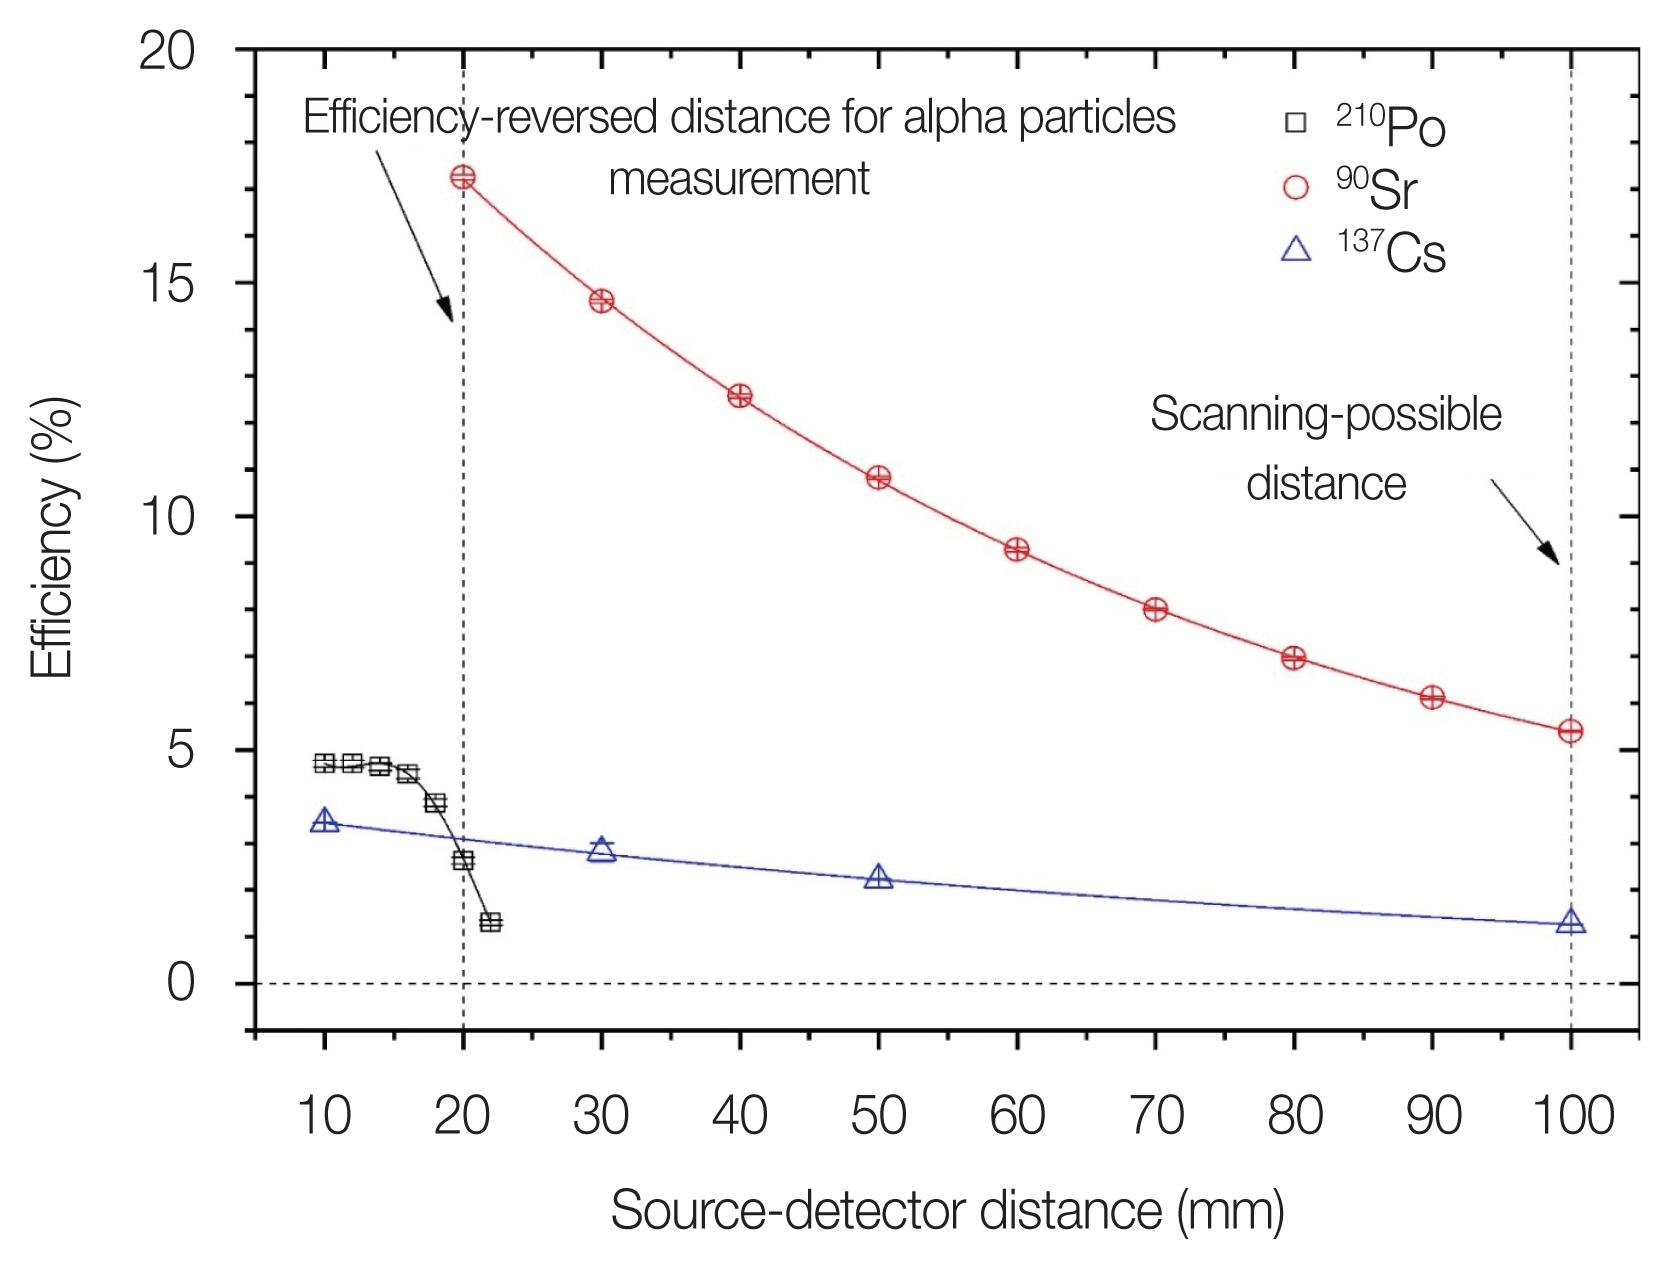
Efficiency curves of PVT sensor on mobile ZnS(Ag)/PVT array as a function of source-detector distance. PVT, polyvinyltoluene.
In addition, based on the efficiency curves of the PVT sensor, the scan MDC of the 90Sr was calculated by assuming soil density and thickness at the distance of 100 mm, as 1,200 kg·m−3 and 0.15 m, respectively, which was the minimum adjustable distance for the actual vehicle to scan without collisions. We considered that 40K, the major contributor to natural radioactivity in soil, is present as background with typical amounts, although other beta emissions from U and Th series can also contribute to the background. Conservatively, we assumed that 40K concentrations of from 0.5 Bq·g−1 to 1.2 Bq·g−1 are distributed only on the surface, and its detection efficiency is same as that of 90Sr. As shown in Fig. 6, the scan MDC range of about from 0.11 Bq·g−1 to 0.17 Bq·g−1 satisfies the 90Sr preliminary DCGLs of Kori-1 NPP for both industrial worker (with ranges of >100 Bq·g−1) and residential farmer scenarios (with ranges of >1 Bq·g−1) [14] with the scan speed up to 18 km·h−1, which is the maximum considered speed for gamma detectors of overall mobile scanning system [12]. Nonetheless, we cannot exactly know the sort of beta-emitting radionuclides in NORM-containing contaminated soil.
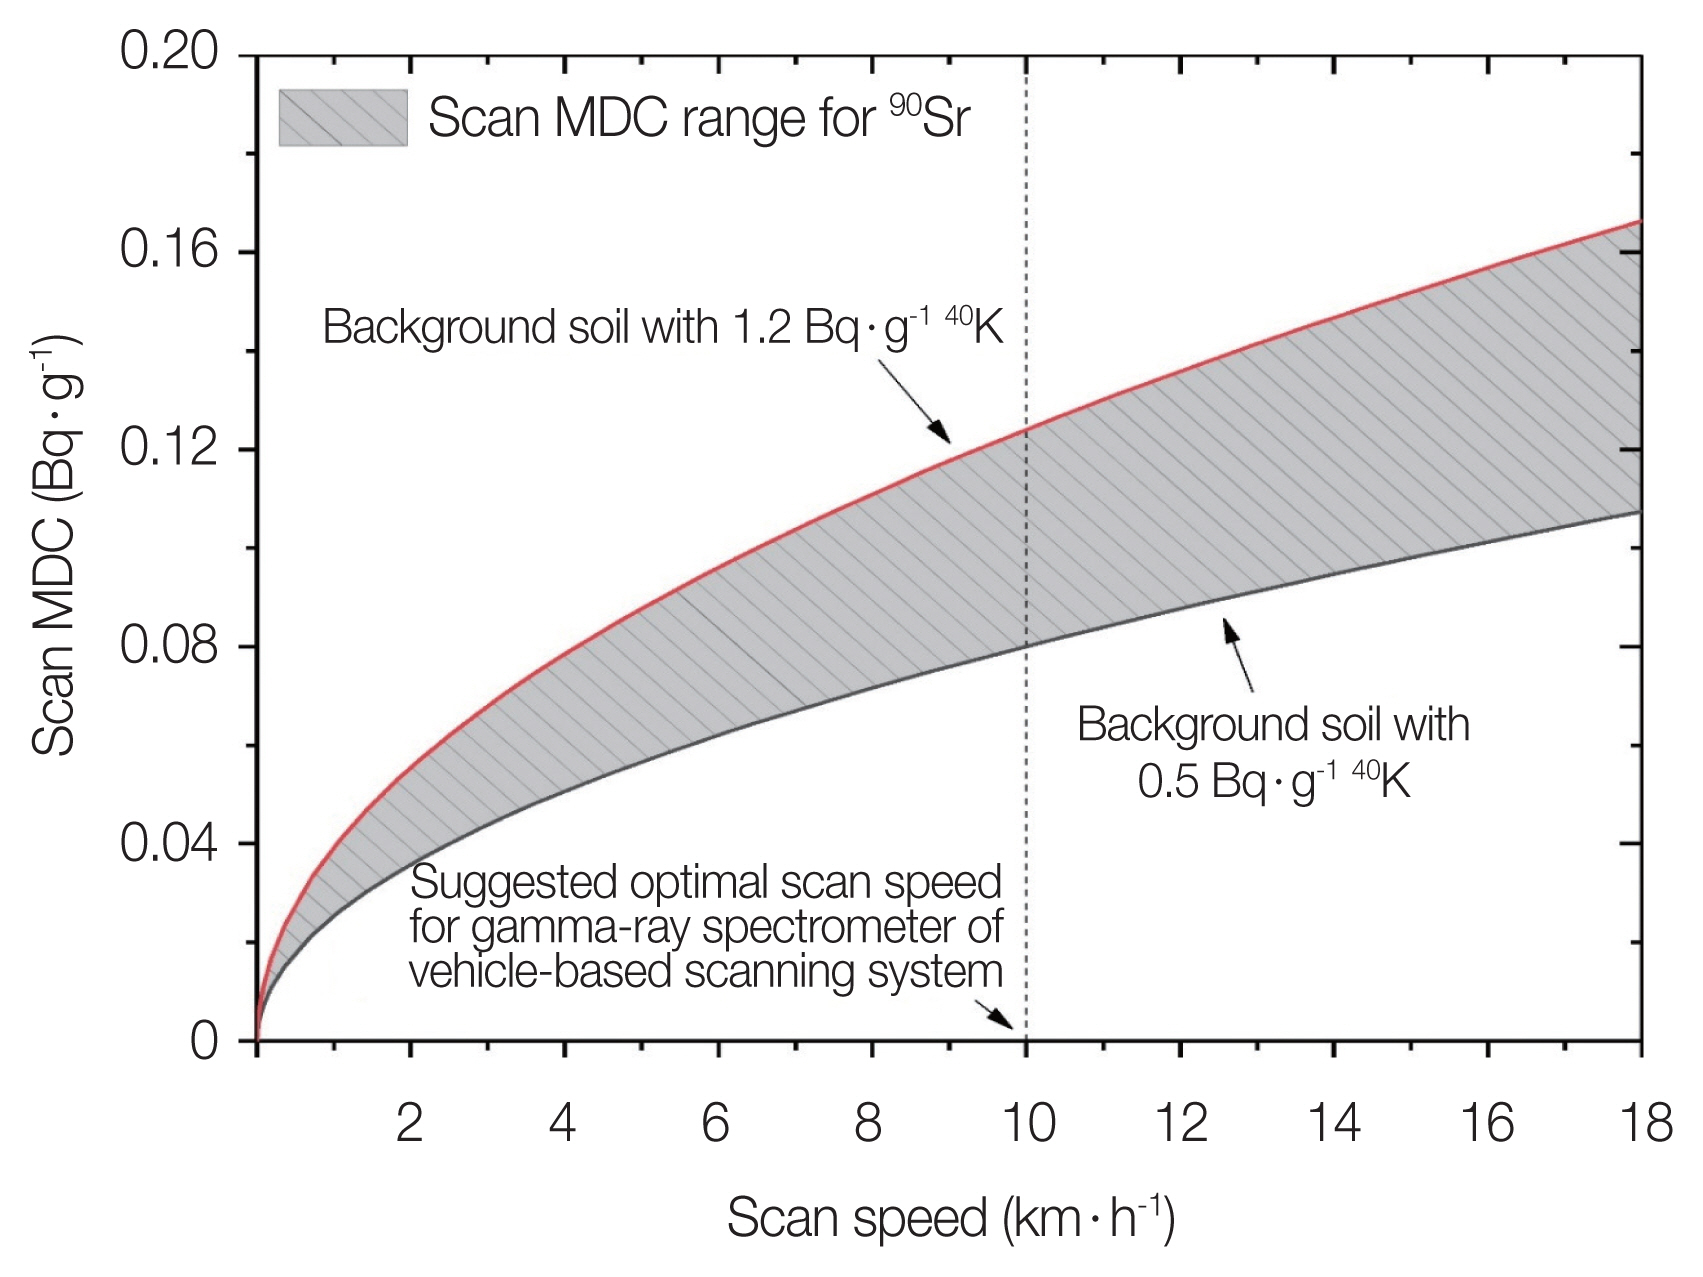
Scan minimum detectable concentration (MDC) of 90Sr for PVT sensor on mobile ZnS(Ag)/PVT array as a function of scan speed. PVT, polyvinyltoluene.
2. Handheld PVT Rod
Fig. 7 shows a linear graph of channel versus radiation energy for beta and gamma emitters. Here, the uncertainties for the PVT with poor energy resolution to identify peak energy were conservatively assumed to be 1.5 full width at half maximum (FWHM), which is usually taken for validation of gamma-ray peak contribution regions [21, 22]. Here, the corresponding PVT energy resolution was set as 18.5% at 662 keV based on Mitchell and Brusseau [23], and Gaussian energy broadening model [24] was used to estimate FWHMs at different energy levels.
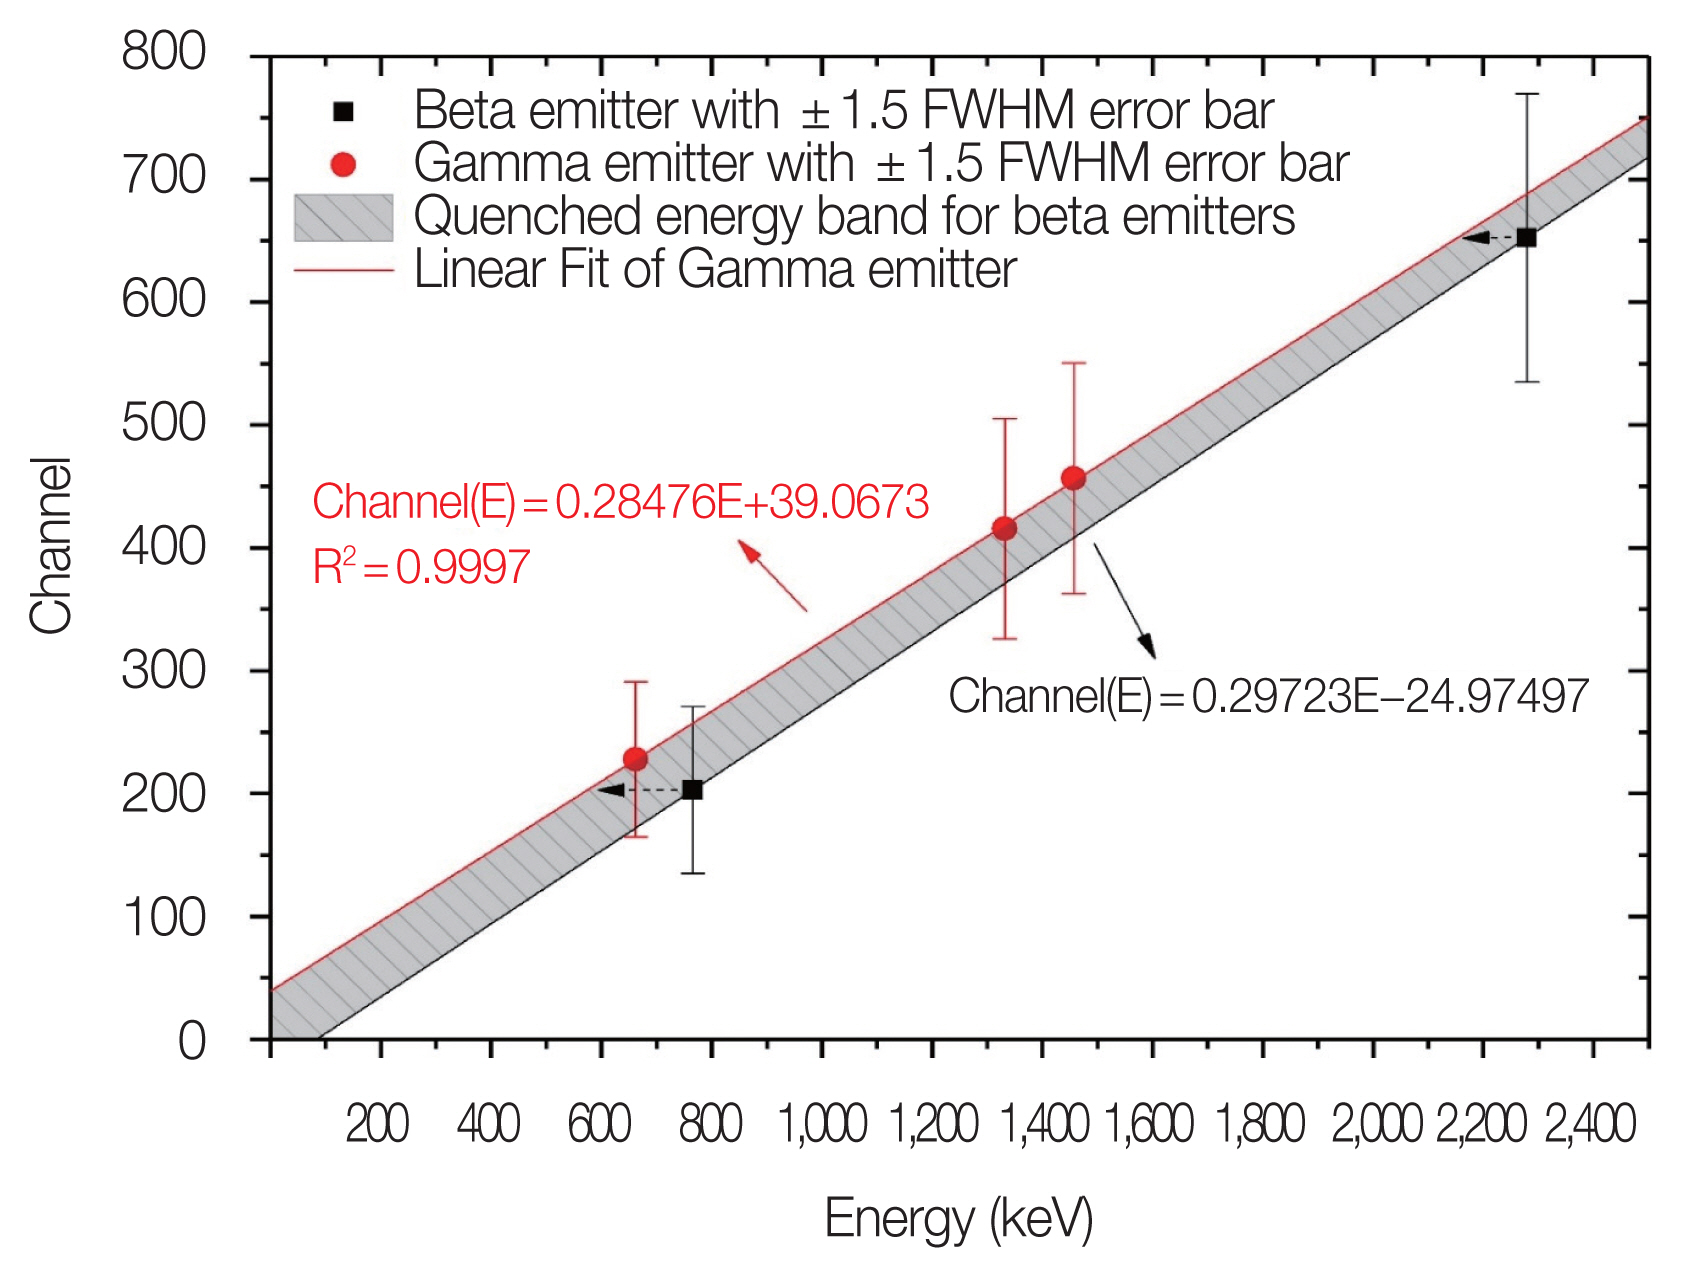
Channel versus energy linearity for beta and gamma emitters of handheld PVT rod. FWHM, full width at half maximum; PVT, polyvinyltoluene.
It was found that the slopes of channel to energy were different for beta and gamma sources. This is because of the energy loss of beta particles, thus quenching, occurred by the coated PTFE with approximately 0.8 mm thickness. Accordingly, when estimating the maximum energy of 90Sr (2,279 keV, which is the maximum energy of progeny radionuclide 90Y possibly in equilibrium) and 40K to select the target gated channel, the quenched and unquenched linear equations were differently used. The gray region in Fig. 8 shows the selective gating for estimating the 90Sr specific concentrations in soil, where the spectra were obtained using beta and gamma check sources in air.
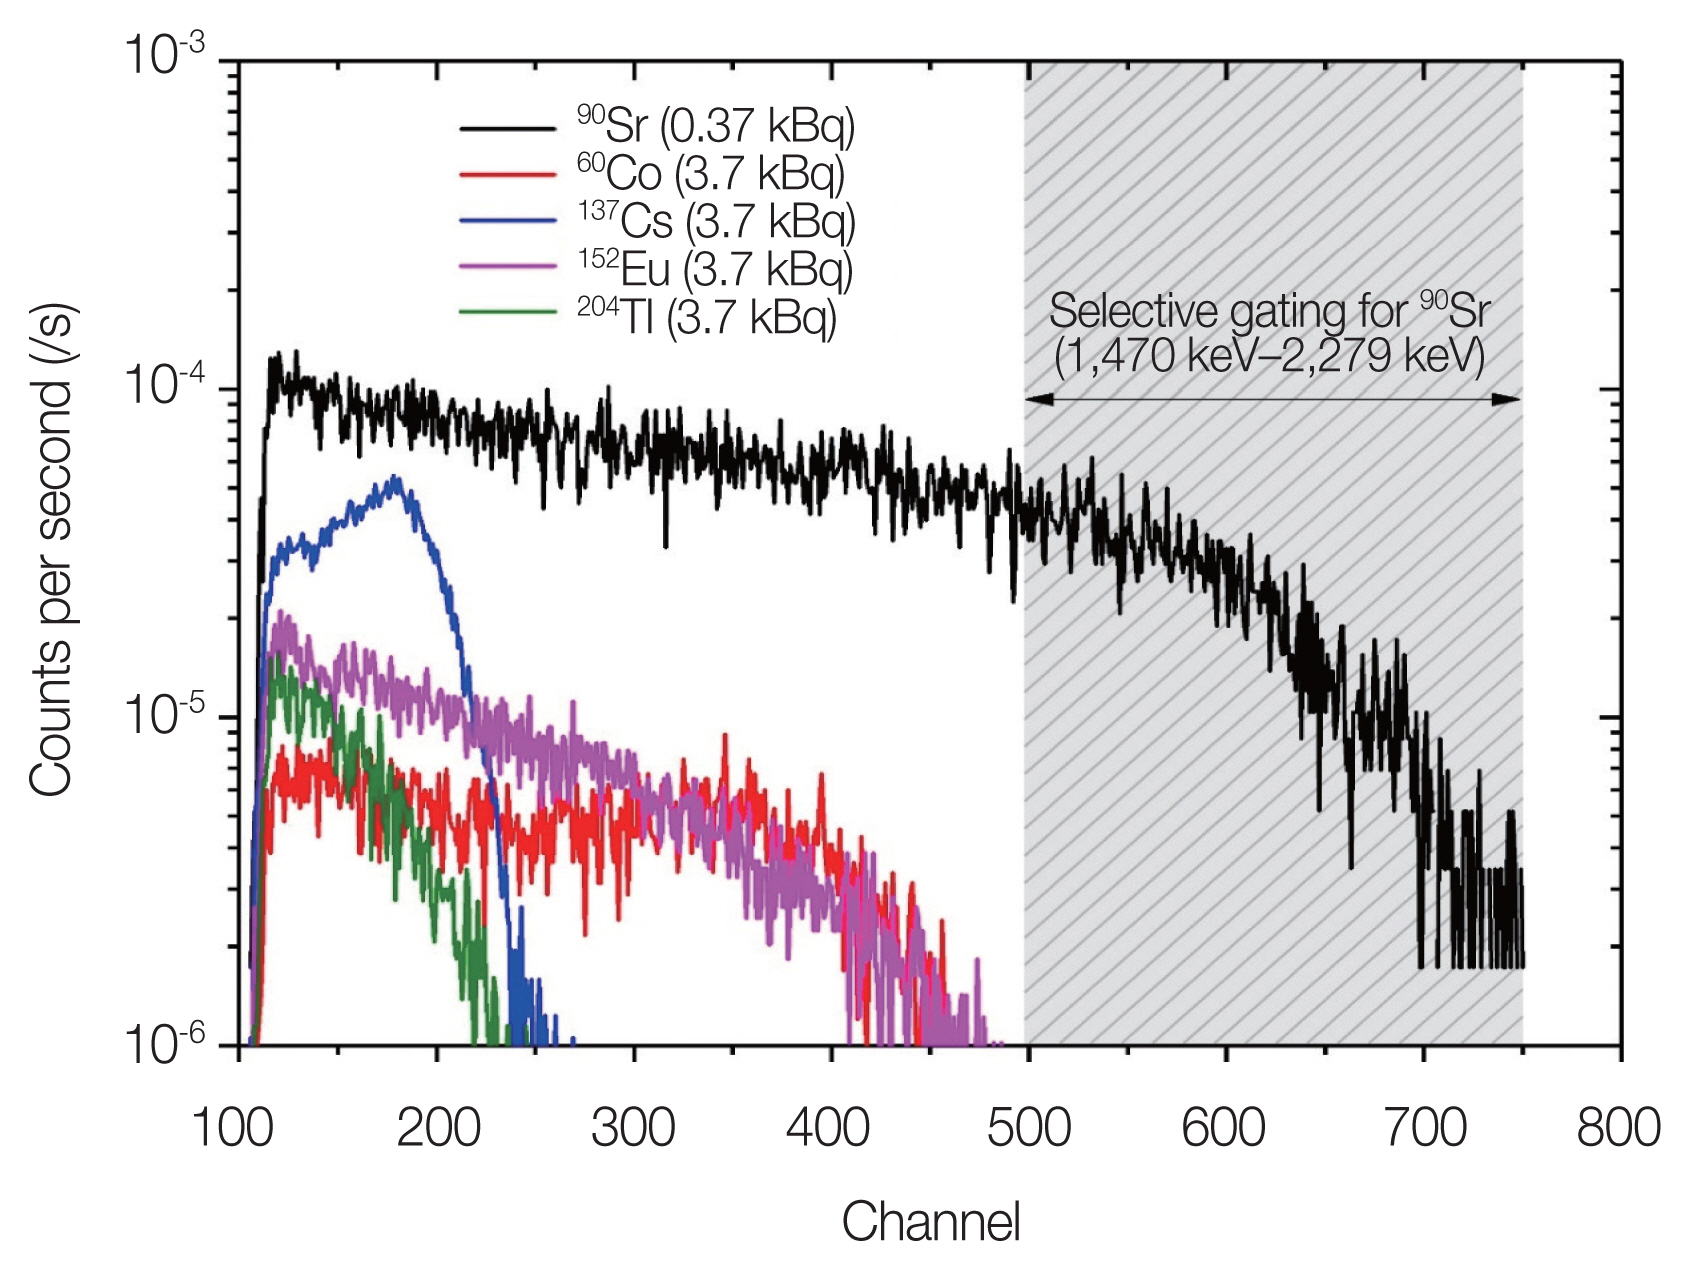
Spectra of beta and gamma check sources in air for selection of target gated channel for 90Sr.
The calculated efficiency values from Fig. 9 for each radionuclide are shown in Fig. 10 with 2σ uncertainties. When comparing the efficiency data from the selectively gated channels and total (gross) channels, it was found that the 90Sr absolute efficiency was lower for gated channels. Still, sensitivity to other radionuclides became negligible in contrast to the gross channels. This result means that 90Sr can be conservatively but intensively analyzed in the actual environment with the presence of NORM and other artificial contaminants; thus, it was worth testing in soil samples that resemble the real environment.
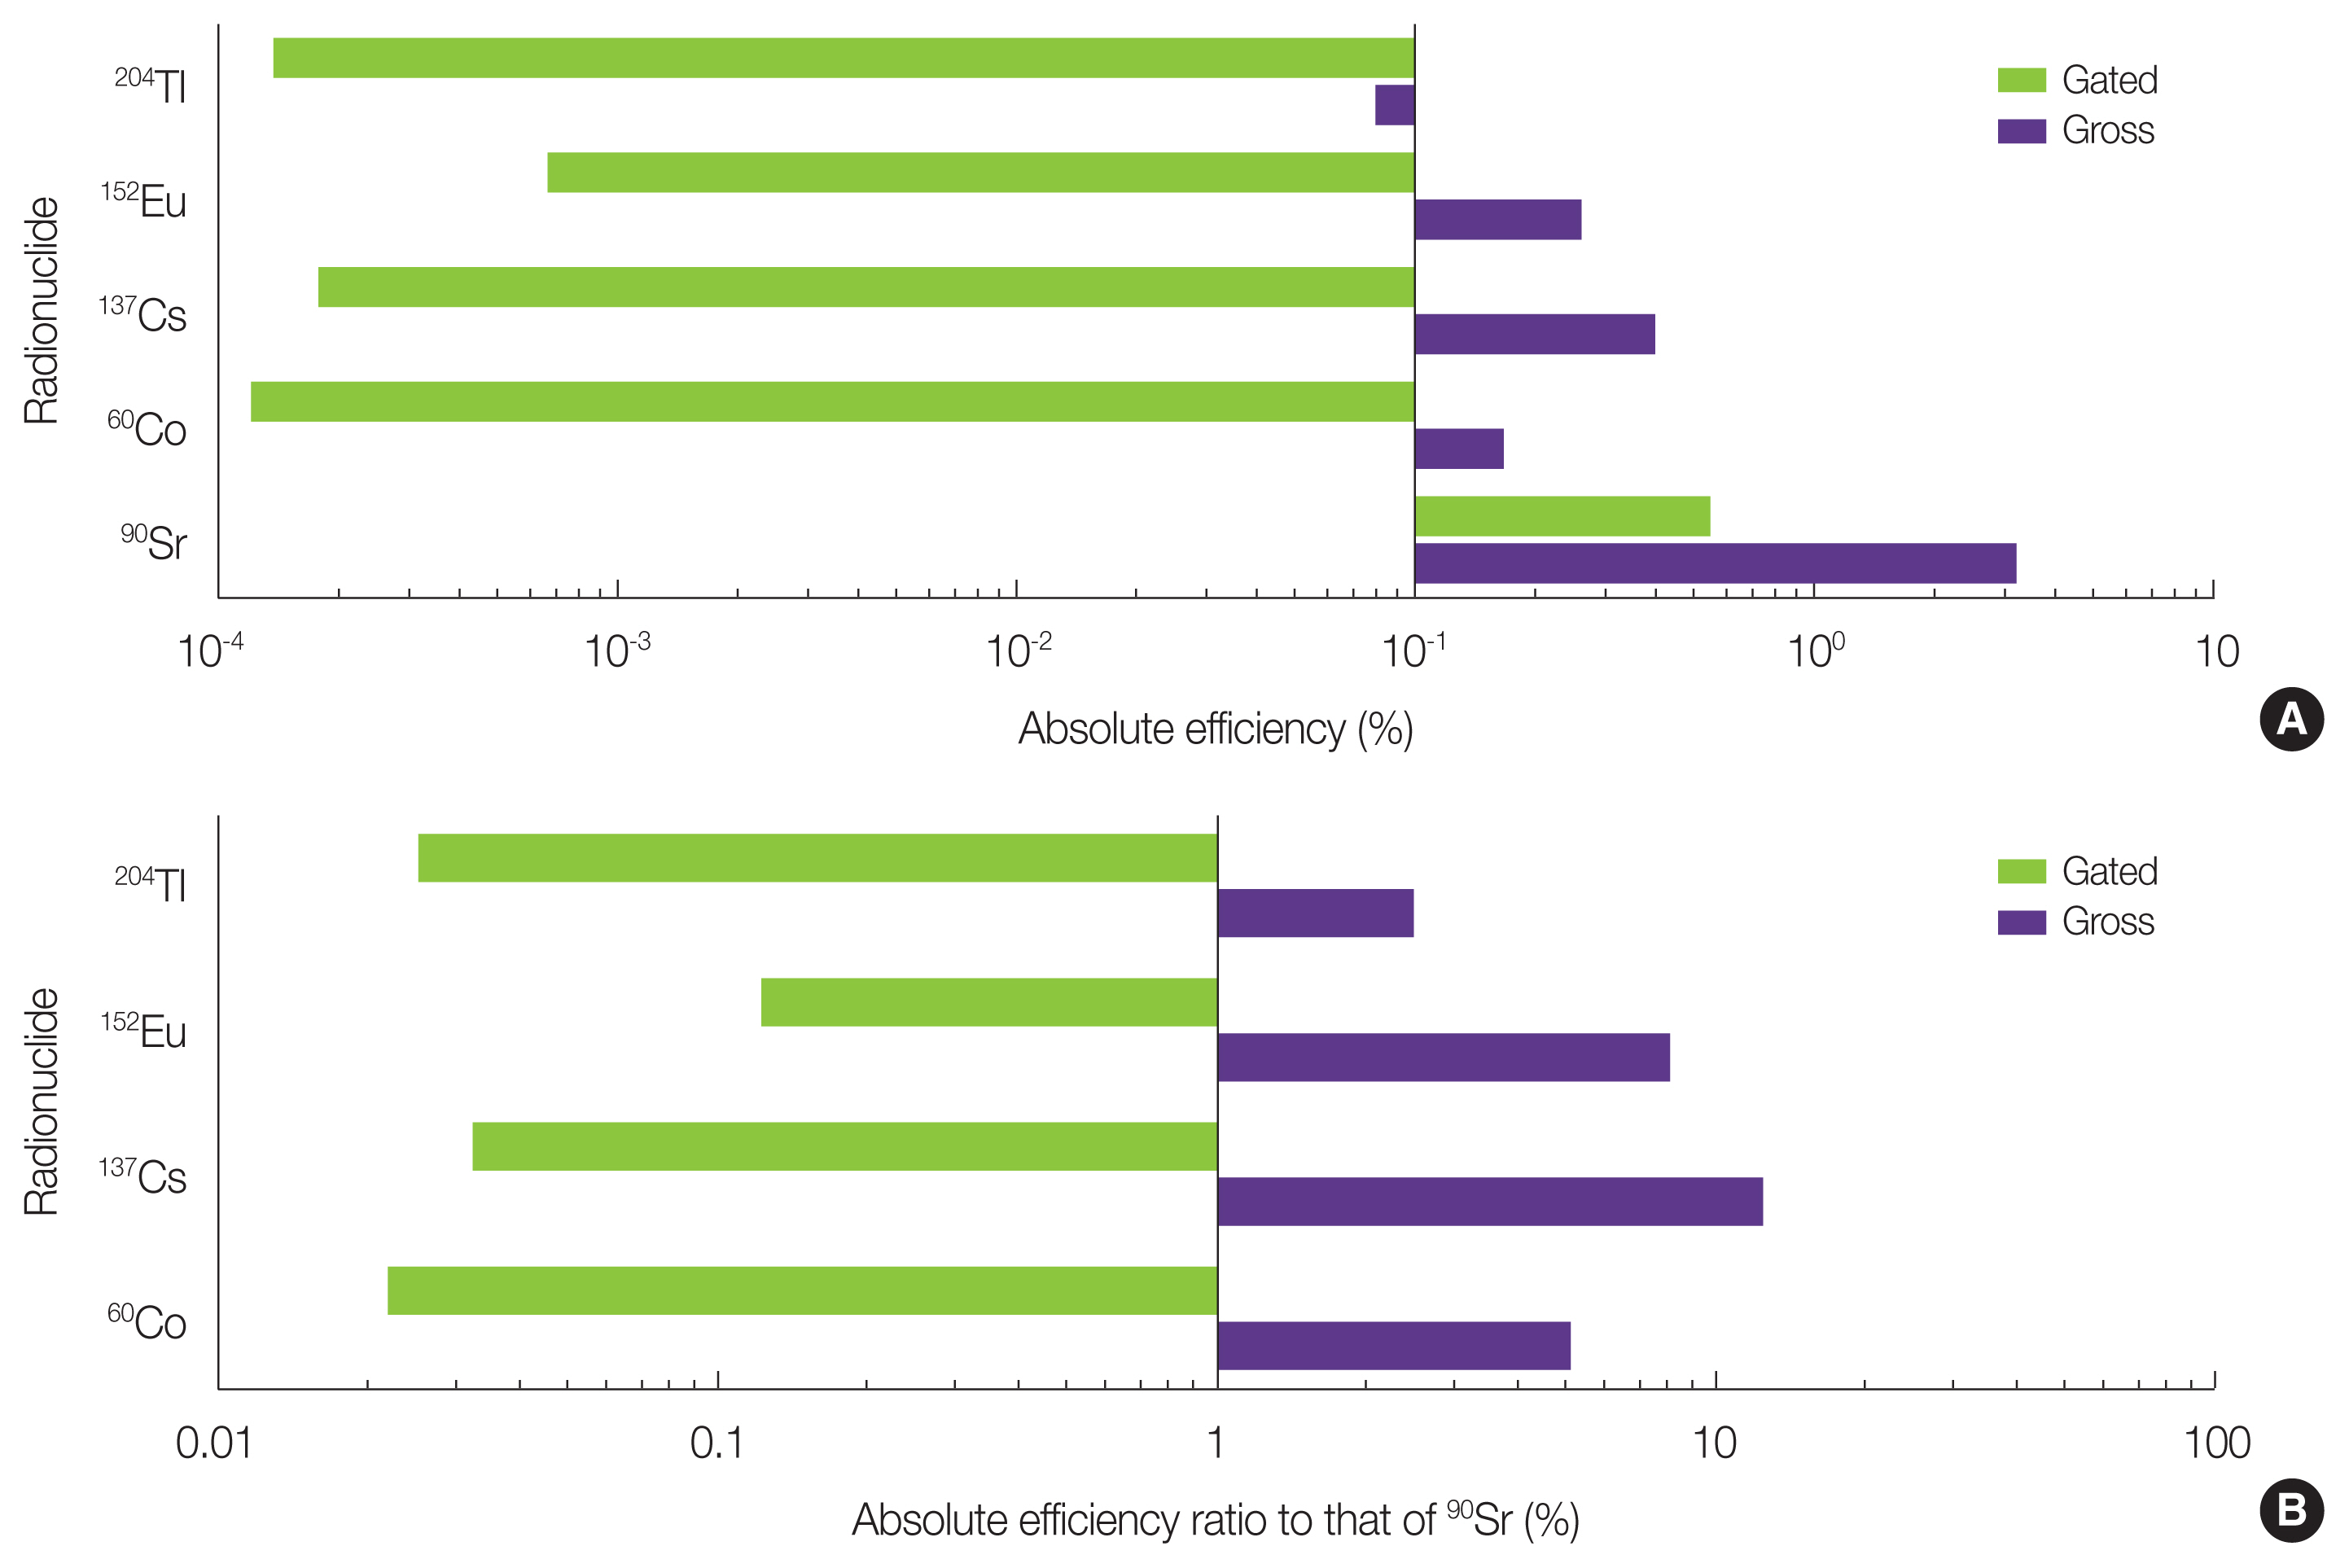
Absolute efficiency values and their ratio to that of 90Sr for gated and gross channels.

(A) Gross efficiency and (B) gated efficiency for unit mass concentration (denoted as mass efficiency in this graph) for different 90Sr concentration in soil.
In fabricated soil samples with different 90Sr concentrations, both strategies enabled prominent identification of contamination (Fig. 10). However, in the case of gross channels measurement, statistical fluctuations with large deviations were found in the 1 Bq·g−1 sample, despite their high efficiency for unit mass concentration. It is assumed that the phenomenon comes from the significant random counts of other radionuclides in the background soil, including the U and Th series. Rather, when selectively gating channels, a measurement time of approximately 1,200 seconds is enough to estimate the actual 90Sr concentration accurately with no diverge of uncertainty bars by blocking the radiation from other radionuclides effectively. Compared to conventional radiochemical procedures based on proportional counting or liquid scintillation counting after 89Sr/90Sr and 90Sr/90Y separations in soil samples [25], the suggested method based on energy gating in this study is very rapid. However, it should be noted that secular radiological equilibrium between 90Sr/90Y may not be established immediately after the radiation disaster, making the accuracy of handheld PVT rod worse. Further tests may be needed for determining the optimal region for energy gating with higher efficiency.
Using gross and gated efficiency values for unit mass concentration at 3,000 seconds as reference, static MDCs with 2σ were calculated as a function of measurement time (Table 3). These were compared to the standard deviations calculated in previous research by Bae and Kim [13], which was estimated using computational simulation. It is shown that 300 seconds is enough to identify both residential farmer and industrial worker release scenarios mentioned in the Results and Discussion section (1. Mobile ZnS(Ag)/PVT Array), considering MDC level of 50% DCGLs. It should also be noted that the accurate estimation only for 90Sr will not be possible for the gross measurement case, especially for low 90Sr concentration cases with high contribution of other radionuclides to statistical fluctuation such as 1 Bq·g−1 sample. Selective gating technique shows higher static MDC, but the value was sufficient to measure the above scenarios if the soil was measured for ≥1,500 seconds. However, in the case of much lower concentration than 1 Bq·g−1, the technique may be useless due to decreased total counts by the selective acquisition of channel counts less than 30, which is the minimum recommended counts for Poisson distribution to be assumed. Previously estimated MDC values were in ranges between the two techniques of this study.
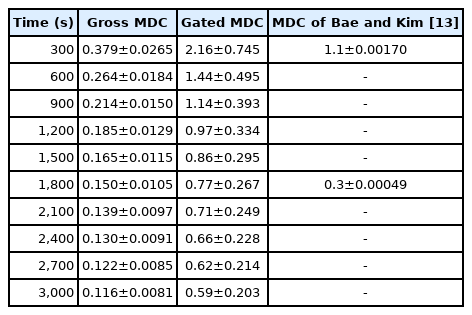
Comparison of Static MDC Values (unit: Bq·g−1)
3. Optimized Procedures for Soil Site Survey
Based on the results from the previous sections, we proposed an optimal vehicle-based scanning and direct measurement technique using the mobile ZnS(Ag)/PVT array and the handheld PVT rod in soil sites (Fig. 11). In short, the distance of the mobile ZnS(Ag)/PVT array should be set as 100 mm from the ground, and scanning should start at 10 km·h−1, the optimal derived scanning speed for the gamma detector located in mobile scanning system [12]. If the counts from the mobile ZnS(Ag)/PVT array show an uncertainty of 3σ or more of the measured background level, the vehicle will stop, and the type of source will be determined through detailed direct measurement at 50 mm, 30 mm, and 10 mm distances. If a significant gross beta activity was measured, 90Sr presence and activity would be further characterized by inserting the handheld PVT rod into different depths.
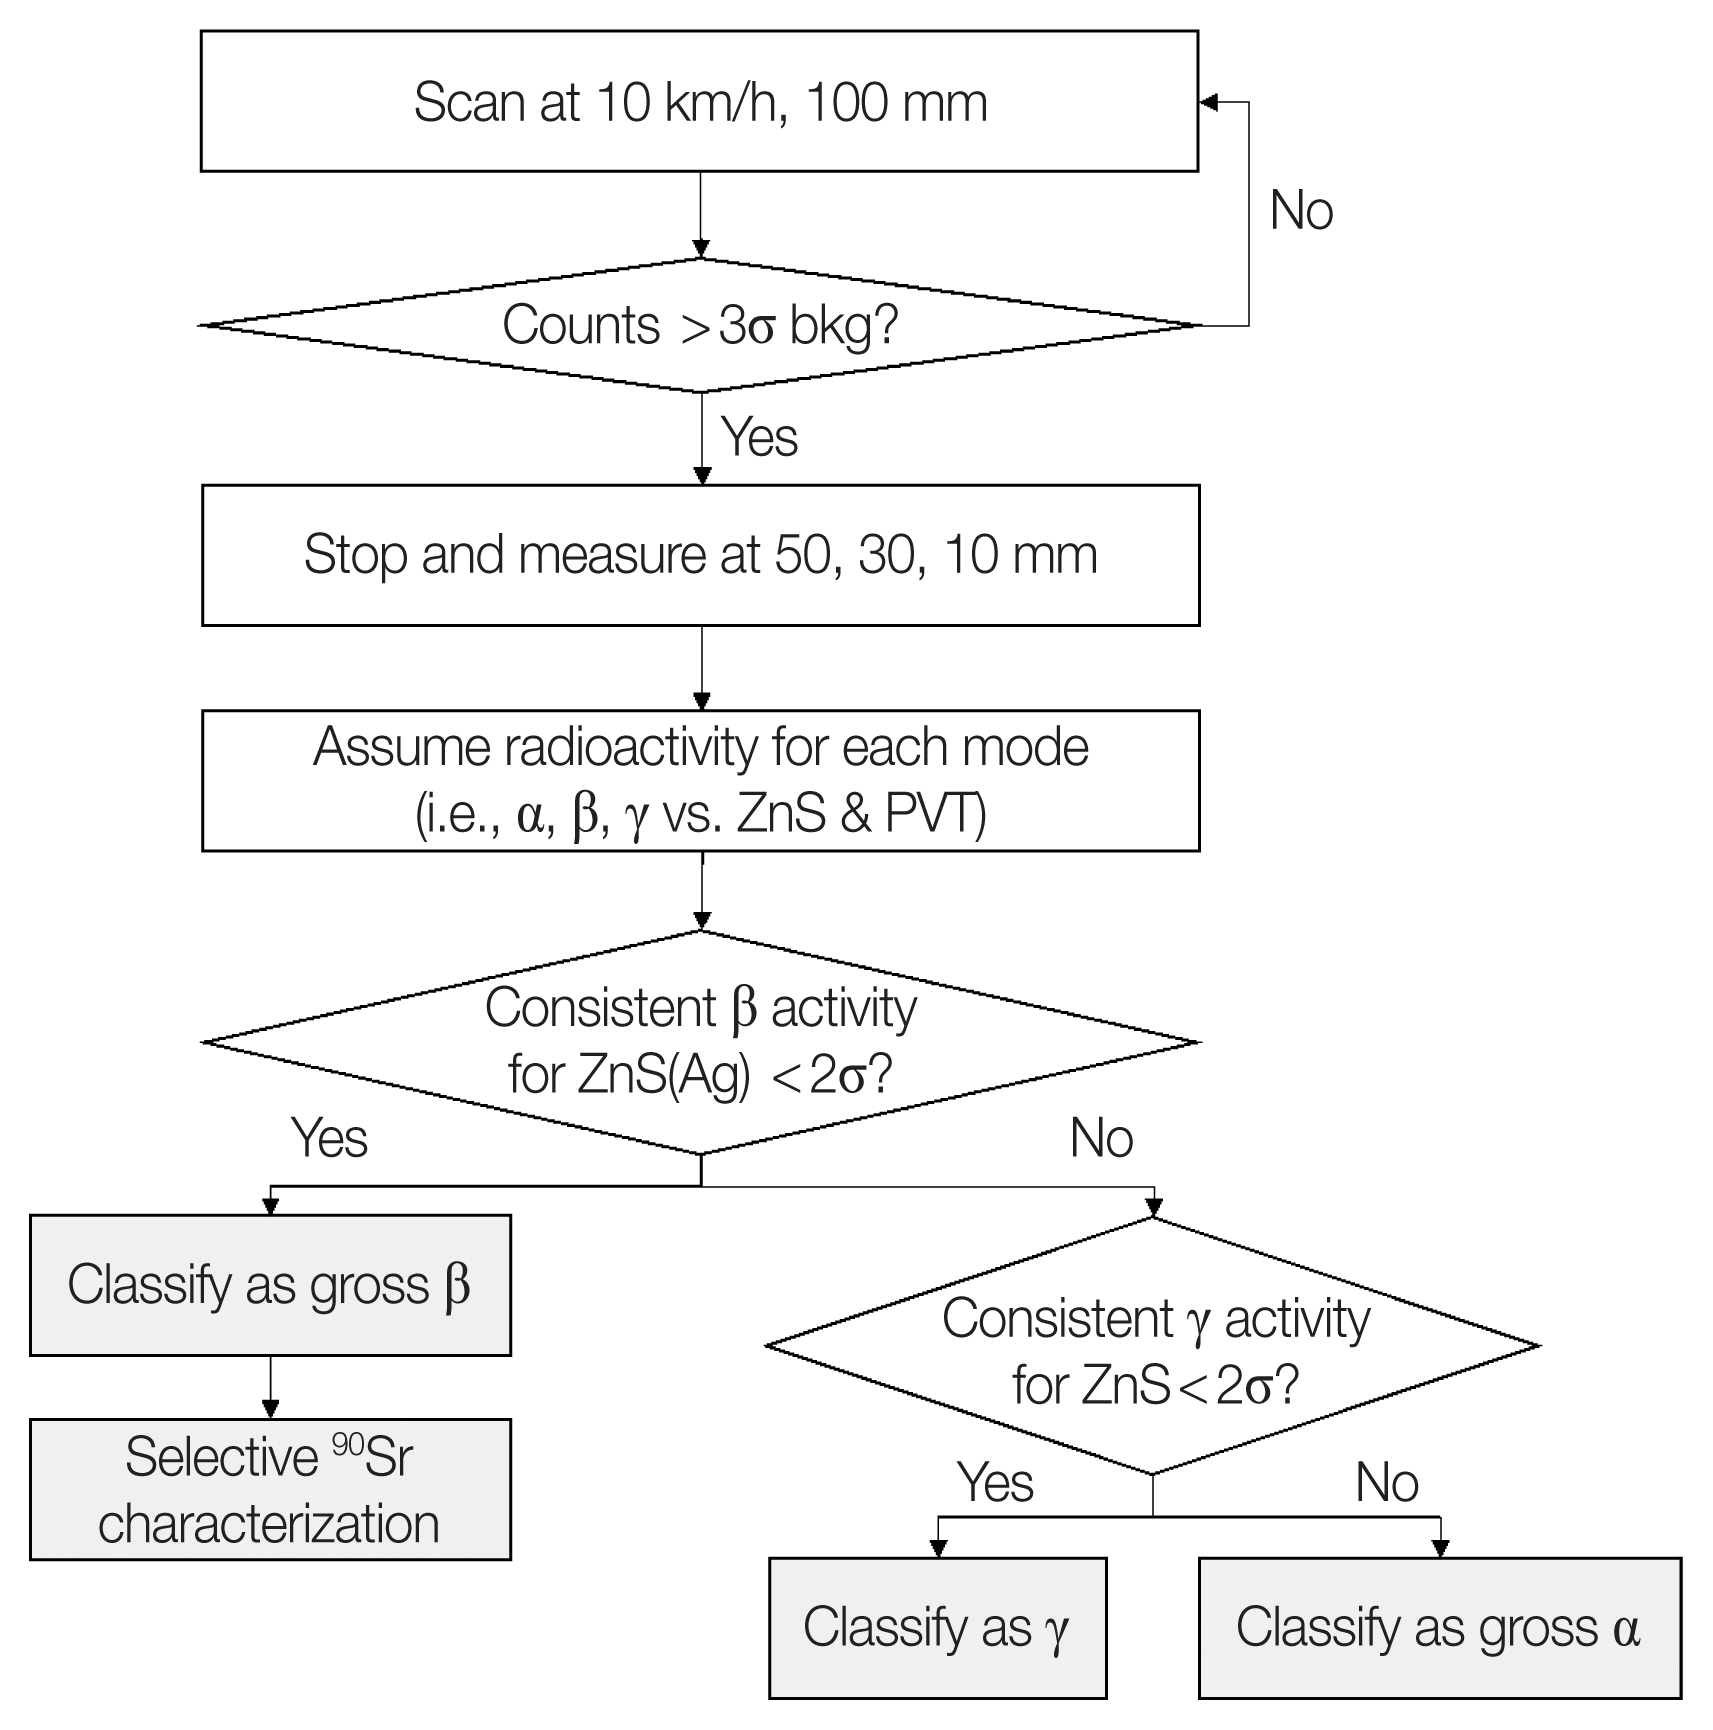
Optimal scanning and direct measurement techniques using the gross alpha/beta array and the PVT detector rod. bkg, background; PVT, polyvinyltoluene.
Conclusion
Soil-based rapid measurement techniques were tested based on an array of five commercial handheld ZnS(Ag)/PVT detectors and a 12 mm (Φ)×20 mm (H) size PVT detector rod. The alpha/beta array could discriminate alpha, beta, and gamma radiation signals from each sensor material. Additionally, we measured the DCGL that corresponds to the preliminary DCGL of Kori-1 NPP through vehicle-based scanning as a case study. By selecting and gating the channels to obtain signals from 1,470 to 2,279 keV, the PVT detector rod effectively identify the presence of 90Sr. This minimized the cross-detection possibility of other radionuclides, where the method was verified by radioactivity concentration measurement of soil samples with homogeneous 90Sr concentrations.
Notes
Conflict of Interest
No potential conflict of interest relevant to this article was reported.
Author Contribution
Conceptualization: Lee C, Kim HR. Investigation and methodology: Lee C, Kim HR. Funding acquisition: Kim HR. Project administration: Kim HR. Resources: Lee C. Writing of the original draft: Lee C. Software: Lee C. Formal Analysis: Lee C. Visualization: Lee C. Writing of the review and editing: Lee C. Validation: Lee C. Data curation: Lee C, Kim HR. Supervision: Kim HR. Validation: Kim HR.
Acknowledgements
This work was supported by National Research Foundation of Korea (NRF) grant funded by the Korean government (No. NRF-2018-Global Ph.D. Fellowship Program).