Comparison of Dose Rates from Four Surveys around the Fukushima Daiichi Nuclear Power Plant for Location Factor Evaluation
Article information

Abstract
Background
The radionuclides released by the Fukushima Daiichi Nuclear Power Plant (FDNPP) accident 9 years ago are still being monitored by various research teams and the Japanese government. Comparison of different surveys’ results could help evaluate the exposure doses and the mechanism of radiocesium behavior in the urban environment in the area. In this study, we clarified the relationship between land use and temporal changes in the ambient dose rates (air dose rates) using big data.
Materials and Methods
We set a series of 1×1 km2 meshes within the 80 km zone of the FDNPP to compare the different survey results. We then prepared an analysis dataset from all survey meshes to analyze the temporal change in the air dose rate. The selected meshes included data from all survey types (airborne, fixed point, backpack, and carborne) obtained through the all-time survey campaigns.
Results and Discussion
The characteristics of each survey’s results were then evaluated using this dataset, as they depended on the measurement object. The dataset analysis revealed that, for example, the results of the carborne survey were smaller than those of the other surveys because the field of view of the carborne survey was limited to paved roads. The location factor of different land uses was also evaluated considering the characteristics of the four survey methods. Nine years after the FDNPP accident, the location factor ranged from 0.26 to 0.49, while the half-life of the air dose rate ranged from 1.2 to 1.6.
Conclusion
We found that the decreasing trend in the air dose rate of the FDNPP accident was similar to the results obtained after the Chernobyl accident. These parameters will be useful for the prediction of the future exposure dose at the post-accident.
Introduction
Nine years after the Fukushima Daiichi Nuclear Power Plant (FDNPP) accident, various environmental radiation surveys are still being performed. In Japan, the radiation in the area affected by the FDNPP accident is being monitored by the Nuclear Regulation Authority (NRA). In addition, various surveys have been conducted to evaluate the ambient dose equivalent rate (air dose rate), including airborne radiation survey using manned or unmanned helicopters [1], carborne survey [2], and ground-based survey [3], and their results have been used as key data, such as for the demarcation of evacuation or decontamination areas.
Understanding the characteristics of each radiation survey technique is important for determining air dose rate distributions. Saito et al. [4] evaluated the variations between the survey data obtained 5 years after the FDNPP accident using different methods. Specifically, they found that the air dose rate resulting from a carborne survey tends to be lower than those of other surveys because carborne survey is performed on roads. In contrast, the field-of-view of an airborne survey is relatively wide, including forests and mountains. However, the data obtained from an airborne survey are relatively rough due to the long distance between the detector and the measurement object. The differences between carborne and airborne surveys have been assessed qualitatively by associating their results with land use. As for quantitative evaluations, a dataset for the same place obtained continuously from big data has to be extracted.
Furthermore, the correlation between temporal changes in air dose rates and differences in survey techniques should be continuously evaluated to help assess exposure doses and understand the environmental behavior of radionuclides. Therefore, several research teams have monitored the temporal change in the air dose rates around the FDNPP area, which was expressed as the effective and ecological half-life [1–4]. The results revealed that the decreasing rate can be divided into a fast and a slow component, whose values and ratios vary depending on the land use. A ground-based survey conducted by Yoshimura et al. [5] showed that the decreasing rate of paved surfaces is faster than that of non-paved surfaces. Golikov et al. [6] evaluated the location factor based on ground-based survey data obtained around the Chernobyl Nuclear Power Plant accident area, as it is a suitable indicator of the correlation between the air dose rate and land use.
In this study, we summarized the survey results obtained 9 years after the FDNPP accident. After that, we prepared a dataset using already reported big data acquired continuously from the same place, and we evaluated the correlation between the temporal change in the air dose rate and land use by calculating the location factor. The results of this study are expected to contribute to the evaluation of additional radiation exposure doses after the FDNPP accident.
Materials and Methods
1. National Project
Since immediately after the FDNPP accident, the Japanese government has been conducting large-scale radiation surveys using many tools. The main radiation survey tools are airborne survey using a manned helicopter, fixed point survey using a handheld survey meter, backpack survey using a dedicated radiation survey system with a global positioning system (GPS), and carborne survey using a dedicated radiation survey system with GPS. The dates of these survey campaigns are shown in Table 1. Exemplary results are shown in the maps in Fig. 1. The range of the airborne survey is the area inside the 200 km radius of the FDNPP. The approximately 6,000 locations of the fixed point survey are almost the same in all campaigns. The backpack survey, which covers over 6,000 km, was started in 2013 to determine the detailed air dose rate distribution in the residential areas. The travel distance for the carborne survey per campaign is 20,000 km in East Japan. All data are converted into air dose rate at 1 m above the ground. The campaigns do not contain survey data obtained during rains. The goal of the national project’s large-scale survey is a visualization of the radiation distribution based on a large amount of simultaneously recorded survey data. The outstanding characteristic of this project is the good position resolution of the air dose rates. In addition, the influence of the nuclides except 134Cs and 137Cs is remarkably small because the first campaign was one month after the accident. The national survey project is currently in progress, and its data are published on the NRA homepage [7].

Schedule of National Survey Project

Radiation survey maps: (A–C) results in 2011 and (D–E) results in 2018.
2. Measurement Tools
1) Airborne survey
Immediately after the FDNPP accident, a series of airborne survey runs using a manned helicopter was performed as a national project to map the air dose rates in the area at a distance of 1 m above the ground [8–10]. Airborne surveys can collect γ-ray radiation data with a spatial resolution of 250× 250 m2 from the ground surface in wide areas, including mountainous regions that are not accessible from the ground. The airborne survey of Sanada et al. [1] was conducted using a dedicated radiation detection system (RSX-3; Radiation Solutions Inc., Ontario, Canada) installed on a manned helicopter; the device can acquire a spectrometer reading every 1 second to produce a 1,024-channel energy spectrum rated at 3 keV per channel. The readings were synchronized with time from a GPS receiver. The spectrum and GPS data (date, time, latitude, longitude, and height above the ellipse) were recorded every 1 second. The spectrum data were processed using various parameters, such as the attenuation factor and the air dose rate conversion factor, to retrieve the air dose rates at the surface level. Interference factors, namely, radon progenies in air, cosmic rays, and self-contamination of the scintillator crystal for radiocesium measurement, were discriminated using gamma spectra [1]. In the area within approximately 200 km of the FDNPP, the flight spacing was 600, 900, 1,800, or 3,000 m, depending on the initial air dose rate. The flight speed and flight altitude on the ground were 150 km/hr and 300 m, respectively. These main flight conditions were almost the same for all survey campaigns. For correcting the flight altitude, the absolute altitude of the ground level was first determined by subtracting the 10 m mesh elevation data acquired using the digital elevation model of the Geospatial Information Authority of Japan [11] from the altitude above the sea level obtained using GPS. The count rate was corrected to the air dose rate at 1 m above the ground on the basis of the flight altitude on the ground and the attenuation factor. Exemplary results, gathered using the software ArcGIS (Environmental Systems Research Institute Inc., Redlands, CA, USA), are shown in the maps of Fig. 1A, 1D. The dates of the surveys are shown in Table 1. The value of each air dose rate was corrected to the end of each day using the physical decay of radiocesium in a campaign.
2) Fixed point survey
In the fixed point surveys, the air dose rates at 1 m above the ground were measured at approximately 6,000 locations in the 80 km zone of each campaign using a handheld NaI(Tl) scintillation survey meter (TCS-171B or TCS172B; Hitachi Co. Ltd., Tokyo, Japan) and ionization chamber–type survey meters (ICS-323C; Hitachi Co. Ltd.) in accordance with the magnitude of the air dose rate under evaluation. The exact numbers of survey locations and targeted areas and the dates of the survey campaigns are presented in Table 1. When the air dose rates were higher than the upper limit of reliable measurements by the NaI(Tl) scintillation survey meters (30 mSv·h−1), the ionization chambers were used. Survey meters that were calibrated within the 12 months preceding the measurements were also used. The calibration was performed by the device manufacturers or registered organizations using standard radiation sources or fields that were detectable according to national standards. The criteria for selecting the measurement locations, details about the measurement conditions of the survey meters, and the data recording procedures were the same as those reported in a previous study [3]. Exemplary results are shown in Fig. 1B, 1E. The value of each air dose rate was corrected to the middle of each day using the physical decay of radiocesium in a campaign.
3) Backpack survey
KURAMA-II (Matsuura Denkosha Co. Ltd., Ishikawa, Japan) is a simple survey system that can be used even without technical knowledge of radiation measurement (such as knowledge on connecting measuring devices or starting the measurement system). The KURAMA-II system, developed for carborne surveys, has been used for backpack surveys around the FDNPP [12]. In general, KURAMA-II can measure air dose rates and GPS positions every 3 seconds and automatically transmit these data to an Internet cloud server. For carborne surveys, an automatic data processing system was used along with the KURAMA-II system to correct the GPS positions of the measured data on the basis of roadmap data. In our backpack survey, the GPS position was used as the measurement position, and the air dose rate was measured at about 1 m above the ground. A CsI(Tl) scintillation detector (C12137; Hamamatsu Photonics, Hamamatsu, Japan) was used for KURAMA-II. The monitored dose rates were based on the G(E) function (spectrum-dose conversion operator), which can accurately calculate dose rates from a measured pulse-height distribution despite significant changes in the energy spectrum [13]. At the end of the survey period, the measured regions were divided into 20×20 m2 meshes. The measured data were expressed as mesh values by averaging the raw data to reduce statistical errors. The survey campaign dates are provided in Table 1, and exemplary results are shown in Fig. 1F. The value of the air dose rate was corrected to the middle of each day using the physical decay of radiocesium in a campaign.
4) Carborne survey
The carborne surveys were also conducted using the KURAMA-II system [12]. An automated data processing system was developed to immediately process large volumes of measured data. During processing, the air dose rate measured inside each car was converted to the air dose rate at 1 m height outside the car with a correction factor that was determined by field surveys performed at several locations with different contamination levels [13]. When off-course positions were detected by the GPS, the data were corrected to the nearest roadway using geographical information system data, and daily temporal data were provided. The survey speed and record time interval were approximately 50 km/h and 3 seconds, respectively. In the processing, the air dose rate measured inside each car was converted to the air dose rate at 1 m height outside the car with a correction factor determined by field surveys conducted at many locations with various air dose rates [2]. As in the backpack survey, at the end of the survey period, the measured regions were divided into 100×100 m2 meshes. The measured data were expressed as mesh values by averaging the raw data to reduce statistical errors. Fig. 1C, 1F show representative results, and the survey campaign dates are provided in Table 1. The value of each air dose rate was corrected to the middle of each day using the physical decay of radiocesium in a campaign.
3. Analysis Dataset
In the preparation of the analysis dataset, we first set a series of 1×1 km2 meshes within the 80 km zone from the FDNPP to compare the different survey results. The survey data within each mesh were the average of each survey method’s data. An image of the conversion data of each survey result is shown in Fig. 2. We then generated an analysis dataset from all the survey meshes to analyze the temporal change in the air dose rates. The selected meshes included data from all survey types (airborne, fixed point, backpack, and carborne surveys) obtained through the all-time survey campaigns. Campaigns with insufficient data were excluded from this analysis (1st and 2nd backpack survey campaigns). Most of these locations (Fig. 3) were habitable areas corresponding to 982 meshes out of a total of 8,470 meshes.

Image for evaluation mesh of four survey methods.

Location of analysis meshes in this study. These are all four-type data (airborne survey, fixed point survey, backpack survey, and carborne survey) in this mesh through the all-time survey campaigns.
Their characteristics were determined by presenting the distributions of the air dose rates, which were converted to natural logarithms (ln) as histograms (Fig. 4) that were based on the first airborne survey data (April 29, 2011). As shown in Fig. 4, the data in the analysis dataset were higher than all the mesh data; their medians were 1.27 mSv·h−1 (ln: 0.24) and 0.14 mSv·h−1 (ln: −0.51), respectively, suggesting that the national survey project was selectively conducted in areas with high air dose rates. Here the differences and temporal changes in the four survey methods are discussed on the basis of this analysis dataset.
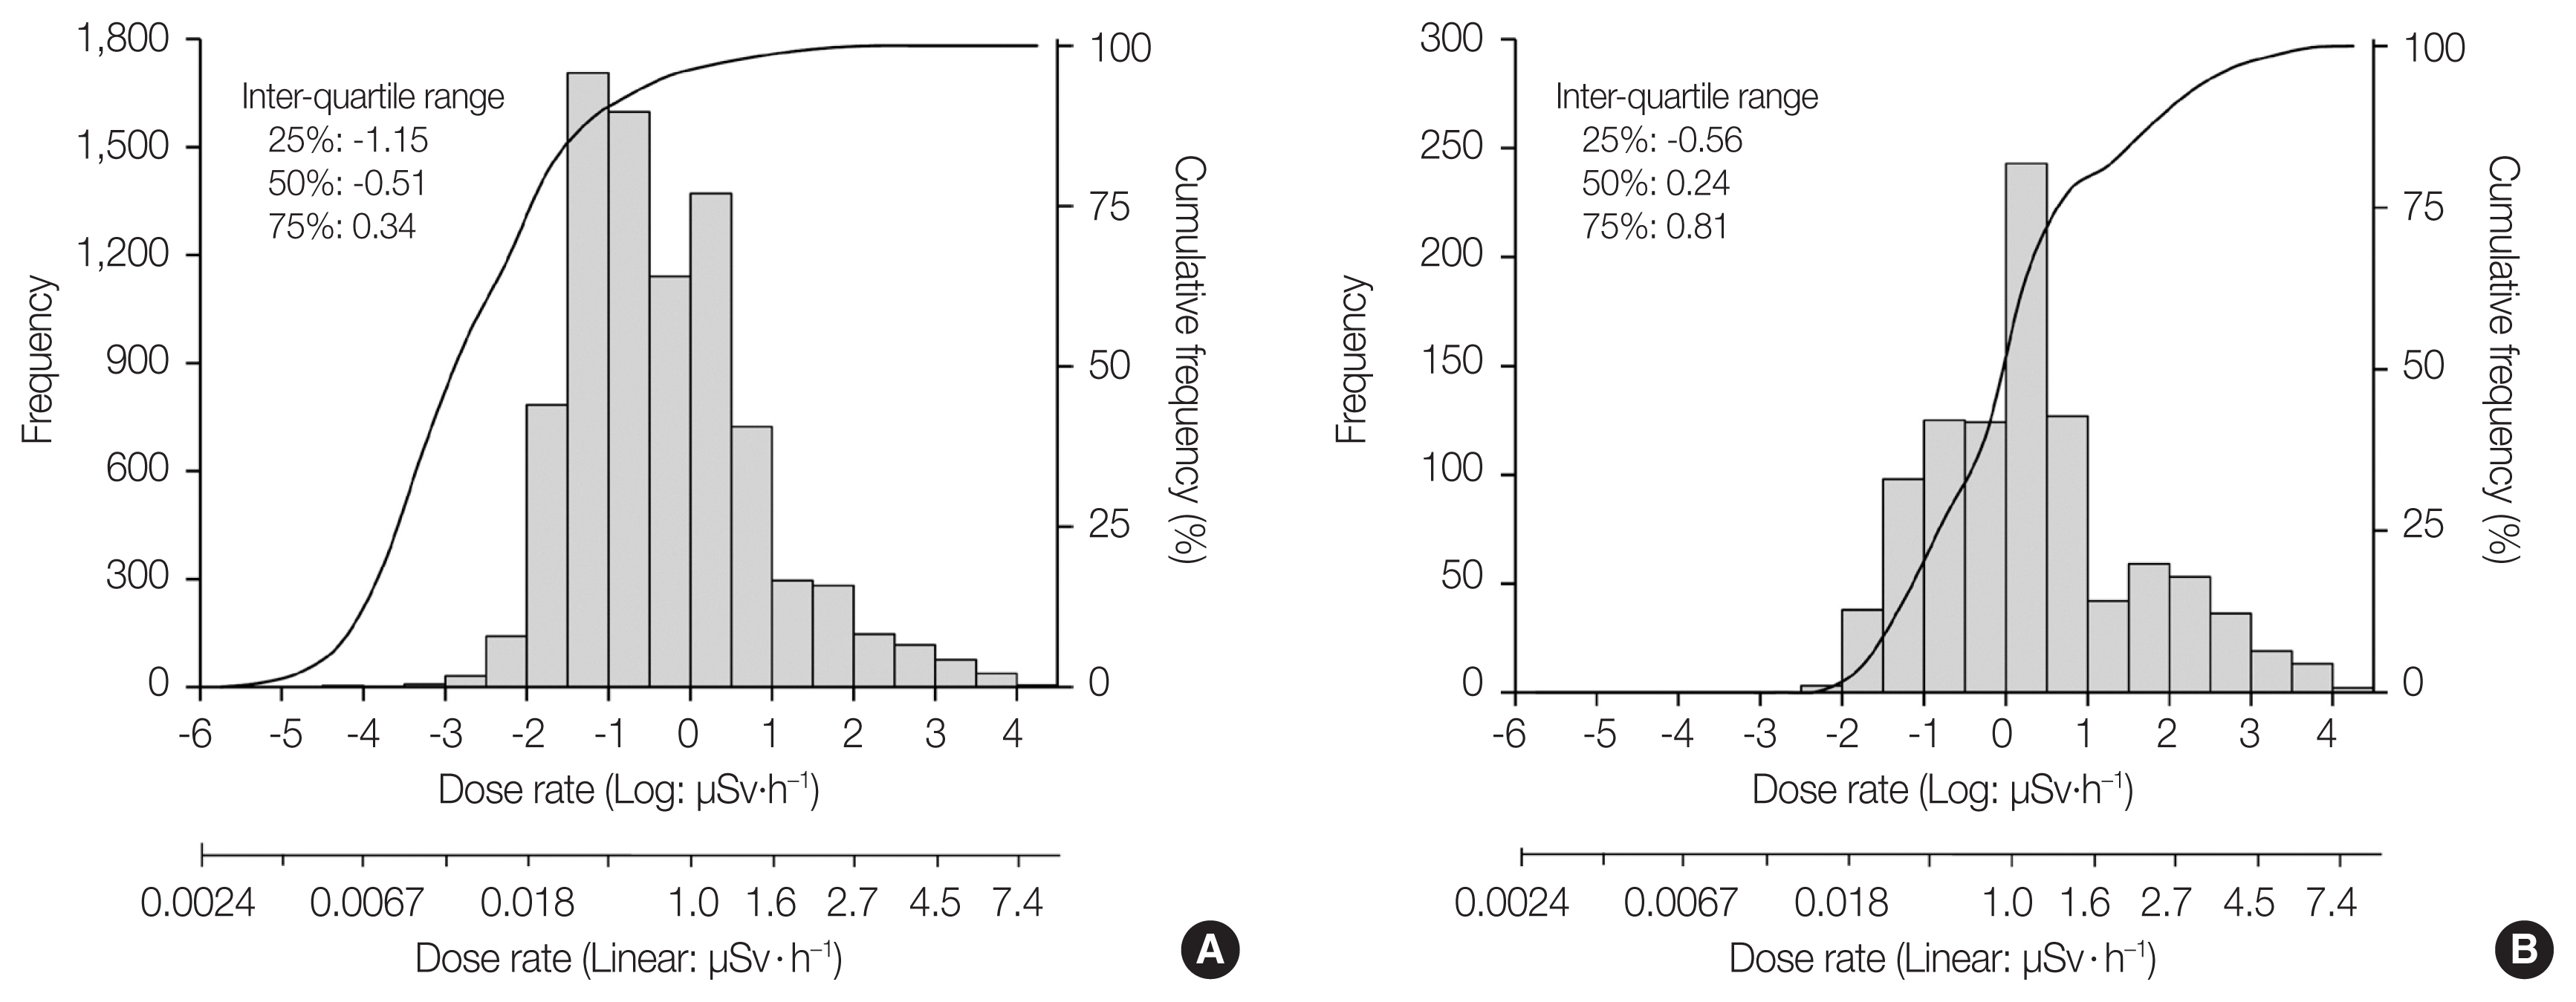
Distribution of air dose rate by the airborne survey in (A) all survey meshes and (B) analysis meshes.
4. Comparison of the Survey Methods
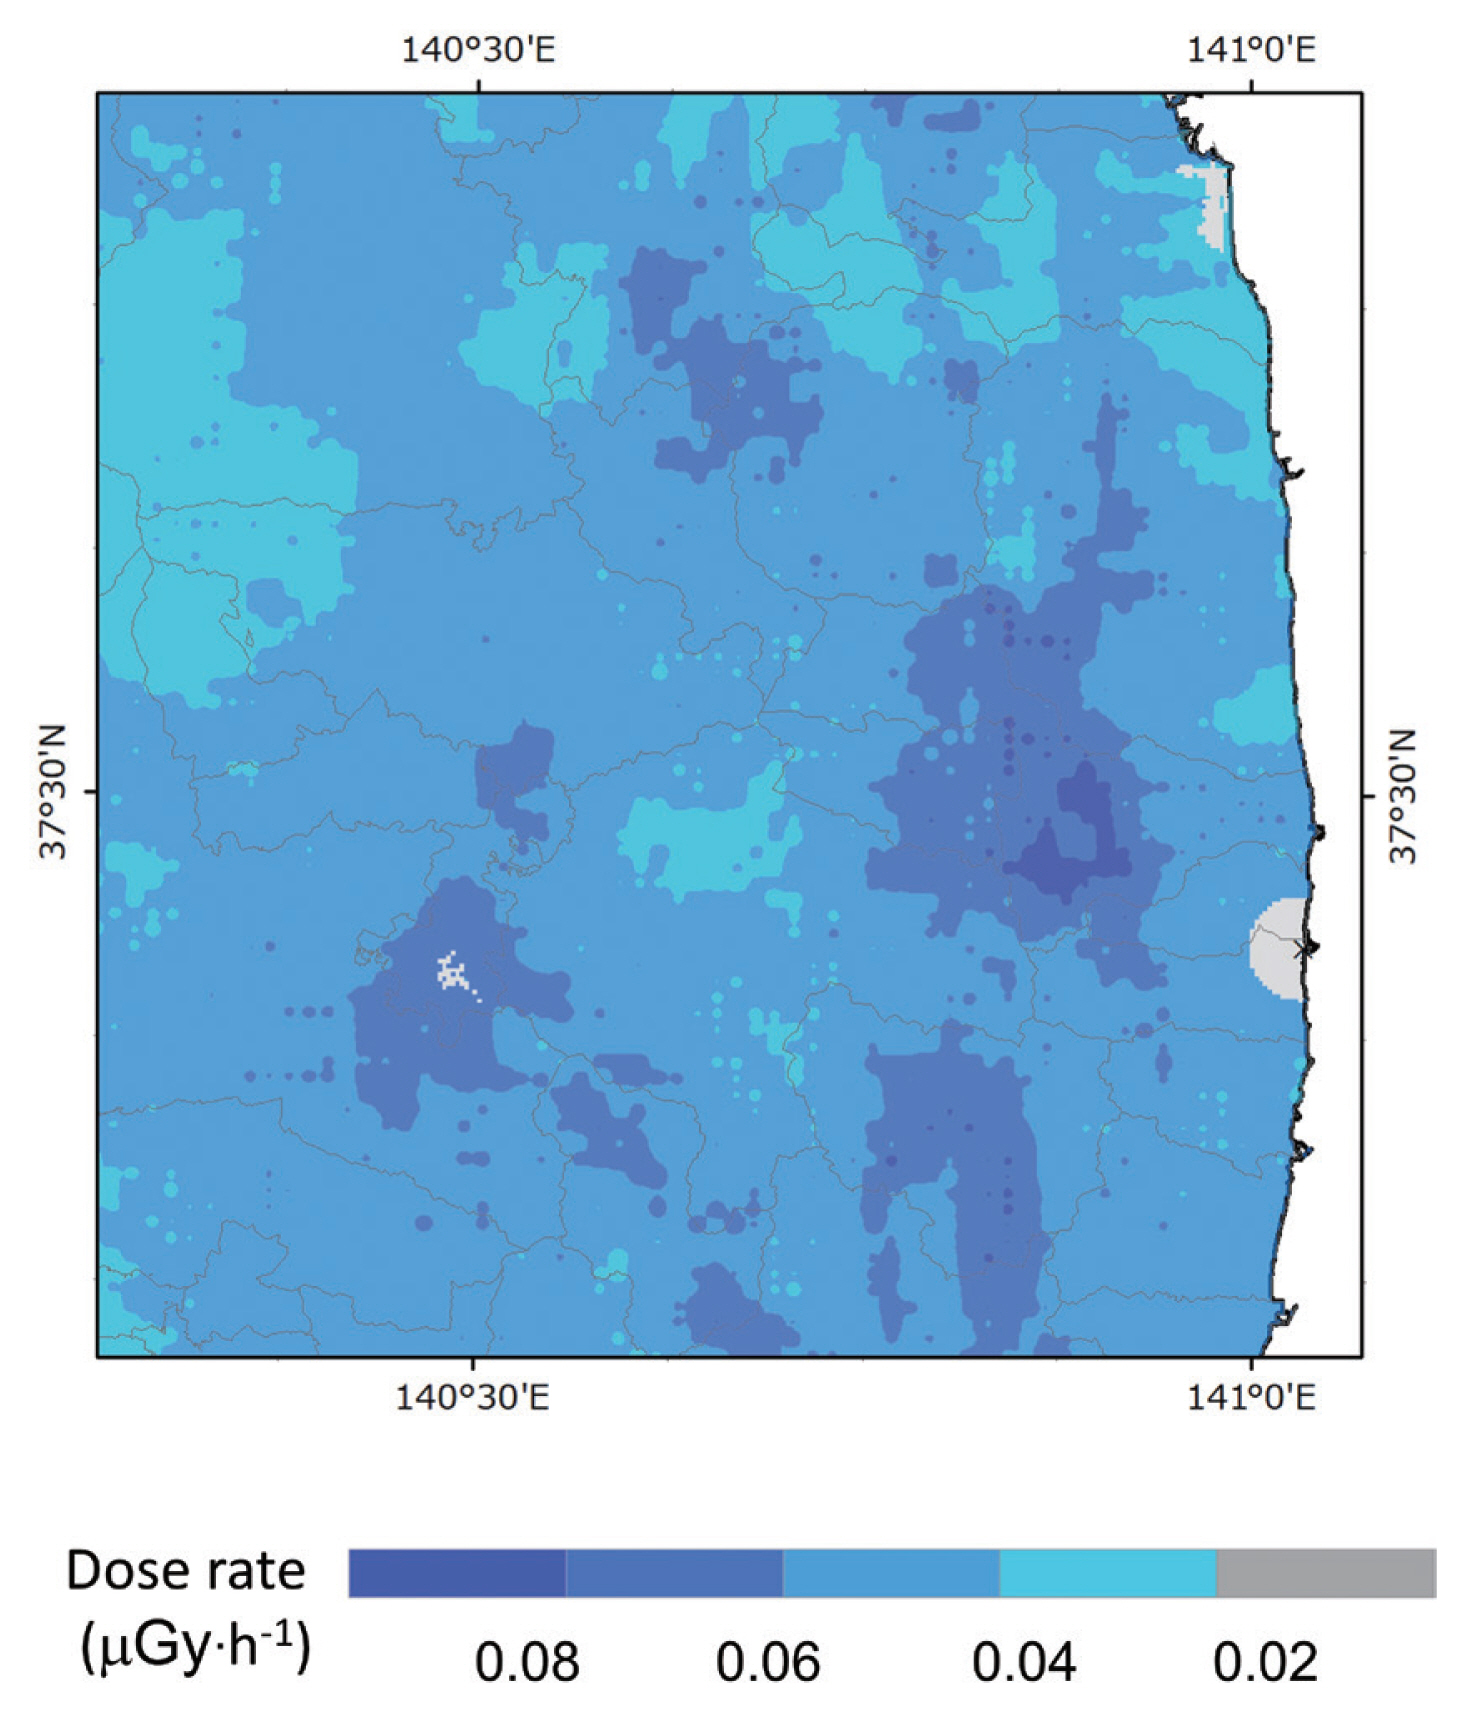
The air dose rates of the national project included the background dose rates, which were derived from natural radionuclides. Therefore, the background dose rate should be distinguished from these air dose rates to evaluate the severity of the FDNPP accident [14]. To this end, absorbed dose rate data in a 250×250 m2 mesh were evaluated using airborne survey data obtained from the Japan Atomic Energy Agency homepage [15] and used as the background dose rate data (Fig. 5). The accuracy of these data was evaluated to compare the ground-based data acquired using a portable Ge detector [14].
The different survey results were then compared on the basis of the relative deviation (RD). Specifically, the airborne survey data (Da) were compared with the other survey data (Db) in the same mesh by visualizing the unevenness using a scatter plot. The RD of each survey mesh was calculated using Equation (1) to evaluate the accuracy of this study’s scheme, and the calculated RDs were then used to estimate the total error and statistical uncertainty, which can be displayed as a histogram of frequency.
5. Evaluation of the Location Factors
The location factor is an important parameter for predicting the radiation exposure dose to inhabitants. Golikov et al. [6] reported that the exposure dose can be calculated by evaluating the location factor of land use after the Chernobyl accident. The time dependence of location factors, fCs(t), was modeled by fitting the available data in the following equation:
where t (year) is the time elapsed since the accident, a1 and a2 are fitting parameters, and T1/2 is the half-life of the air dose rate. The fitted data represented the geometric mean value of the air dose rate, which was distinguished from the background dose rate (derived from natural radionuclides), because the air dose rate distributions were not Gaussian. The geometric mean values of each survey method in each campaign were used in this analysis. These geometric mean values were corrected to the accident date (March 15, 2011) by the radiocesium decay. The 134Cs/137Cs ratio on that day was 2.7 [3]. Moreover, the geometric mean values were normalized on the basis of the extrapolation value of the fixed point survey at time zero for comparison with the values reported by Golikov et al. [6].
Results and Discussion
1. Comparison of the Survey Methods
The results of all the survey methods examined in this study were compared, and the scatter plots obtained from the comparison of the survey campaigns in 2014 and 2018 are given as an example in Fig. 6. These scatter diagrams show that the airborne survey was positively correlated with each of the three other survey methods (Fig. 6A–6C), while the RD histograms reveal the unevenness of each pair of surveys being compared (Fig. 6D–6F). Moreover, the results of the three ground-based surveys tended to be lower than those of the airborne survey, which could be attributed to the potential influence of topography on airborne surveys in areas with complex topographies [1]. According to simulation studies, the field-of-view of radiation detection by airborne surveys is wider than those by ground-based surveys because the distance between the detector and the ground in airborne surveys is longer than those in ground-based surveys [16]. In addition, the RD unevenness of the fixed point survey was greater than that observed for the backpack and carborne surveys. The median RD values of the fixed point, backpack, and carborne surveys based on the airborne survey in the 2014 campaign were −0.168, −0.293, and −0.410, respectively; they differed from the corresponding values in the 2018 campaign (−0.189, −0.280, and −0.504, respectively), indicating that the median value in a survey area is important for estimating the RD unevenness in airborne surveys. However, according to Fig. 6F, the histogram peak of the carborne survey in the 2018 campaign was lower than that in the 2014 campaign; this result differed from the decreasing trend of land use observed at the survey location. All campaign results are shown in Supplementary Fig. S1. The median value of the carborne survey was decreasing over time, unlike those of the two other survey methods. Therefore, the decline of the dose rates on asphalt started earlier than that in the surrounding environment.

Comparison of the different survey methods. (A–C) scatter diagram and (D–F) histogram of number of relative deviations. (A) Correlation of airborne survey (AS) and fixed point survey (FS). (B) Correlation of airborne survey and backpack survey (BS). (C) Carborne survey (CS) and airborne survey. RD, relative deviation.
2. Location Factor
The time dependence of the urban location factors after the accident was estimated from big data of the four survey methods. Golikov et al. [6] observed that the location factors of virgin sites, such as parks and grassy plots, are relatively constant, whereas an evident decreasing trend is observed for hard surfaces, such as asphalt. In Fig. 7, the results of the airborne survey are expressed as the air dose rates of the area average, as the surveys were performed in a relatively large area. In contrast, the location of the fixed point survey was an almost unpaved ground, such as school grounds and parks, while the living area data were obtained by the backpack survey. Furthermore, the carborne survey data were measured on paved roads. The location factor was defined as the ratio of the air dose rate to the air dose rate on unpaved grounds (fixed point survey) which was obtained immediately after the accident. The dose rates, which are derived only 134Cs and 137Cs, of some type of situations (land use) are able to estimate by normalization from the air dose rates on the unpaved grounds at the time of post-accident.

Image for the characteristics of the four survey methods. By taking consideration of these characteristics, four survey methods were expressed the following; the airborne survey (area average), the fixed point survey (unpaved ground), the backpack survey (living area), and the carborne survey (paved road), respectively.
According to Fig. 8, the location factors varied significantly depending on land use. All data plots are shown in Supplementary Fig. S2. The a2 which is the parameter of long-term effect ranged from 0.26 to 0.49, while the half-life of the air dose rate ranged from 1.2 to 1.6 years. In particular, the a2 of the area average was the highest across the entire campaign, as forest and mountainous areas were included in the measuring range of the airborne survey (Fig. 7). The location factor of the paved roads showed the lowest values because the radiocesium can be easily washed away by rainfall. Moreover, the lower location factor of the living areas compared with that of the unpaved roads may be due to the decontamination processes that started in 2013 or the wash-off effect of sidewalks. Such decrease in the dose rates of roads by the wash-off effect has been reported by other studies [17, 18].

Comparison of the location factor. Location factor was geometric mean values of air dose rates are normalized based on the extrapolation value of the fixed-point survey at time zero. The fitting curve was shown in Equation (2).
The fitting parameters of the location factor (a1, a2, and T1/2), which were the representative parameters of the FDNPP accident, were compared with the corresponding parameters of the Chernobyl accident, as shown in Table 2 [6]. The T1/2 value of paved roads was the lowest among all locations and was similar to the T1/2 determined for asphalt after the Chernobyl accident. Moreover, the a2 parameter of the unpaved grounds was considerably lower than the a2 value of the virgin land of Chernobyl. This numerical difference may be attributed to the difference in soil quality or influence of the decontamination. It may also depend on the variation in the quantity of data from the example of the Chernobyl accident. More detailed analysis is necessary to elucidate this mechanism. Overall, the comparison study revealed that the decreasing trend in Fukushima started earlier than that in the Chernobyl accident case [19].

Fitting Parameters
Conclusion
In this study, we summarized the survey results acquired nine years after the FDNPP accident. We prepared a representative dataset to extract 1×1 km2 meshes from which the results of four different surveys were obtained. The characteristics of each survey’s results were then evaluated using this dataset, as they depended on the survey objects. The dataset analysis revealed that, for example, the results of the carborne survey were smaller than those of the airborne, fixed point, and backpack surveys because the measuring range of carborne surveys is limited to paved roads. The location factors of different land uses were also evaluated considering the characteristics of the four survey methods. Nine years after the FDNPP accident, the location factor was evaluated ranged from 0.26 to 0.49. These values indicate the rate of decrease due to factors other than the half-life of radiocesium from the accident. The half-lives obtained in this study (from 1.2 to 1.6 years) can be used to predict post-accident dose rates. Moreover, the decreasing trend in the air dose rate of the FDNPP accident was similar to the results obtained after the Chernobyl accident. These parameters will be useful for prediction of the future exposure dose at the post-accident. Therefore, these trends should be carefully evaluated in future research using the results of a continuous survey.
Notes
This paper is an invited paper recommended by the Japan Health Physics Society (JHPS).
Conflict of Interest
No potential conflict of interest relevant to this article was reported.
Author Contribution
Data curation: Sanada Y. Formal analysis: Ishida M, Yoshimura K. Visualization: Ishida M. Methodology: Sanada Y, Mikami S. Writing - original draft: Sanada Y. Writing - review & editing: Yoshimura K, Mikami S.
Acknowledgements
This study was performed as part of the mapping project and the airborne survey project funded by the Ministry of Education, Culture, Sports, Science, and Technology (MEXT) and the NRA, Japan.
Supplementary Materials
Supplementary materials can be found via https://doi.org/10.14407/jrpr.2021.00171.