Effects of Fully Filling Deep Electron/Hole Traps in Optically Stimulated Luminescence Dosimeters in the Kilovoltage Energy Range
Article information
Abstract
Background
This study investigated the characteristics of optically stimulated luminescence dosimeters (OSLDs) with fully filled deep electron/hole traps in the kV energy ranges.
Materials and Methods
The experimental group consisted of InLight nanoDots, whose deep electron/hole traps were fully filled with 5 kGy pre-irradiation (OSLDexp), whereas the non-pre-irradiated OSLDs were arranged as a control group (OSLDcont). Absorbed doses for 75, 80, 85, 90, 95, 100, and 105 kVp with 200 mA and 40 ms were measured and defined as the unit doses for each energy value. A bleaching device equipped with a 520-nm long-pass filter was used, and the strong beam mode was used to read out signal counts. The characteristics were investigated in terms of fading, dose sensitivities according to the accumulated doses, and dose linearity.
Results and Discussion
In OSLDexp, the average normalized counts (sensitivities) were 12.7%, 14.0%, 15.0%, 10.2%, 18.0%, 17.9%, and 17.3% higher compared with those in OSLDcont for 75, 80, 90, 95, 100, and 105 kVp, respectively. The dose accumulation and bleaching time did not significantly alter the sensitivity, regardless of the filling of deep traps for all radiation qualities. Both OSLDexp and OSLDcont exhibited good linearity, by showing coefficients determination (R2) >0.99. The OSL sensitivities can be increased by filling of deep electron/hole traps in the energy ranges between 75 and 105 kVp, and they exhibited no significant variations according to the bleaching time.
Introduction
Optically stimulated luminescence dosimeters (OSLDs) have been widely used for medical dosimetry because of their excellent dosimetric performances, such as low energy dependency, low angular dependency, and high reproducibility [1–6]. Thus, OSLDs have been popular in the field of radiotherapy for the verification of accurate dose delivery. Not only in the megavoltage energy ranges, however, in vivo dose measurement is also crucial in kilovoltage energy ranges because of the importance of accurate assessment of the risk-to-benefit ratio associated with radiation and continuous increasing use of image-guided radiation therapy (IGRT) [7–10]. Aznar et al. [11] demonstrated that although the use of OSLDs in film/screen mammography exhibited good reproducibility and linearity, energy dependence of approximately 18% between 23 and 35 kV were also observed.
Although most studies have evaluated the computed tomography (CT) doses with OSLDs demonstrating good correlation between OSLD and ion chamber measurements, all authors agreed that their energy dependence hinders their clinical applications [12, 13]. This is mainly because of over-response characteristics owing to the relatively high effective atomic numbers of constituent materials (aluminum oxide doped with carbon, Al2O3:C) in diagnostic energy ranges [8, 9]. A significant problem occurs for the use of OSLD with cone-beam CT [14], as the absorbed doses can be contributed by various overlapping projections, including the primary radiation of entrance/exit incidences and scattering from many rays [15]. Each incidence ray might possess different mean energies owing to the different degrees of beam hardening. The inherent energy dependence of OSLDs in diagnostic energy ranges have even prohibited their widespread applications. Although several efforts have been made to compensate for the energy dependency by applying correction factors [8, 9, 16], they are still vulnerable to detectors whose sensitivities change with repeated uses.
The mechanism of OSL dosimetry is often explained using the energy-band theory [3, 17, 18]. When OSLDs are irradiated, free electrons and holes are first generated, and the resultant OSLD signal became stable [3, 18]. At room temperature, electrons captured by dosimetric traps can be retained for >100 days, revealing insignificant amounts of fading, whereas those captured by shallow electron traps are easily released within a few minutes [2, 19, 20]. Radiation generated electrons and holes captured in dosimetric traps can be released by light stimulation at wavelengths between 390 and 780 nm [18, 19]. During the irradiation and readout stages, the OSL sensitivities undergo changes according to the dose histories owing to the filling and emptying of deep electron/hole traps [2]. The OSL dose responses tend to exhibit supra-linearity at doses >2 Gy owing to the filling of deep electron/hole and dosimetric traps acting as competitors for high-dose irradiation [2, 20, 21]. Several studies have demonstrated that dose responses can be stabilized by filling deep electron/hole traps [18, 19, 21, 22]. Jursinic [18] demonstrated that pre-irradiation of OSLDs with doses >1 kGy could improve their sensitivities by 2.5 times compared with those without pre-irradiation, resulting in the removal of supra-linearity. In another study, OSLDs with pre-irradiation doses of 5 kGy showed decreased variations in dose sensitivity in the megavoltage energy range [19]. Other studies have demonstrated that the sensitivity can be maintained by using the optimal bleaching wavelength and time conditions. Omotayo et al. reported 3% and 5% accuracies up to the maximum accumulated doses of 7 and 70 Gy with bleaching wavelengths above approximately 495 nm [23]. Furthermore, a previous study demonstrated that the use of a 520-nm long-pass filter in front of the bleaching sources possessing two peaks at approximately 450 nm and 550 nm could maintain the dose sensitivity even under over-bleaching conditions [19]. Despite studies on improving OSL sensitivities in the megavoltage energy range, to the best of our knowledge, those in the kilovoltage energy ranges have not been performed yet.
In this study, we arranged OSLDs with and without filling deep electron/hole traps by 5 kGy pre-irradiation and demonstrated their characteristics, including fading effects, dose sensitivity according to the accumulated doses, and dose linearity in the diagnostic energy ranges.
Materials and Methods
1. Half-Value Layer (HVL) Measurement and Reference Dosimetry
An on-board imaging (OBI) system equipped in Trilogy linac (Varian Medical System, Palo Alto, CA, USA) was used for reference dosimetry. The HVL was measured in terms of the aluminum thickness (mmAl), as described in the American Association of Physicists in Medicine Task Group 61 (AAPM TG-61) protocol [24]. An Exradin A12 Farmer-type ionization chamber (Standard Imaging, Middleton, WI, USA) was placed at the isocenter, and the attenuating material (Al) was placed 50 cm away from the focal spot. The blade opening was set to 4 cm×4 cm. The HVL was approximately half of the chamber readout relative to that without aluminum. Once the HVLs for each energy were obtained, the in-phantom method in the AAPM TG-61 protocol was used to measure the absorbed dose to water at the reference depth of 2 cm (Dw,z=2cm) for a 10 cm×10 cm field defined at a source-to-surface distance of 100 cm using [24]
A chamber was calibrated from the secondary standard dosimetry laboratories by the M60 and M150 beam codes with 2.5% uncertainty. M stands for the integrated charge reading corrected for perturbation factors [24]. The calibration factor (NK), overall chamber correction factor (PQ,cham), and in-phantom mass energy-absorption coefficient ratio (
OBI utilizes various imaging protocols from 65 to 105 kVp according to the anatomy being imaged. Peak tube potentials from 75 (3.09 mmAl) to 105 kVp with 5 kVp intervals were used, because PQ,cham and
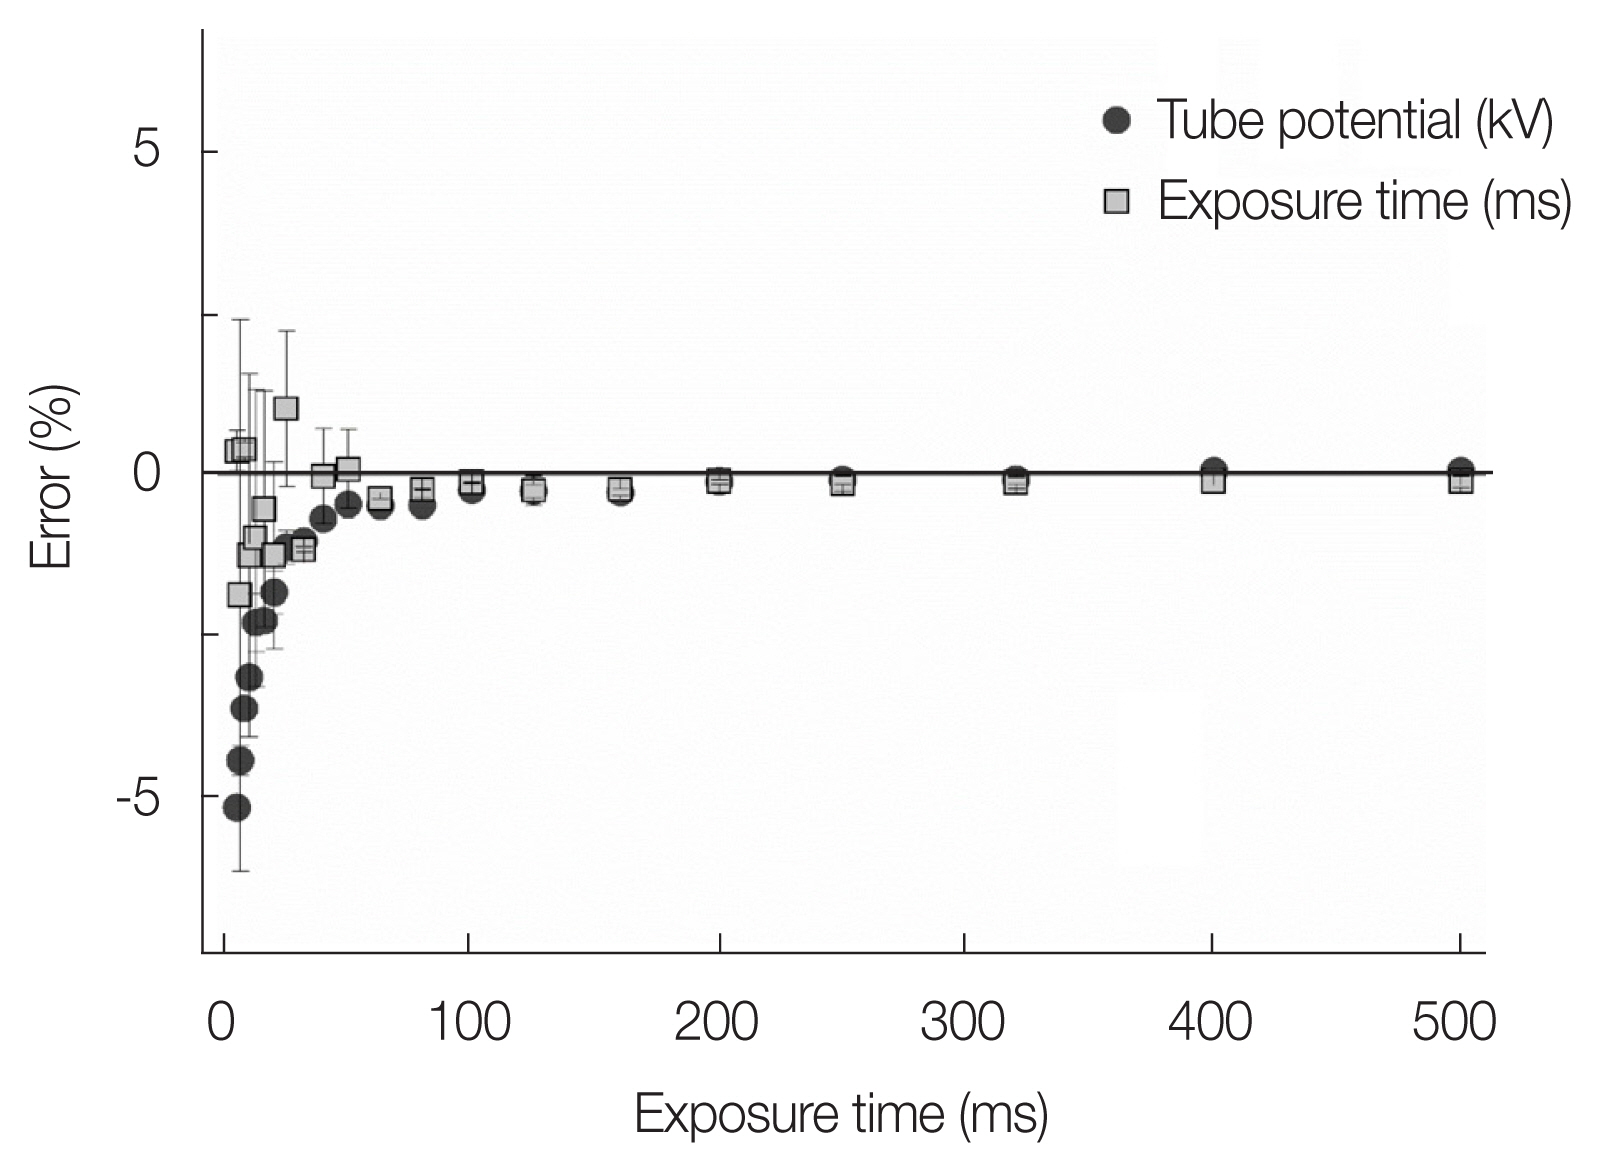
Accuracy of measurements on the tube potential and exposure time at 105 kVp as a function of the exposure time. The error bar indicates the standard deviation of three repeated measurements.
2. Optically Stimulated Luminescence (OSL) Dosimetry System
An InLight complete dosimetry system (Landauer Inc., Glenwood, IL, USA), which contains nanoDot dosimeters, a microStar reader, and InLight microStar reader software (IMRS version 4.3), was used in this study. The active element of a nanoDot dosimeter consists of Al2O3:C, and its diameter and thickness are 5 and 0.3 mm, respectively. This is enclosed within a plastic case, which measures 10 mm×10 mm× 2 mm. A microStar reader employs a light source with a continuous-wave OSL mode to stimulate detectors, and the light emitted by the OSL is proportional to the radiation dose and intensity of the stimulating light [2]. A total of 38 LEDs were arranged, of which only six are used for high-dose readout (weak beam), whereas all LEDs are used for low dose readout (strong beam) [8, 27]. The median wavelength of LEDs was 532 nm, and the light illumination lasted for 1 second regardless of the readout mode [19, 27]. The readout mode can be selected in the IMRS software, and the strong beam readout mode was used in this study.
Before reading test results, reader quality control tests were performed to assess the variability of the photomultiplier tube (PMT) signals [8]. The dark counts (DRK) with the LEDs turned off were measured to determine the background signal of the reader, and successive DRKs less than 30 PMT counts were desired. Counts from the PMT using a small amount of 14C source (CAL) were measured to check the consistency of the PMT, and these variations should be less than ±10% across measurements [8]. Counts from the PMT with a filter shutter opened and LEDs turned on were measured to check the beam intensity; these variations should be less than ±10% across measurements [8]. After irradiating the OSLDs, the microStar reader and the IMRS software were used to read the OSL signal counts. Each OSLD was read three times, and the average reading with a coefficient of variation of <1% was used.
After OSLD readout, all dosimetric traps were cleared using a bleaching device (Hanil Nuclear, Inc., Anyang, South Korea), which had 38 LED chips (ATI-5730PWHB-L; ATI LED Inc., Jiangsu, China) with a 15-W 6100-K color temperature. The 520-nm long-pass filter (Edmund Optics, Inc., Barrington, NJ) was placed in front of the LED chips to block wavelengths <520 nm. As annealing using LED sources with a 520-nm long-pass filter left the deep electron and hole trap untouched, this LED and filter combination was used for both the control and experimental groups [19].
3. Experimental Setup
To identify the characteristics of OSLDs with and without kGy irradiation, OSLDs pre-irradiated (OSLDexp) by 5 kGy using 60Co sources from a gamma irradiation system (JS-10000; Nordion, Ottawa, Canada) were designated as the experimental group, where those without pre-irradiation were selected as the control group (OSLDcont). After 5 kGy pre-irradiation, the readout–bleaching–readout process was performed when the signal counts reached the background level. Bleaching was conducted using the 520-nm long-pass filter for both groups. In this process, the weak-beam readout mode was used owing to the higher number of free electrons captured in both the dosimetric and deep electron/hole traps. For the first time, the bleaching of OSLDscont to remove electrons captured in the dosimetric trap, and the, bleaching–readout cycles were repeated until a stable mean signal level was observed. The weak-beam readout was used in this stage. To determine the optimal bleaching time, six OSLDsexp and six OSLDscont irradiated with high and low doses along with high and low energies (75 and 105 kVp) were subjected to repeated readout–bleaching–readout cycles until the signal plateau was observed. While the following subsections described several characteristics of OSLDcont and OSLDexp, the dose-rate dependency characteristic in the kV range could not be obtained using OBI under the current experimental condition.
1) Fading effect
Two OSLDsexp and two OSLDscont were exposed to doses of 3.72 mGy with 75 kVp and 7.97 mGy with 105 kVp. Immediately after irradiation, the mean and standard deviation of the OSL counts over time were acquired.
2) Dose sensitivity according to the accumulated dose
Unit doses were determined as 0.372, 0.434, 0.501, 0.571, 0.645, 0.721, and 0.797 mGy for 75, 80, 85, 90, 95, 100, and 105 kVp, respectively. The experiment was performed on three OSLDscont and three OSLDsexp for each energy source. The irradiation–readout–bleaching cycles were repeated until the sensitivity exhibited the deviation less than 1%. To determine the dose sensitivity according to the accumulated dose, the initial six irradiations were performed after bleaching with an optimal bleaching time (3.5 days), whereas the next six irradiations were performed after bleaching with an over-bleaching time (7 days). Irradiations were performed using a hundredfold higher unit doses. According to the accumulated doses, the sensitivity was recorded as signal counts normalized by average counts across three OSLDscont without accumulation.
3) Dose linearity
Counts with no exposures and those with five-times higher unit doses were used for linear fitting. The coefficients of determination (R2) were calculated to quantify the linear regression of the fitting at half, twice, and five-times higher unit doses for all energies. Furthermore, residuals between the OSL counts and those from the fitted curves were plotted to demonstrate linearity.
Results and Discussion
1. Absolute Dosimetry
The AAPM TG-61 protocol introduces two approaches, i.e., the in-air and in-phantom methods, which can be applied from 40 to 300 kV [24]. While the method should be selected based on the appropriate energy range, certain factors in the in-air method were unavailable. These include backscatter factors for square field sizes and those without cones and mass energy-absorption coefficients for source-to-surface distance of 100 cm [24, 28], which cannot be applied to the OBI in the Trilogy linear accelerator. We selected the in-phantom method because the same tube potential can generate different HVLs and peak tube potential with appropriate pre-filtration as stated in the HVL ranges provided by the National Research Council of Canada [24]. Owing to the limited information about PQ,cham and the mass energy-absorption coefficient for HVLs less than 2.9 mmAl, we only utilized the beam qualities between 75 and 105 kVp [24]. Although all protocols utilized a tube current of 200 mA, the exposure time varied from 16 to 400 ms according to the OBI protocol provided by the manufacturer. Based on our accuracy measurements of the tube potential and the exposure time with the RTI Black Piranha detector, deviations of −0.13% were observed in the tube potential measurement (Fig. 1). In this study, this uncertainty was mitigated by adopting the exposure time of 40 ms.
2. First Time Bleaching for OSLDexp
The bleaching–readout process for five OSLDsexp is provided in Fig. 2 as a function of the bleaching time. In this stage, the weak beam mode was used to read out OSL counts. The mean readout without bleaching was 4.63×10⁶ counts, and it is assumed that the count losses throughout multiple readouts are negligible. Although the mean OSL counts decreased exponentially and reached approximately 150 counts within a half-day, they diminished slowly after a half-day. Finally, the mean OSL signal took approximately 3 days to reach the background level (<100 counts), which corresponds to absorbed doses <0.1 mGy.
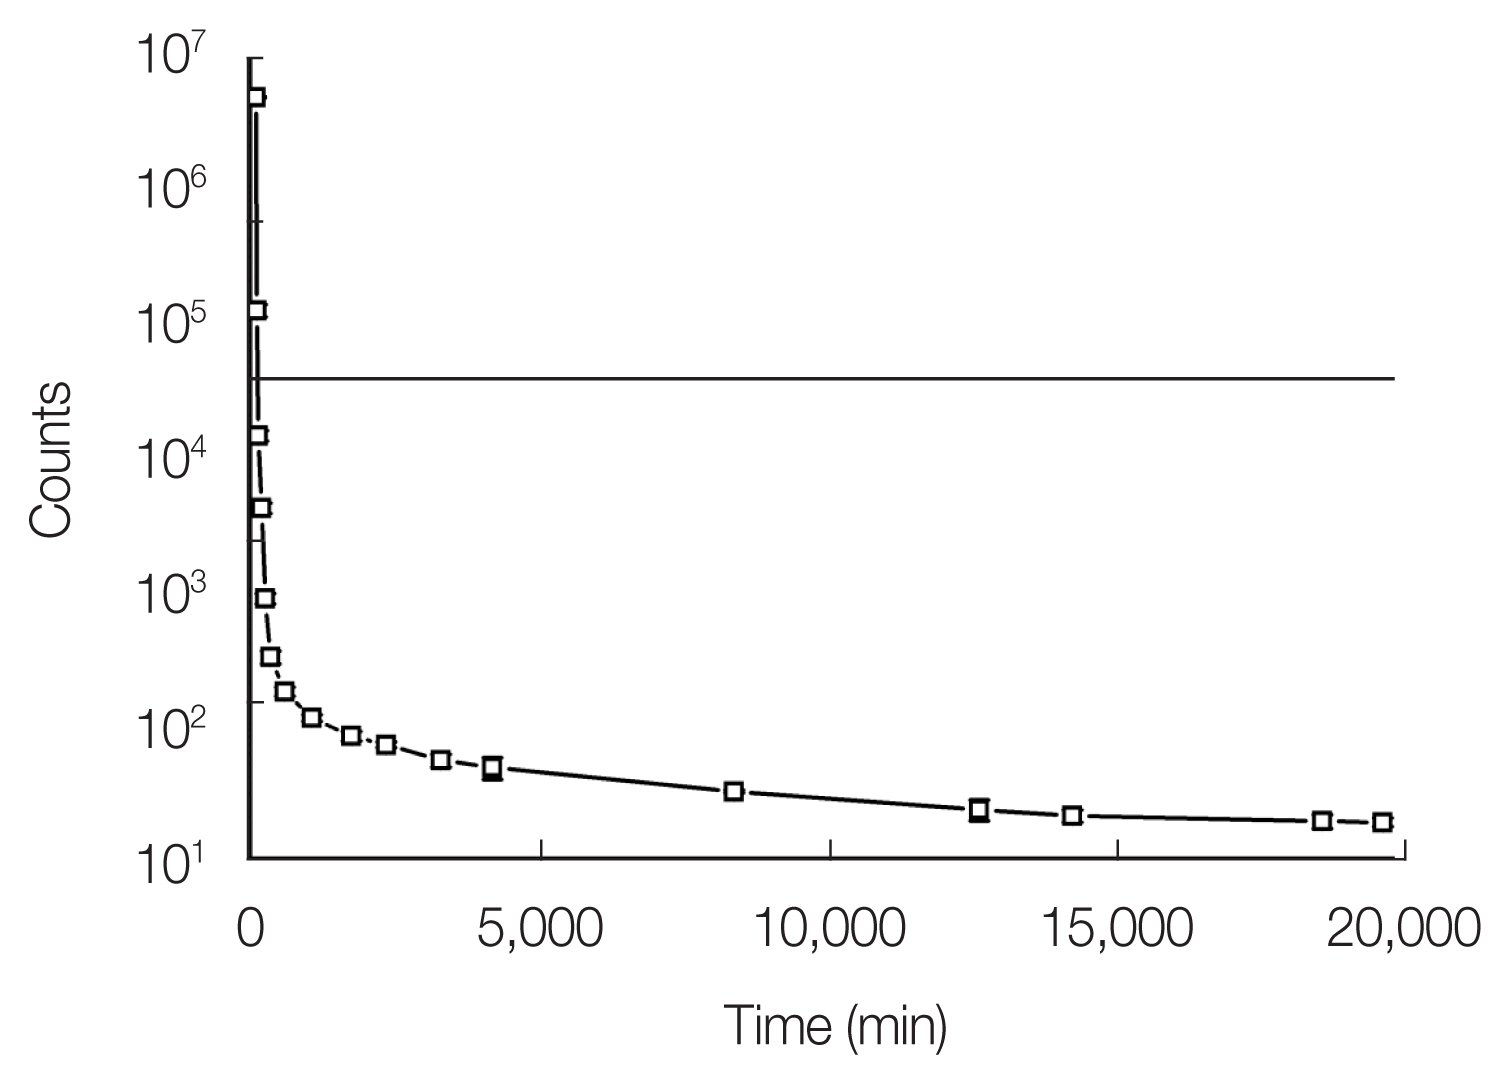
Counts for the first time bleaching of OSLDexp as a function of the bleaching time. The error bar represents one standard deviation from five OSLDsexp. OSLDexp, pre-irradiated optically stimulated luminescence dosimeter.
3. Determination of the Optimal Bleaching Time
The OSL counts according to the bleaching time are presented in Fig. 3. The experiment was performed using high and low dose levels for 75 and 105 kVp, respectively. Low doses were set as unit doses while high doses were obtained at a 50-times higher unit dose, whereas correspond to 0.372 mGy and 18.59 mGy for 75 kVp, and 0.797 mGy and 39.85 mGy for 105 kVp, respectively. Regardless of beam quality and dose levels, the OSL counts decreased exponentially. The OSL counts decreased exponentially within 6 hours and reached a plateau. For OSLDsexp and OSLDscont, regardless of high and low doses, 5,000 minutes (around 3.5 days) were found to be sufficient to reach a stable background level. Thus, we heuristically selected 3.5 days as the optimal bleaching time and 7 days as the overbleaching time. When the OSL became stable, the counts for OSLDsexp were greater than those of OSLDscont. Because the deep electron/hole traps were fully filled in the OSLDexp group, one can speculate that the electrons liberated by irradiation were trapped in the dosimetric traps more likely in the OSLDexp. This can be applied for both low- and high-dose irradiations, regardless of the utilized energy (Fig. 3).
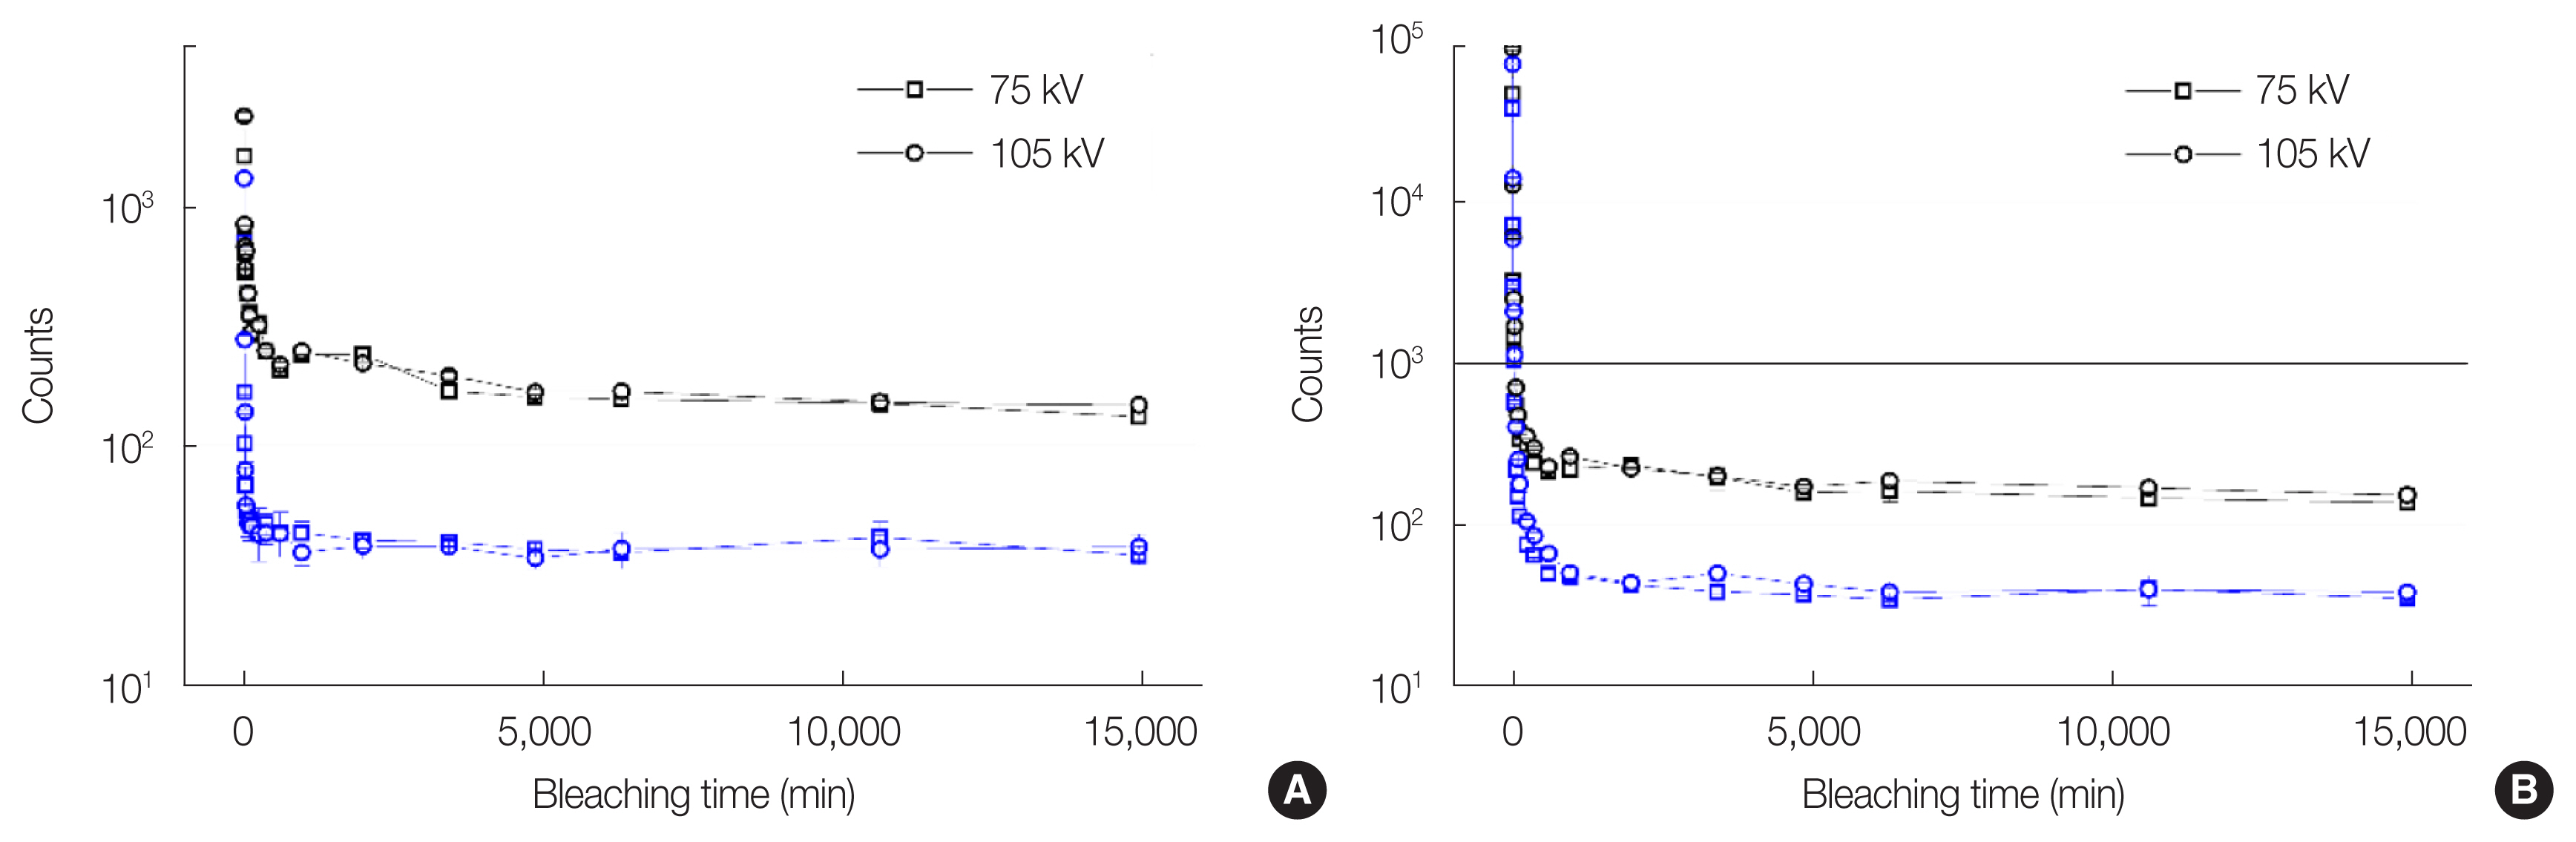
Estimation of the optimal bleaching time for (A) low doses (0.372 and 0.797 mGy for 75 and 105 kVp, respectively) and (B) high doses (18.59 and 39.85 mGy for 75 and 105 kVp, respectively). The blue data points indicate OSLDcont whereas those in black represent OSLDexp. The error bars indicate one standard deviation from three readouts. OSLDexp, pre-irradiated optically stimulated luminescence dosimeter; OSLDcont, non-pre-irradiated optically stimulated luminescence dosimeter.
4. Fading Effect
As shown in Fig. 4, the mean OSL counts decreased exponentially within 10 minutes regardless of the delivered dose and beam quality. After 10 minutes, the mean count did not vary significantly. Regardless of dose levels, the count differences between 10 and 60 minutes were less than 100 counts, which corresponded to doses <0.1 mGy for both OSLDsexp and OSLDscont. 10 minutes is sufficient to clear free electrons captured by the shallow electron traps, regardless of the delivered doses and energies. Although this result (10 minutes) varied slightly from earlier studies (30 minutes for potential measurement), a 30-minute application exhibited a similar trend [16]. Furthermore, the results were consistent with those of other studies in radiotherapy environments [3, 19, 29]. In the energy range of 75 and 105 kVp, the sensitivities of OSLDexp improved, from 10.2% to 18.0%, compared with those of OSLDcont. This sensitivity improvements in kV ranges coincided with other studies in MV ranges [18, 19]. The use of optimal- and over-bleaching times did not affect minimizing variations of OSLD sensitivities, regardless of beam qualities. This discordant tendency with other studies of the megavoltage range may attribute to the totally different order of the number of electrons released and occupying deep hole/electron and dosimetric traps [19].
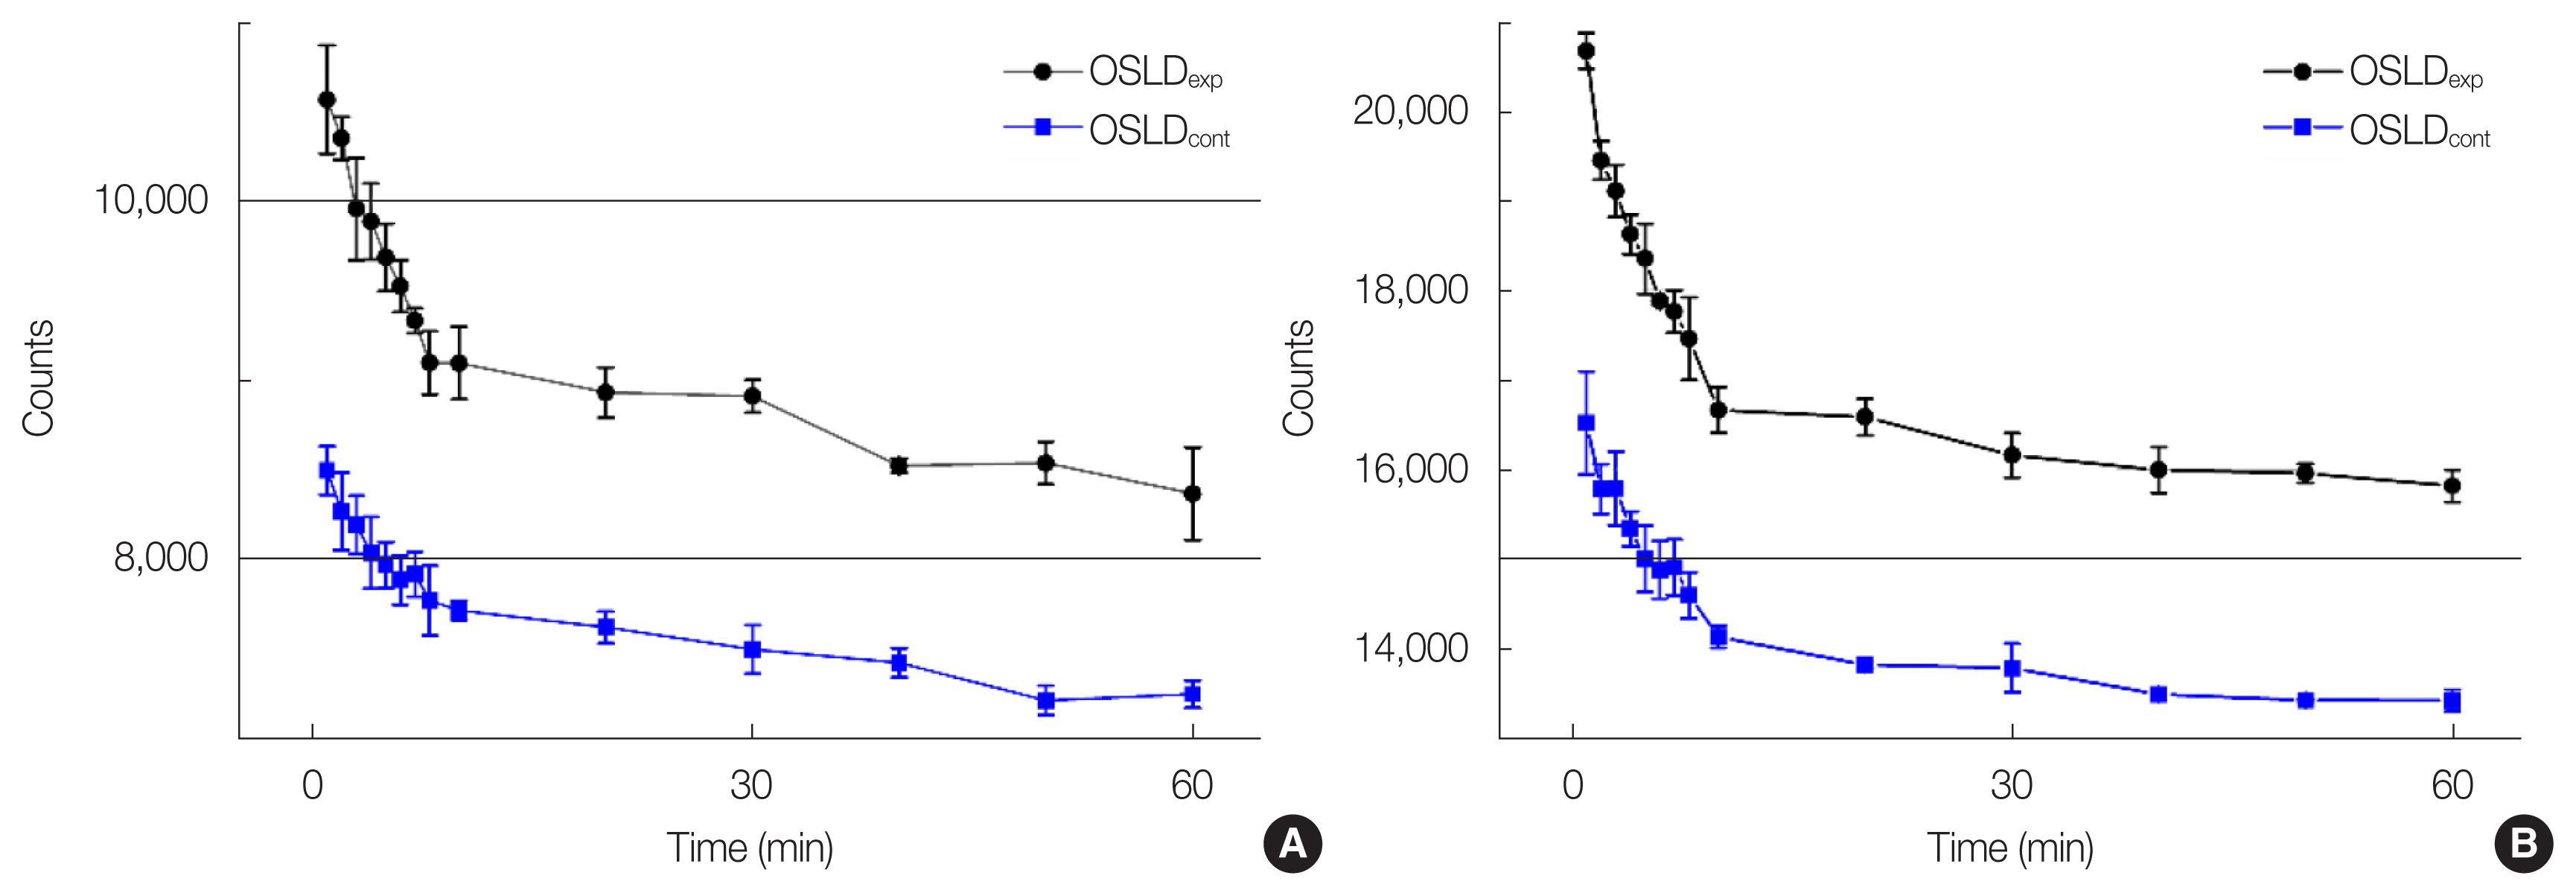
Mean and standard deviation for OSLDs exposed to (A) 3.72 mGy with 75 kVp and (B) 7.97 mGy with 105 kVp. The blue data points indicate OSLDcont while those in black represent OSLDexp. The error bars represent one standard deviation from three readouts. OSLDexp, pre-irradiated optically stimulated luminescence dosimeter; OSLDcont, non-pre-irradiated optically stimulated luminescence dosimeter.
5. Dose Sensitivity
As illustrated in Fig. 5, the dose sensitivities with respect to the bleaching time are presented with normalized counts as a function of accumulated doses. They are obtained as OSL counts divided by OSLDscont counts at 0 mGy. The dose sensitivities from OSLDexp were greater than those from OSLDcont for all seven beam qualities. Specifically, the averages on OSLDsexp showed 12.7%, 14.0%, 15.0%, 10.2%, 18.0%, 17.9%, and 17.3% higher normalized counts than those on the OSLDscont for 75, 80, 90, 95, 100, and 105 kVp, respectively. The bleaching time did not significantly affect the dose sensitivities as the normalized count tendencies for both OSLDsexp and OSLDscont were not changed after over-bleaching (Right side of the red dotted line in Fig. 5.).
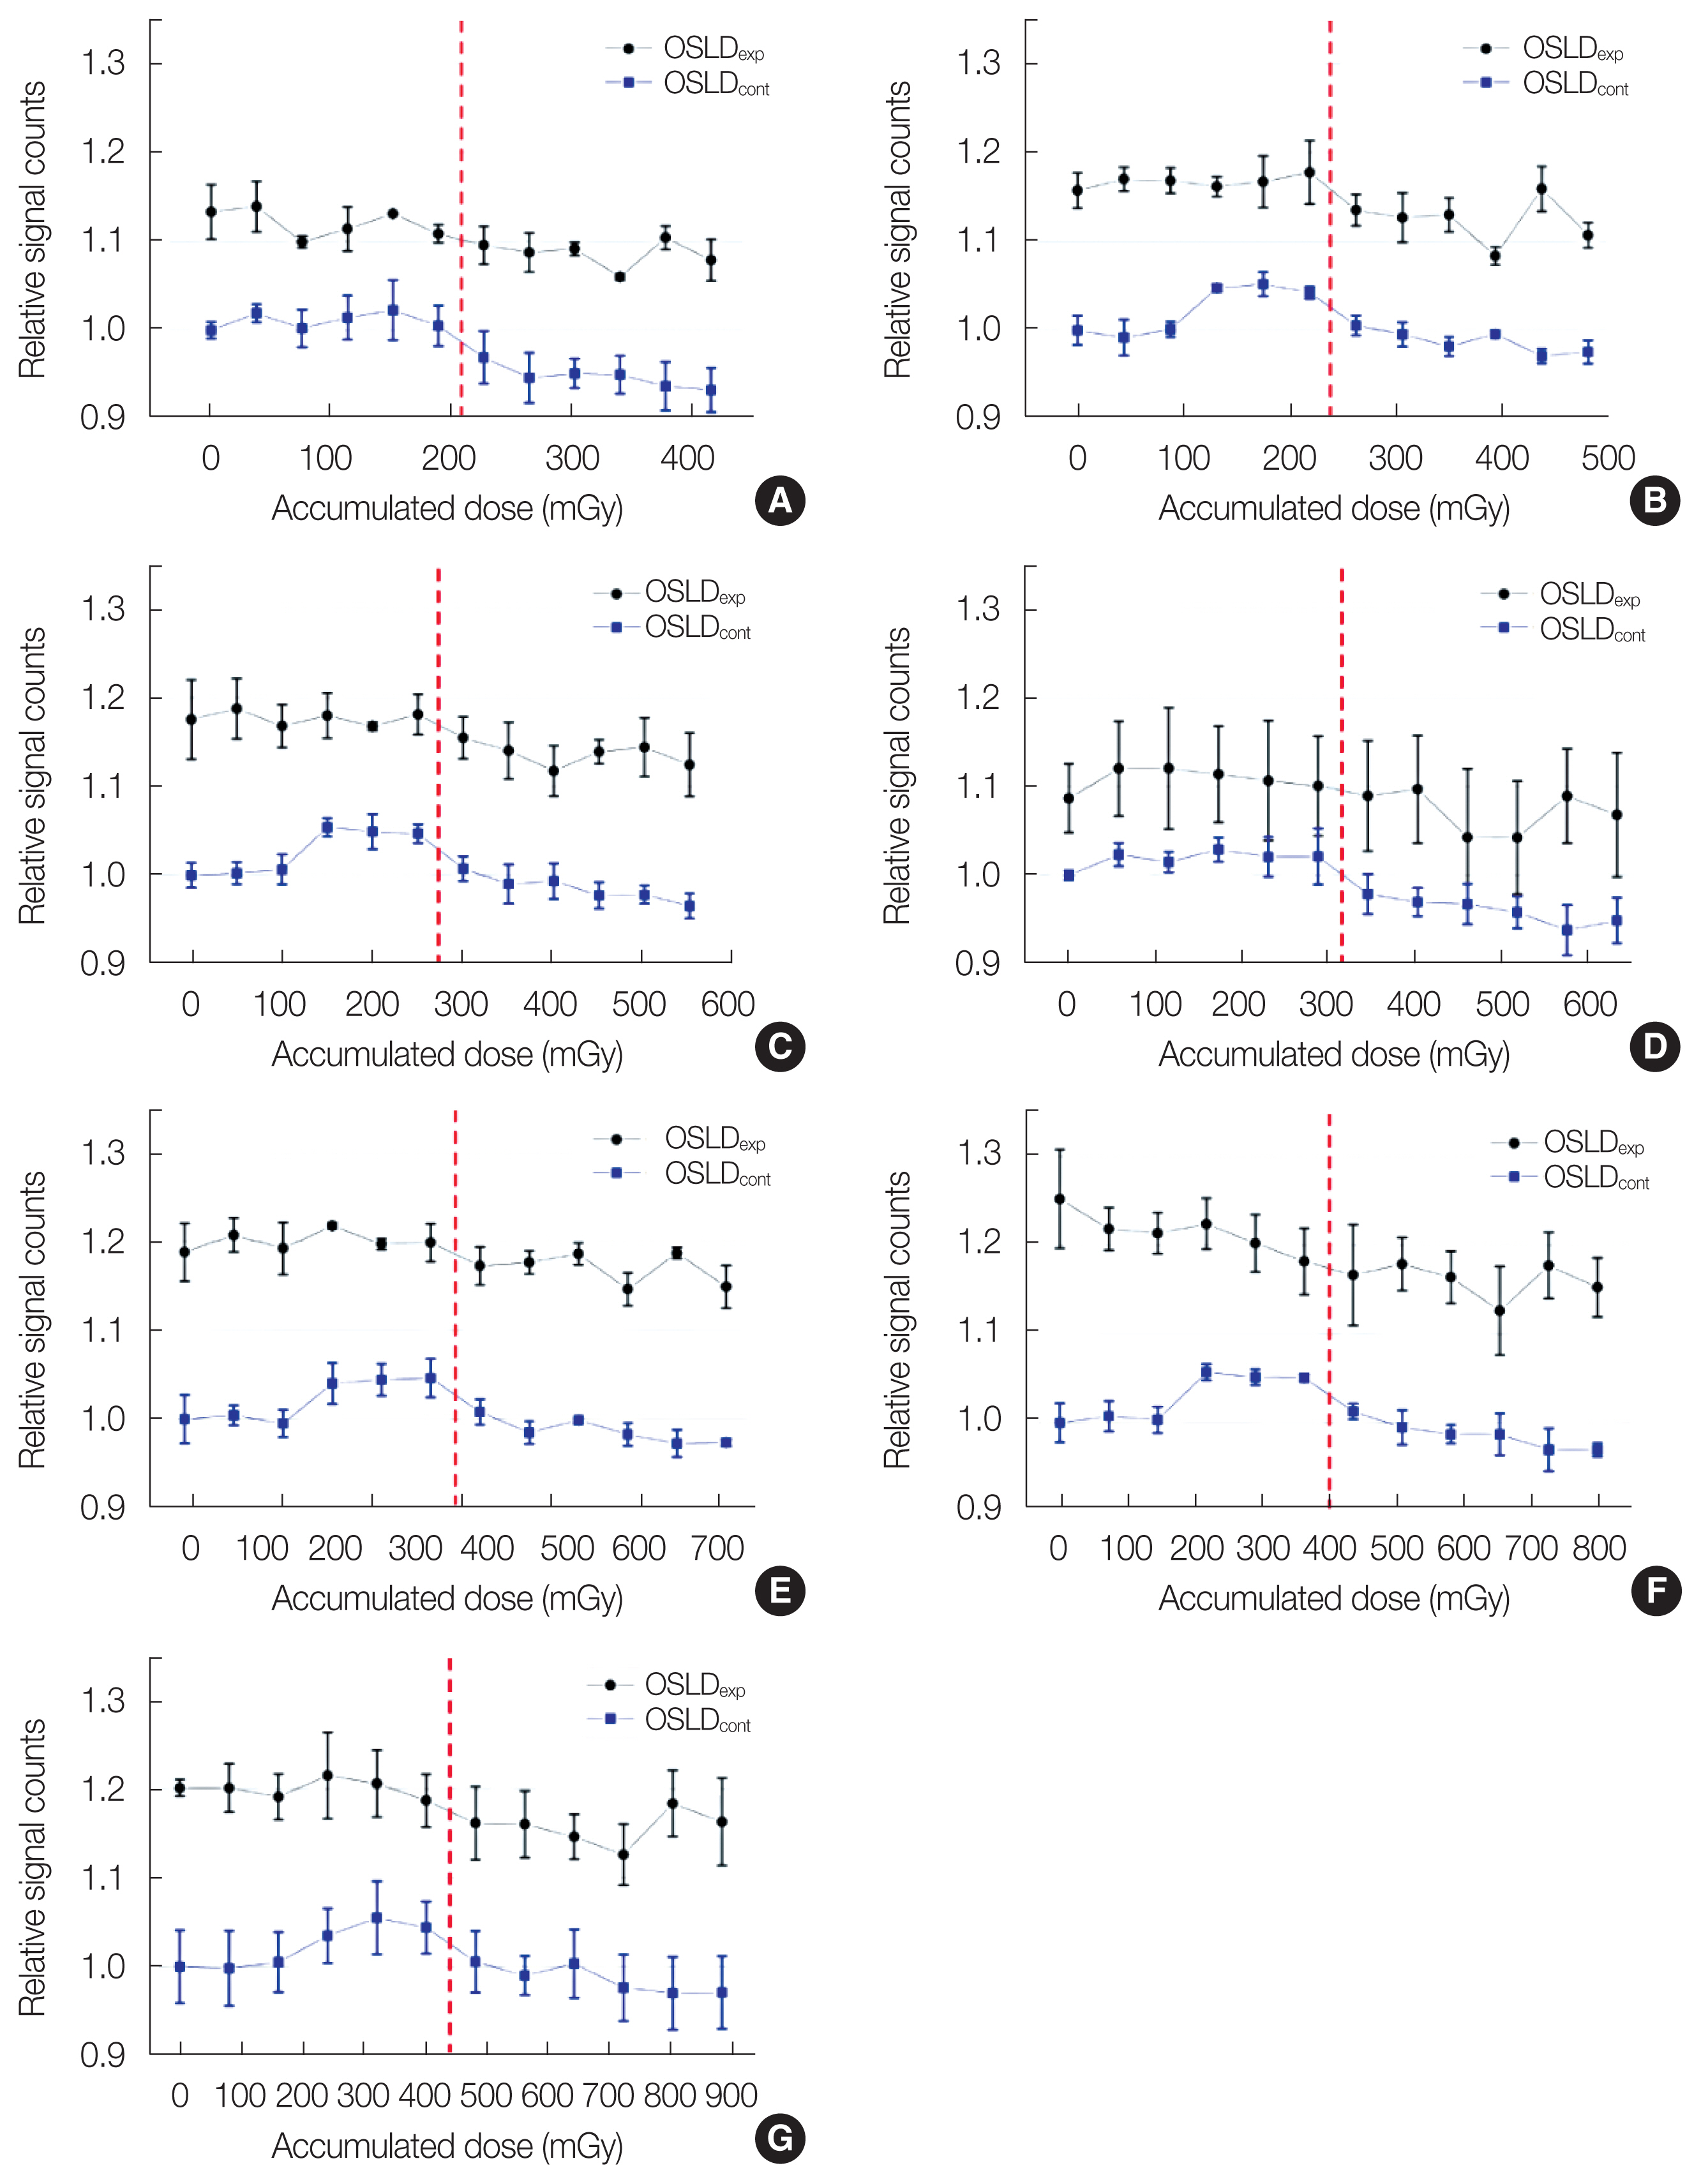
Sensitivities of OSLDs shown as PMT counts normalized to those for OSLDcont at 0 mGy. The blue data points indicate OSLDscont while those in black represent OSLDsexp. The data points before the dotted red vertical line showed the dose sensitivity with optimal bleaching time (3.5 days), whereas those after the line presented their sensitivity with over-bleaching time (7 days). The graphs correspond to (A) 75 kVp, (B) 80 kVp, (C) 85 kVp, (D) 90 kVp, (E) 95 kVp, (F) 100 kVp, and (G) 105 kVp, and error bars represent one standard deviation from three mean normalized OSL counts. OSLDexp, pre-irradiated optically stimulated luminescence dosimeter; OSLDcont, non-pre-irradiated optically stimulated luminescence dosimeter.
6. Dose Linearity
As provided in Fig. 6A and 6B, excellent linearity was observed between doses and OSL counts regardless of OSLDexp and OSLDcont for all energies. The R2 values between delivered doses and OSL counts were all >0.99 (p<0.05). The residual counts between calculation and estimation in Fig. 6C and 6D were all <500, regardless of the OSLDexp and OSLDcont and energies.
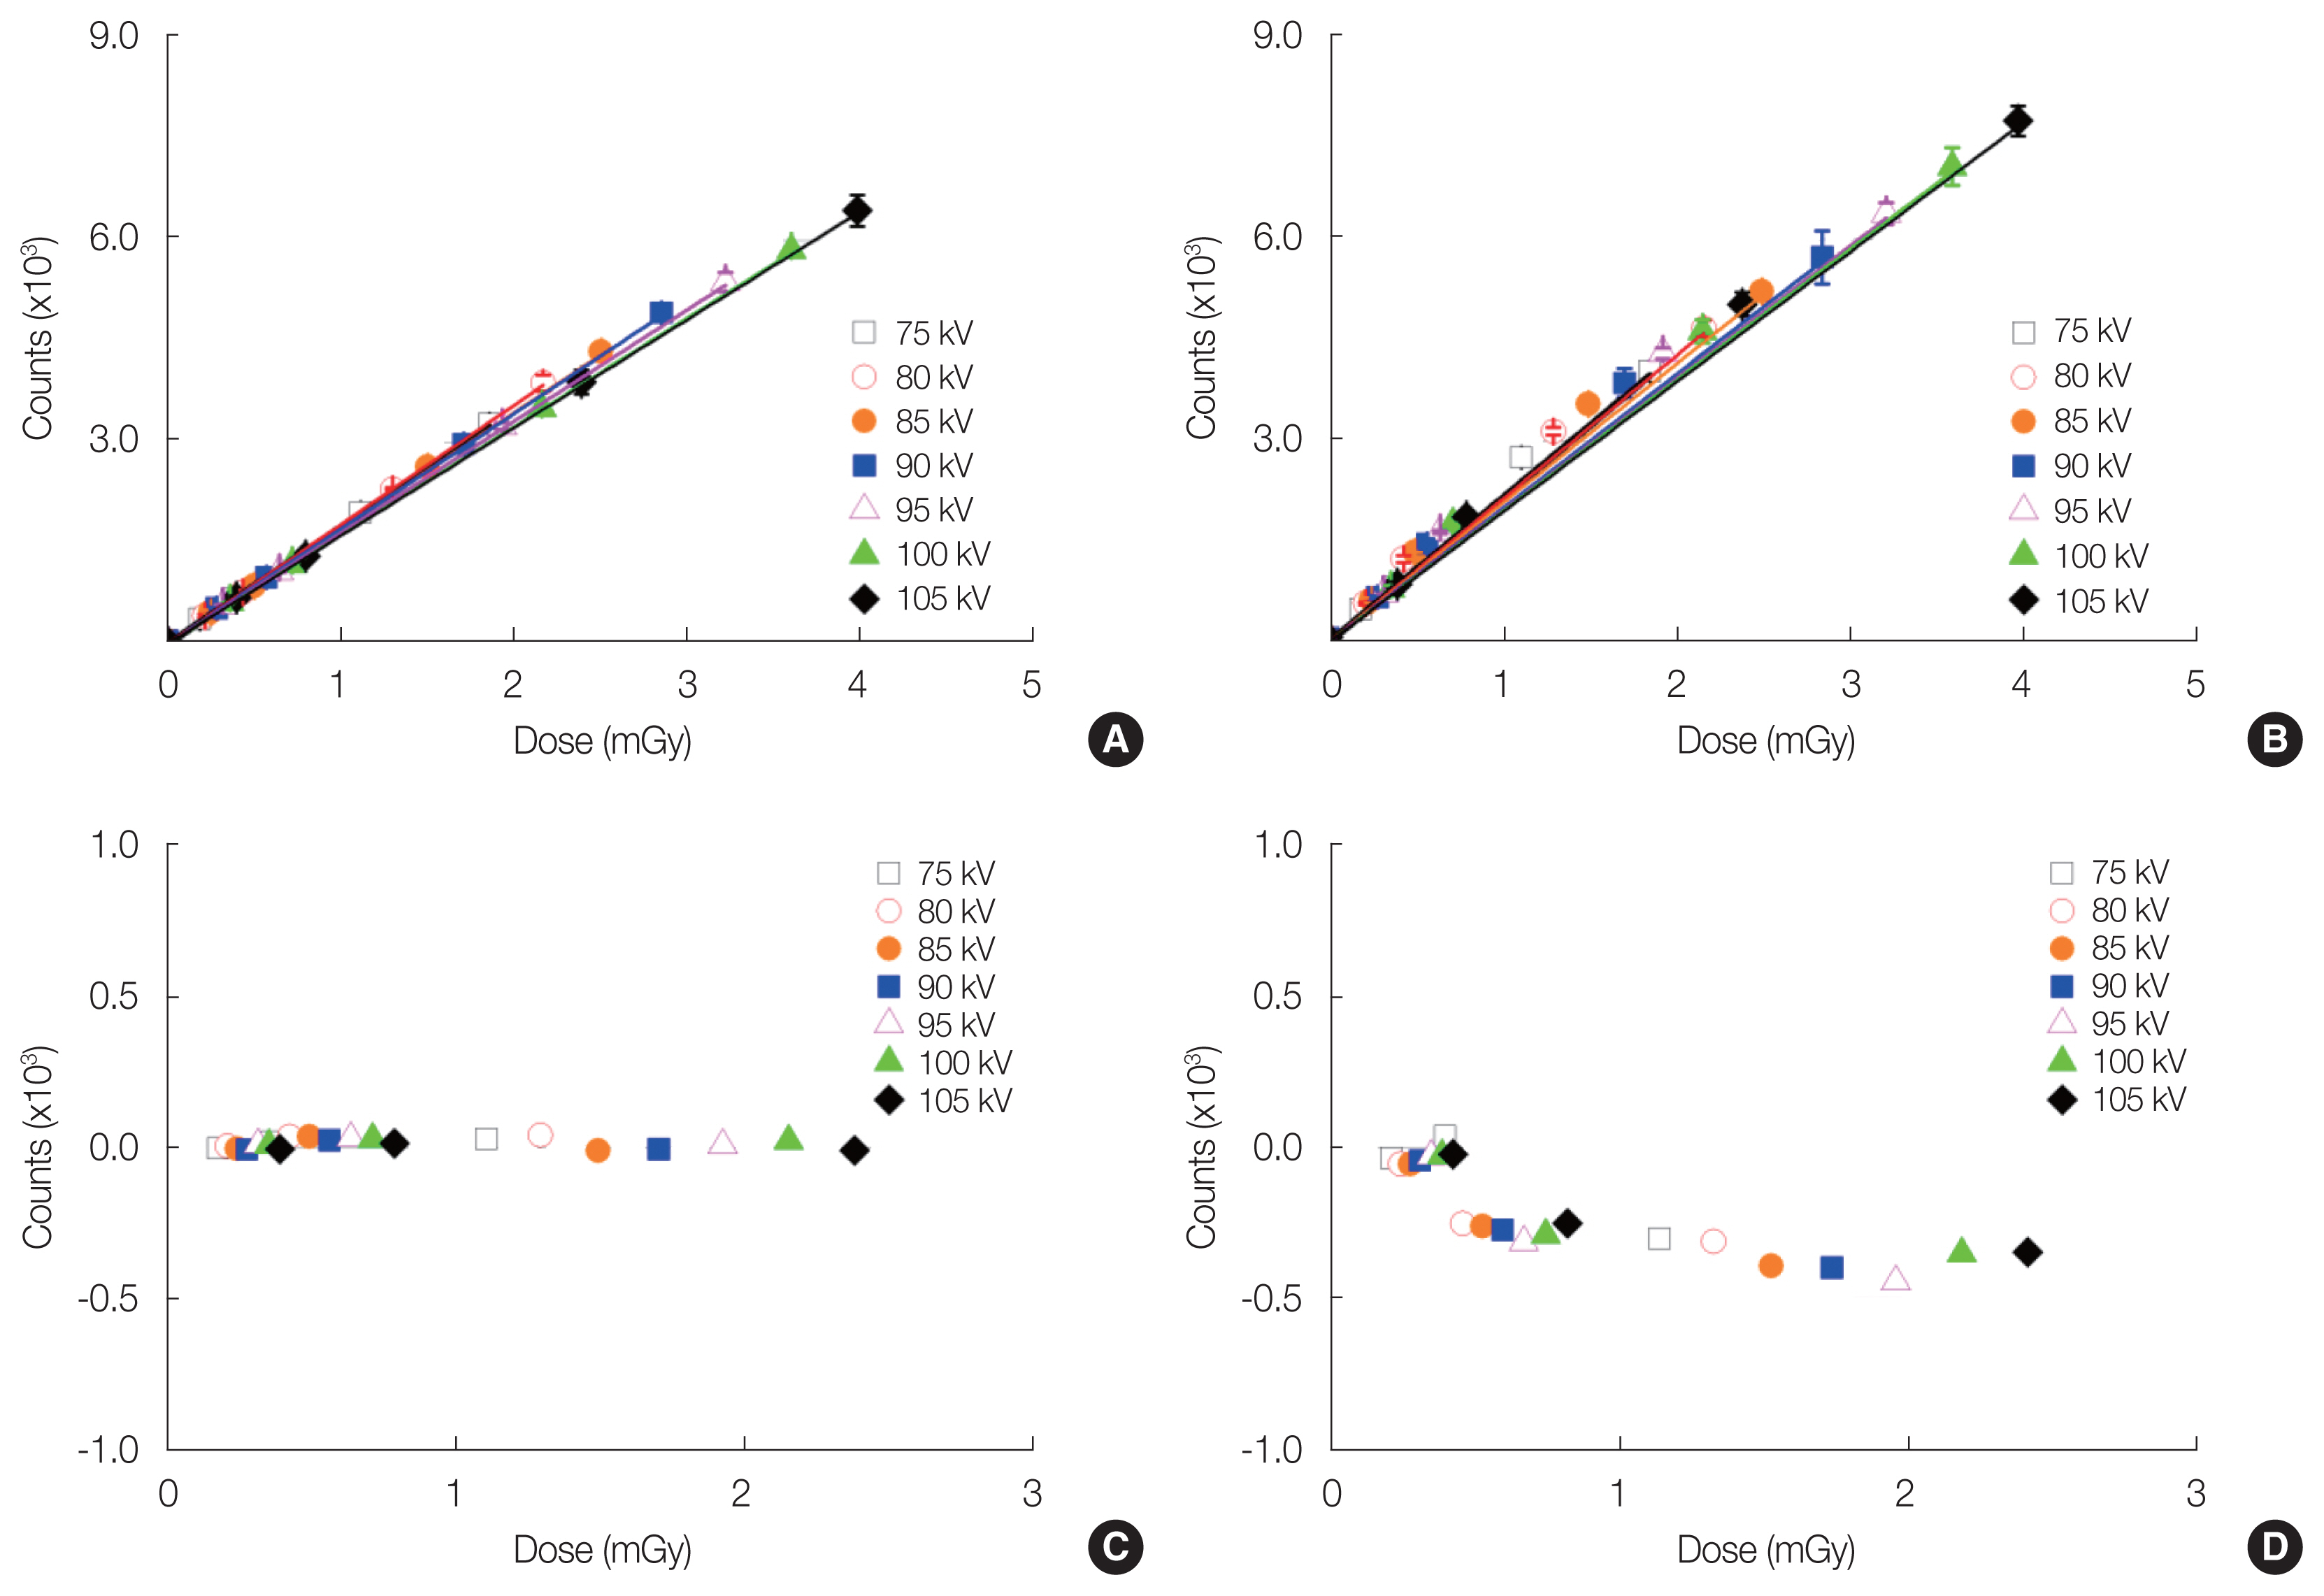
Linearity between delivered doses and OSL counts for (A) OSLDcont and (B) OSLDexp, showing all R2 >0.99. The residual counts between obtained and estimated counts for (C) OSLDcont and (D) OSLDexp were <500. OSLDexp, pre-irradiated optically stimulated luminescence dosimeter; OSLDcont, non-pre-irradiated optically stimulated luminescence dosimeter.
Conclusion
This study reported the sensitivity improvement of OSLDs from 10.2% to 18.0% in the energy ranges between 75 and 105 kVp by fully filling deep hole/electron traps. Accumulated doses, regardless of the filling status of deep traps, did not significantly change dose sensitivity. Furthermore, changes in dose sensitivity according to bleaching time were not observed. Both OSLDcont and OSLDexp with optimal bleaching time exhibited good linearity between OSL counts and doses.
Acknowledgements
This work was supported by the National Research Foundation (NRF) of Korea grant funded by the Korean government (NRF-2019R1F1A1041944).
Notes
Conflict of Interest
No potential conflict of interest relevant to this article was reported.
Author Contribution
Conceptualization: Kim J. Data curation: Jin H. Formal analysis: Chun M, Jin H. Methodology: Chun M, Jin H, Kwon O. Visualization: Chun M, Lee SY. Writing - original draft: Chun M. Writing - review & editing: Chun M, Kim J. Investigation: Lee SY. Resources: Park JM. Software: Chun M. Supervision: Choi CH, Park JM, Kim J. Validation: Kwon O, Choi CH.