Investigation on Individual Variation of Organ Doses for Photon External Exposures: A Monte Carlo Simulation Study
Article information

Abstract
Background
The reference dose coefficients (DCs) of the International Commission on Radiological Protection (ICRP) have been widely used to estimate organ doses of individuals for risk assessments. This approach has been well accepted because individual anatomy data are usually unavailable, although dosimetric uncertainty exists due to the anatomical difference between the reference phantoms and the individuals. We attempted to quantify the individual variation of organ doses for photon external exposures by calculating and comparing organ DCs for 30 individuals against the ICRP reference DCs.
Materials and Methods
We acquired computed tomography images from 30 patients in which eight organs (brain, breasts, liver, lungs, skeleton, skin, stomach, and urinary bladder) were segmented using the ImageJ software to create voxel phantoms. The phantoms were implemented into the Monte Carlo N-Particle 6 (MCNP6) code and then irradiated by broad parallel photon beams (10 keV to 10 MeV) at four directions (antero-posterior, postero-anterior, left-lateral, right-lateral) to calculate organ DCs.
Results and Discussion
There was significant variation in organ doses due to the difference in anatomy among the individuals, especially in the kilovoltage region (e.g., <100 keV). For example, the red bone marrow doses at 0.01 MeV varied from 3 to 7 orders of the magnitude depending on the irradiation geometry. In contrast, in the megavoltage region (1–10 MeV), the individual variation of the organ doses was found to be negligibly small (differences <10%). It was also interesting to observe that the organ doses of the ICRP reference phantoms showed good agreement with the mean values of the organ doses among the patients in many cases.
Conclusion
The results of this study would be informative to improve insights in individual-specific dosimetry. It should be extended to further studies in terms of many different aspects (e.g., other particles such as neutrons, other exposures such as internal exposures, and a larger number of individuals/patients) in the future.
Introduction
The International Commission on Radiological Protection (ICRP), following the 2007 Recommendations [1], provides a comprehensive database of reference dose coefficients (DCs) for organ doses and effective doses for external exposures via ICRP Publication 116 (ICRP-116) [2]. The ICRP-116 DCs were produced by conducting Monte Carlo (MC) dose calculations coupled with the adult male-and-female reference voxel phantoms described in the ICRP Publication 110 (ICRP-110) [3]. The ICRP-110 reference phantoms, constructed based on computed tomography (CT) images of persons [4, 5] and matched to the reference values of ICRP Publication 89 [6], are anatomically much more realistic than the older-type stylized phantoms [7] represented by mathematical equations and used for previous DCs of ICRP Publication 74 (ICRP-74) [8].
The ICRP-116 DCs as well as the ICRP-74 DCs, despite the main application to estimate dose quantities (i.e., effective dose and equivalent doses to eye lens and skin) for radiation protection purposes, have been also used to estimate/reconstruct organ doses of individuals for many studies on prospective/retrospective risk assessments [9]. This approach using the reference DCs should be practically reasonable considering that the detailed anatomy information such as CT and magnetic resonance images for each individual is unavailable in many exposure scenarios. Even if such detailed information was available, not only constructions of individual anatomy models but also MC dose calculations would require an enormous amount of time, effort, and computational resources, which also makes individual dose estimates practically challenging, particularly for large-scale cohort studies (e.g., >10,000 individuals).
Despite the aforementioned advantages, the individual dose estimates using the reference DCs can bias the estimated organ doses of the individuals because their anatomy (e.g., organ shape and position and body height and weight) is not the same as that of the reference phantoms used for the reference DCs [10]. Considering that the actual anatomy of the individuals is mostly unknown, it may be impossible to evaluate the exact bias due to the individual anatomy difference from the reference phantoms. Nevertheless, it is important to quantify and understand a rough degree of the dosimetry biases using the reference DCs [11], which can be beneficially reflected in the evaluation of possible uncertainties of study outcomes (e.g., dose-to-risk responses). In an attempt to address this issue, the present study investigated individual variations in organ doses for photon external exposures based on CT images acquired from 30 patients. Some major organs in the CT images were segmented and used to calculate organ DCs for idealized photon fields by conducting MC simulations. Individual-dependent organ DCs were systematically analyzed and compared with the ICRP-116 reference DCs.
Materials and Methods
1. Computed Tomography Images
We obtained the CT images for 30 radiotherapy patients, the data of which was anonymized and confirmed by the Memorial Sloan Kettering Cancer Center Institutional Review Board (IRB) with the IRB waiver for the data usage. The general information on the CT images used in the present work is described in Table 1. The patients can be divided into five groups, considering the different scan ranges: (1) abdomen-to-pelvis, (2) chest-to-abdomen, (3) head-to-neck, (4) neck-to-abdomen, and (5) neck-to-chest. Fig. 1 shows the view of a representative patient for each scan range group. The patients covered adult ages ranging from 31 to 89 years, with an average age of 67 years. The patients were composed of 17 males and 13 females. The mean height and weight among the male patients were 172 cm and 81 kg, respectively, while the adult male ICRP reference height and weight were 176 cm and 73 kg [6]. The mean height and weight among the female patients were 163 cm and 67 kg, respectively, while the adult female ICRP reference height and weight were 163 cm and 60 kg [6].
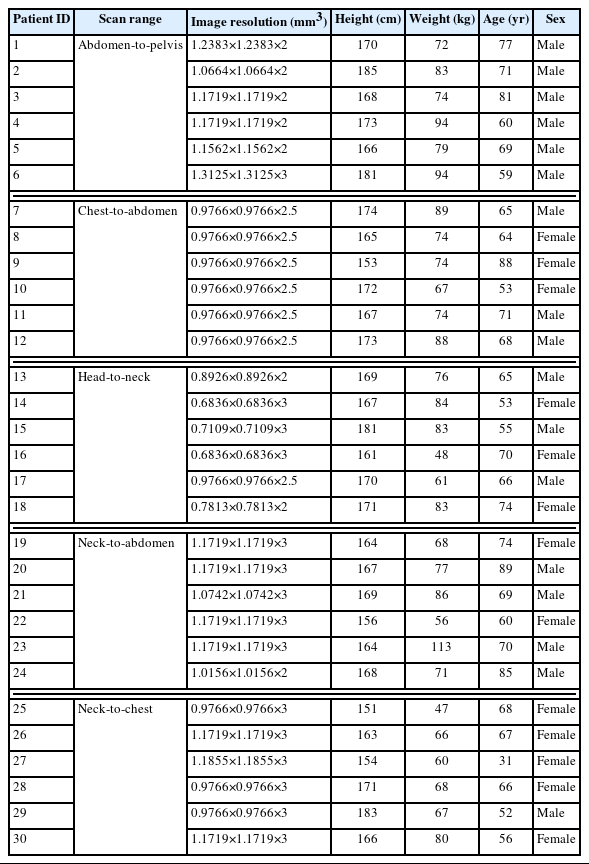
General Information of Computed Tomography Images for 30 Patients Used in This Study
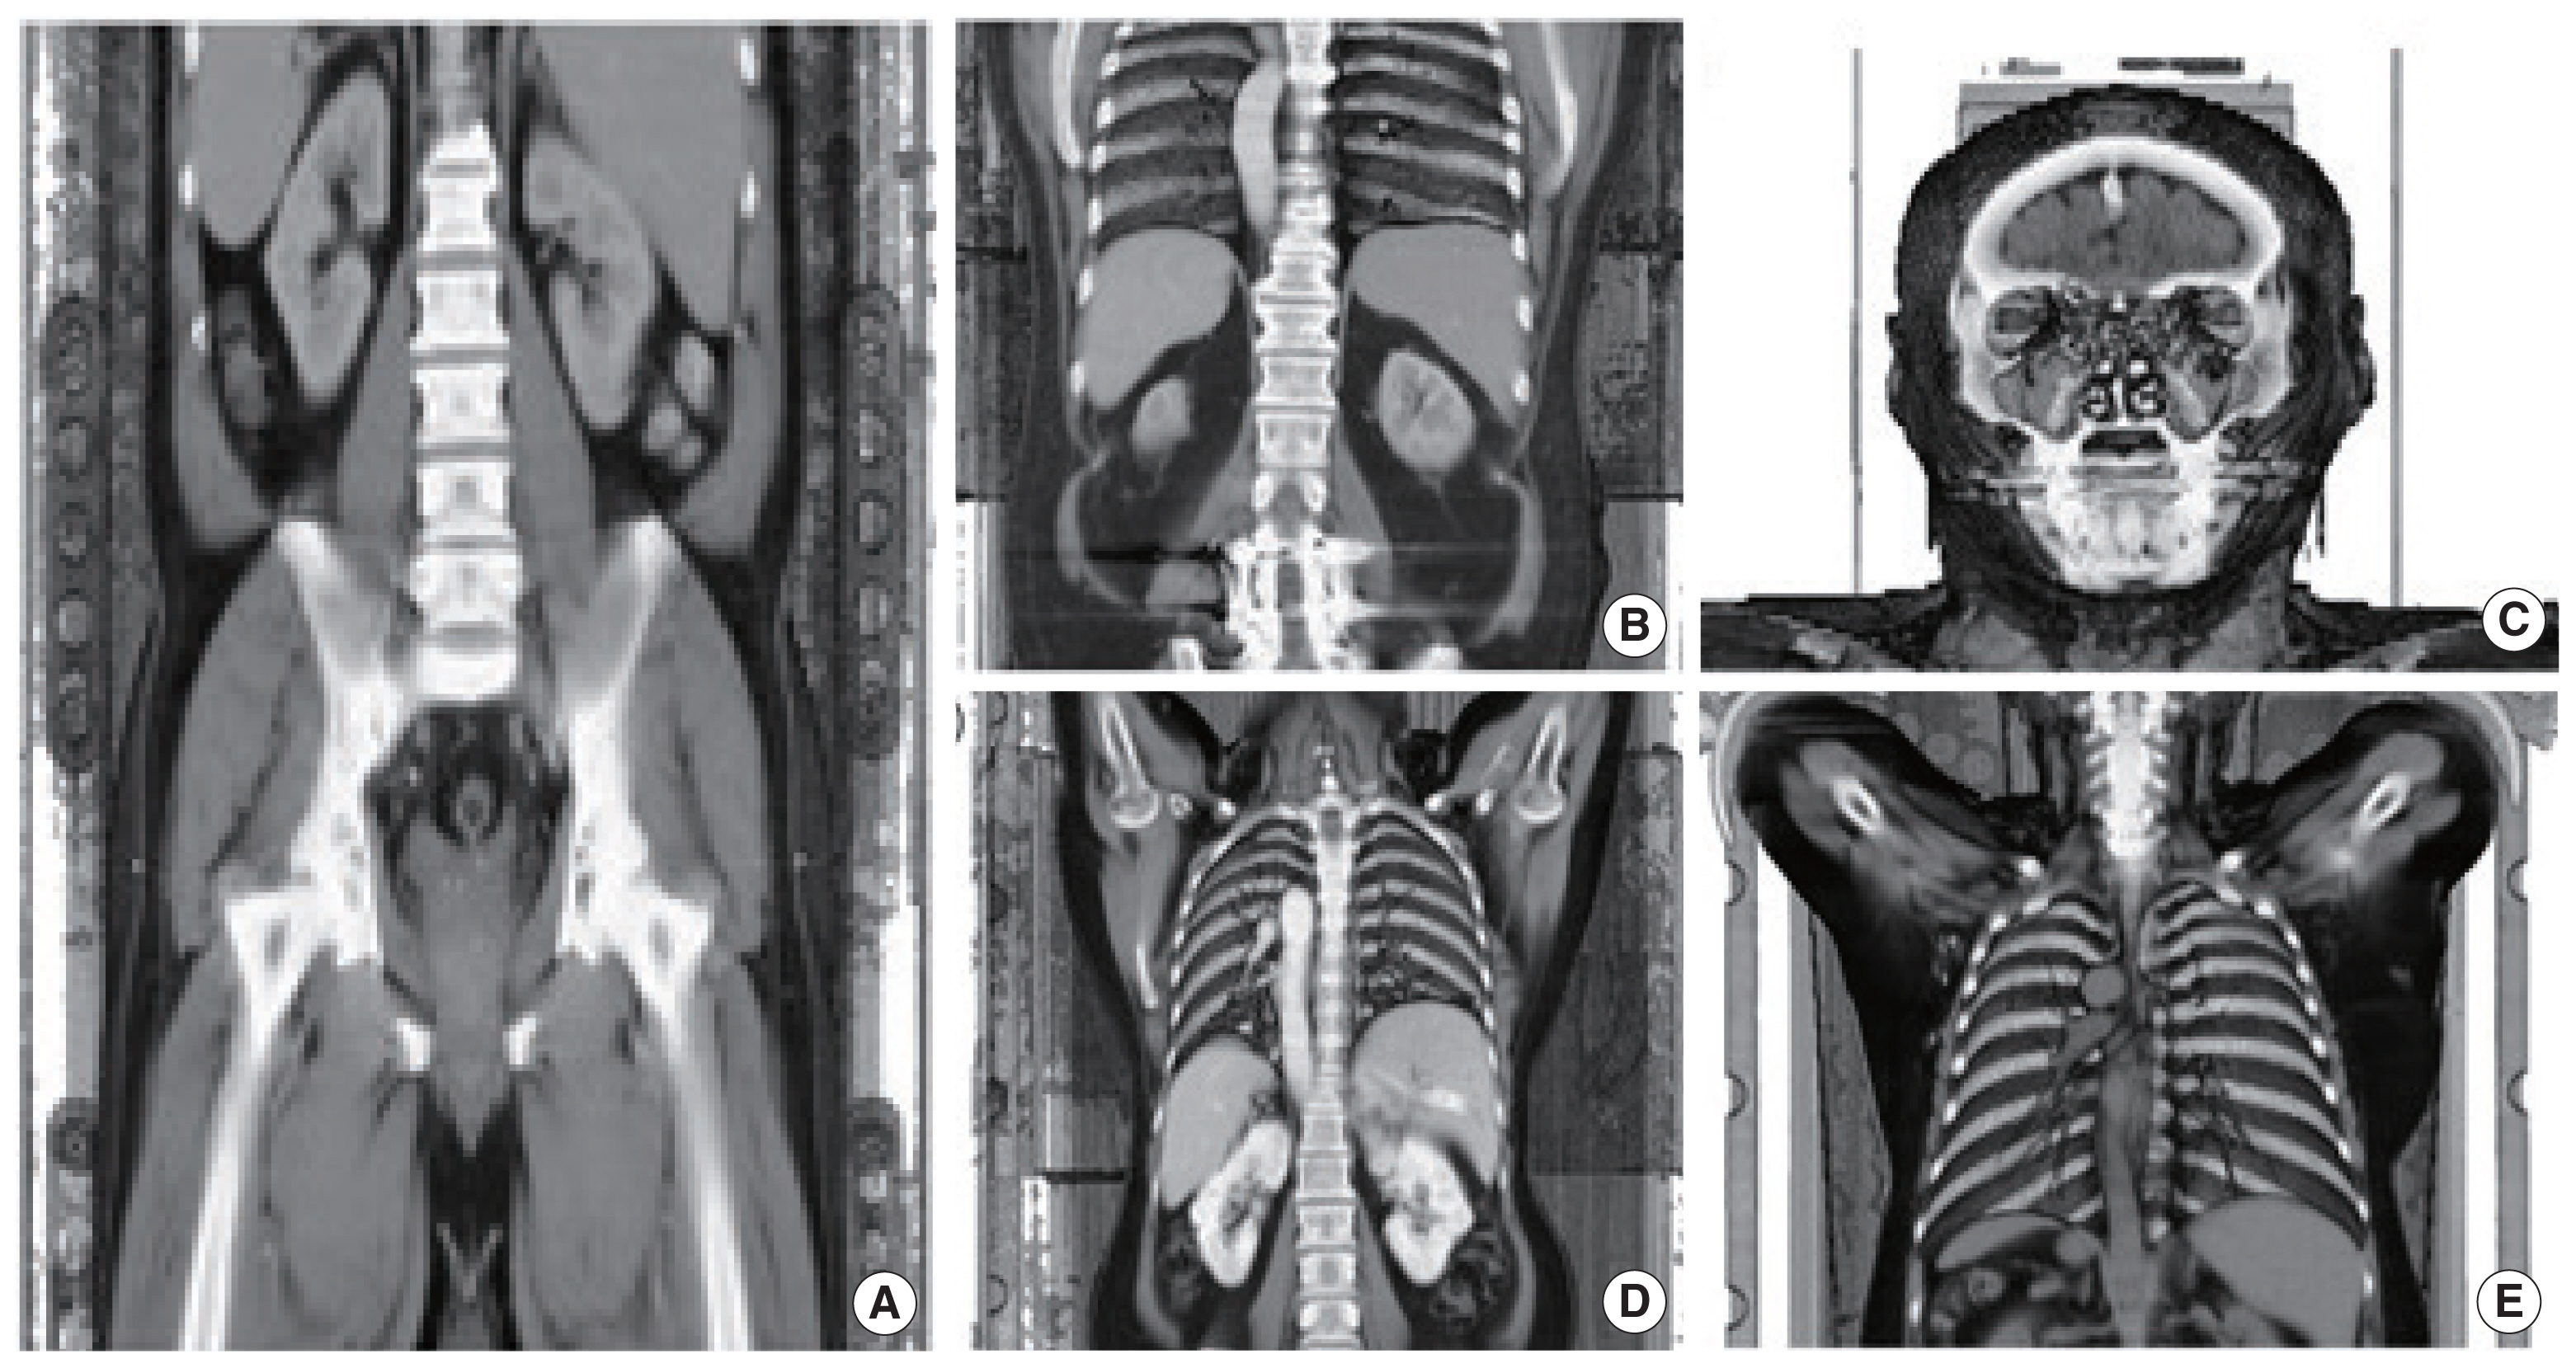
Three-dimensional volume rendered view of a representative patient for each scan range group: (A) patient 4 (abdomen-to-pelvis group), (B) patient 12 (chest-to-abdomen group), (C) patient 15 (head-to-neck group), (D) patient 22 (neck-to-abdomen group), and (E) patient 30 (neck-to-chest group).
2. Organ Segmentations
We manually segmented organs in the CT images for each patient mainly using a Java-based image processing and analysis program, ImageJ (https://imagej.nih.gov/ij/index.html). The ImageJ program developed at the National Institutes of Health is a public domain software designed with an open architecture that provides extensibility via Java plugins [12]. The ImageJ program provides not only an easy and straightforward graphic interface but also many powerful tools such as Wand for image segmentation. Fig. 2, for example, shows a CT image of patient 1, where a boundary of the liver was contoured in the ImageJ program. In this work, we segmented eight organs: brain, breasts, liver, lungs, skeleton, skin, stomach, and urinary bladder, which are considered radiosensitive by the current ICRP Recommendations [1]. Note that during the segmentation of the stomach and urinary bladder, their walls and contents were hardly separated at the given contrast of the megavoltage CT images and thus segmented as a single structure considered as a mixture of the walls and contents. The skin due to the thin-walled structure was also hardly distinguishable in the CT images. Therefore, the skin was defined as the outer voxel layer of the patients following the same approach used to define the skin of the ICRP-110 reference phantoms [3]. The segmentation work was frequently aided and confirmed by an anatomist.
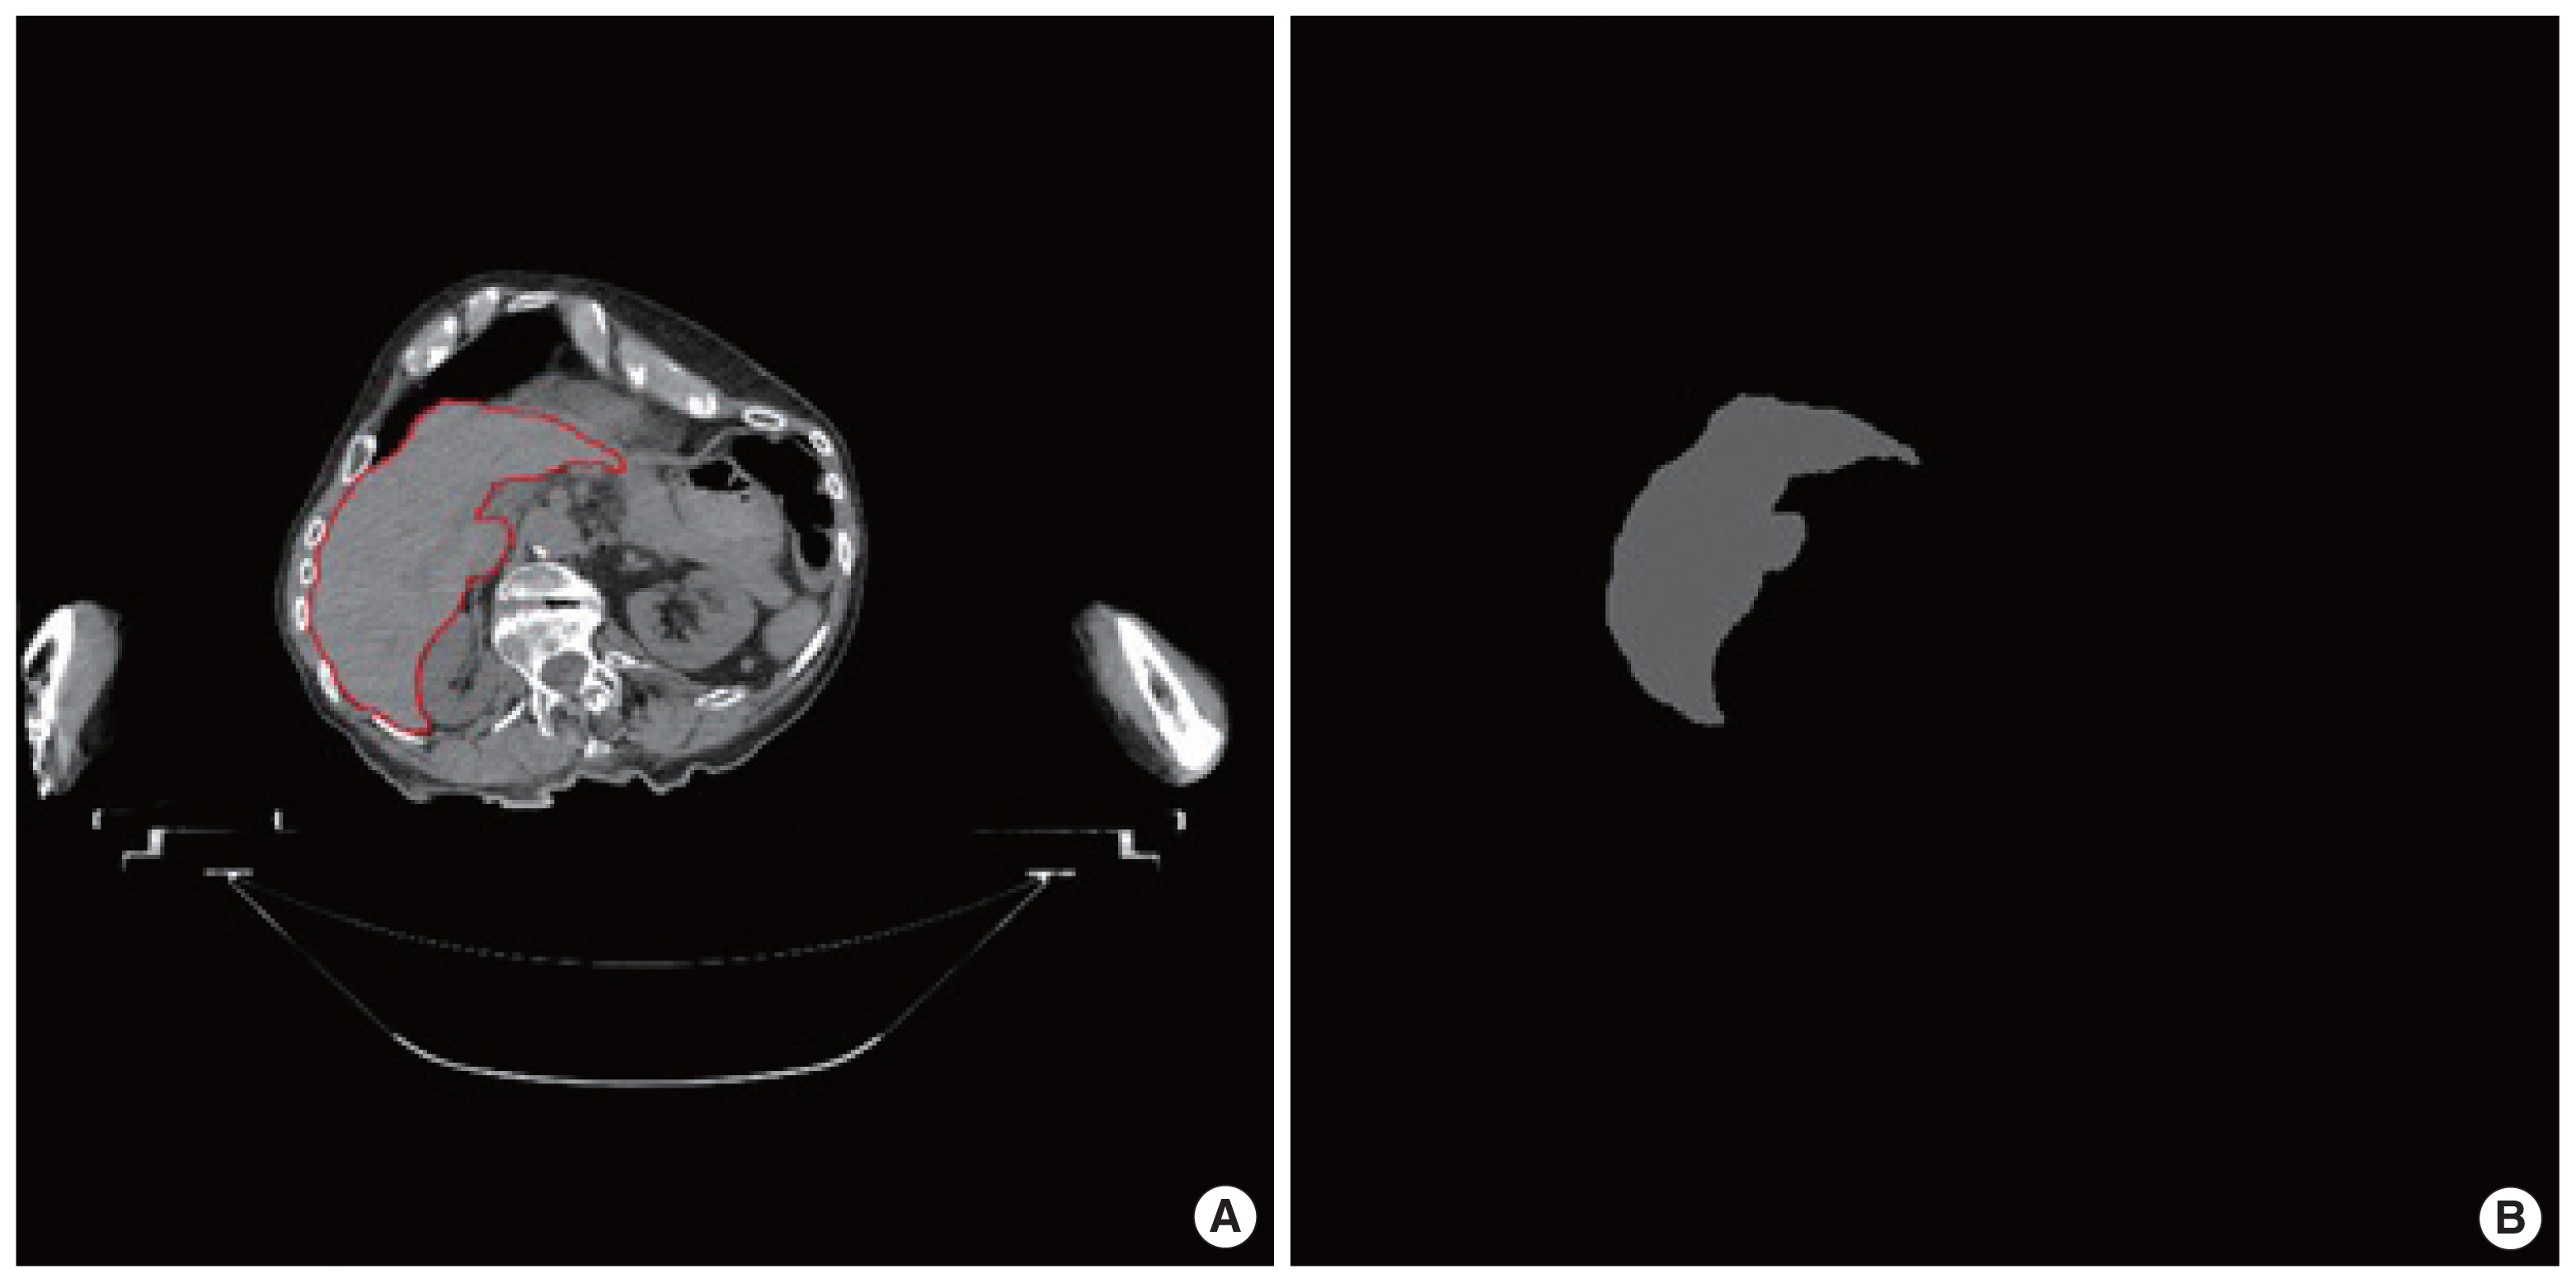
An example of contouring liver structure (A: delineated line; B: segmented area) on a computed tomography image of patient 1 using the ImageJ program (National Institutes of Health).
3. Monte Carlo Simulations
MC simulations combined with the segmented organs in the patient CT images were performed to calculate individual-specific organ DCs for photon external exposures. For the MC simulations, we employed a general-purpose MC radiation transport code, the Monte Carlo N-Particle version 6.2 (MCNP 6.2) code, which has been extensively validated and widely used for radiation dosimetry studies [13–16]. The data format of the segmented images was converted into the MCNP input-file format that can implement voxel geometry via LATTICE (LAT=1) and UNIVERSE cards. The density and elemental composition of each organ were unknown from the patient data and assumed to be the same as the reference values given in ICRP Publication 89 [6]. There was a remaining region in the body, excluding all segmented organs, which can be considered as a mixture of all unsegmented organs and tissues. The density and elemental composition of the remaining region were assumed to be the same as those of the adult average soft tissues of the International Commission on Radiation Units and Measurements [17]. The four irradiation geometries (antero-posterior [AP], postero-anterior [PA], left-lateral [LLAT], right-lateral [RLAT]) as described in the ICRP-116 [2] and also shown in Fig. 3 were simulated by irradiating monoenergetic broad parallel photon beams (0.01–10 MeV) to the whole body of the patients using the SDEF card, where the parameters were identically used with those of a previous study [18]. Absorbed doses to the organs were calculated by using the F6 tally, the energy deposition tally based on track-length estimation. The number of primary photons for each calculation increased from 107 to 109 as the energy decreased so that the relative errors of the calculated organs were kept below 5%.

Irradiation geometries were considered in the present study. AP, antero-posterior; PA, postero-anterior; LLAT, left-lateral; RLAT, right-lateral.
Results and Discussion
1. Segmented Organs of 30 Patients
Table 2 shows a list of the organs that were segmented or could not be segmented for each patient. The skin and skeleton could be segmented for all the 30 patients included in this study. The liver, lungs, and stomach could be segmented for approximately two-thirds of the patients. The breasts could be segmented for six patients at two scan ranges of neck-to-abdomen and neck-to-chest. The brain and urinary bladder could be segmented again for six patients but only at a single scan range of head-to-neck and abdomen-to-pelvis, respectively. Fig. 4 shows a front view of the segmented organs for the representative patient for each scan range group.

List of Organs that Were Segmented (O) or Could Not Be Segmented (X) for Each Patient

Three-dimensional view of a representative patient for each group: (A) patient 4 (abdomen-to-pelvis group), (B) patient 12 (chest-to-abdomen group), (C) patient 15 (head-to-neck group), (D) patient 22 (neck-to-abdomen group), and (E) patient 30 (neck-to-chest group).
Table 3 shows the minimum, maximum, and mean values of the organ volumes segmented in this work along with the organ volumes of the ICRP-110 reference phantoms [3]. For the brain, the mean volume of the patients (1,300 cm3) was in an excellent agreement with the male-and-female averaged volume of the ICRP-110 reference phantoms (1,310 cm3). Compared with the brain, for the liver, lungs, stomach, and urinary bladder, there were relatively large deviations from the male-and-female averaged volume of the ICRP-110 reference phantoms, but the deviations were less than 30% (liver 17%, lungs 18%, stomach 26%, and urinary bladder 9%). For the breasts, there was a significantly large deviation; the mean volume of the patients was about four times greater than the male-and-female volume of the ICRP-110 phantoms. Although the female patients available for the breast segmentation were dominant [5, 6], the patient mean volume was still about two times greater than that of the female ICRP-110 phantom. It should be noted that many studies have observed that the individual variation in breast volumes of adult females was significantly large [19].
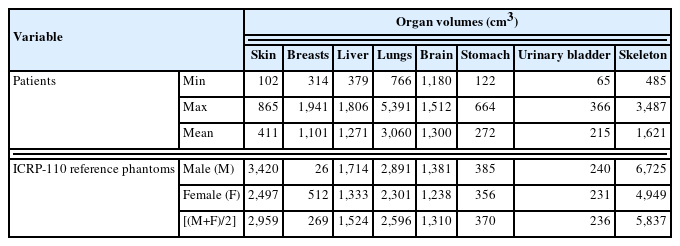
Minimum, Maximum, and Mean Values of the Organ Volumes (cm3) Segmented on Computed Tomography Images for 30 Patients along with the Organ Volumes of the ICRP-110 Reference Phantoms
For the skin and skeleton, there were also significantly large deviations; the mean volume of the patients was lower than the male-and-female averaged volume of the ICRP-110 phantoms by a factor of 7.2 (skin) and 3.6 (skeleton), respectively. The lower skeletal volumes of the patients can be easily understood by the fact that the CT images of the patients considered in the present study are partial-body images, whereas the ICRP-110 reference phantoms were constructed based on the whole-body CT images. The lower skin volumes of the patients can be explained not only by the partial-body CT images of the patients but also by the lower voxel resolutions of the patient CT images against those of the ICRP-110 phantoms. Note that as mentioned already in Materials and Methods section (2. Organ Segmentations), the skin for the patients, similar to the skin of the ICRP-110 phantoms, was segmented as the single voxel outer layer. The x-and-y voxel resolutions of the patient CT images ranged from 0.6836 to 1.3125 mm, which are 1.4 to 3.12 times smaller than those of the ICRP-110 phantoms (male 2.137 and female 1.775).
2. Individual Variation in Organ Doses
Figs. 5–12 show the energy-specific maximum, minimum, and mean values of the organ DCs (absorbed dose per fluence, pGy cm2) among the patients, along with the male-and-female averaged values of the ICRP-116 DCs at the four irradiation geometries (AP, PA, RLAT, and LLAT) for the eight organs (i.e., brain, breasts, lungs, liver, red bone marrow, skin, stomach, and urinary bladder), respectively.

Distributions of brain dose coefficients (DCs) among the patients as maximum, mean, and minimum values for each energy at four irradiation geometries (A: antero-posterior [AP]; B: postero-anterior [PA]; C: right-lateral [RLAT]; D: left-lateral [LLAT]) along with the gender-averaged values of the brain DCs in the International Commission on Radiological Protection (ICRP) Publication 116 (ICRP, 2010) [2] produced using the ICRP Publication 110 reference phantoms (ICRP, 2009) [3].
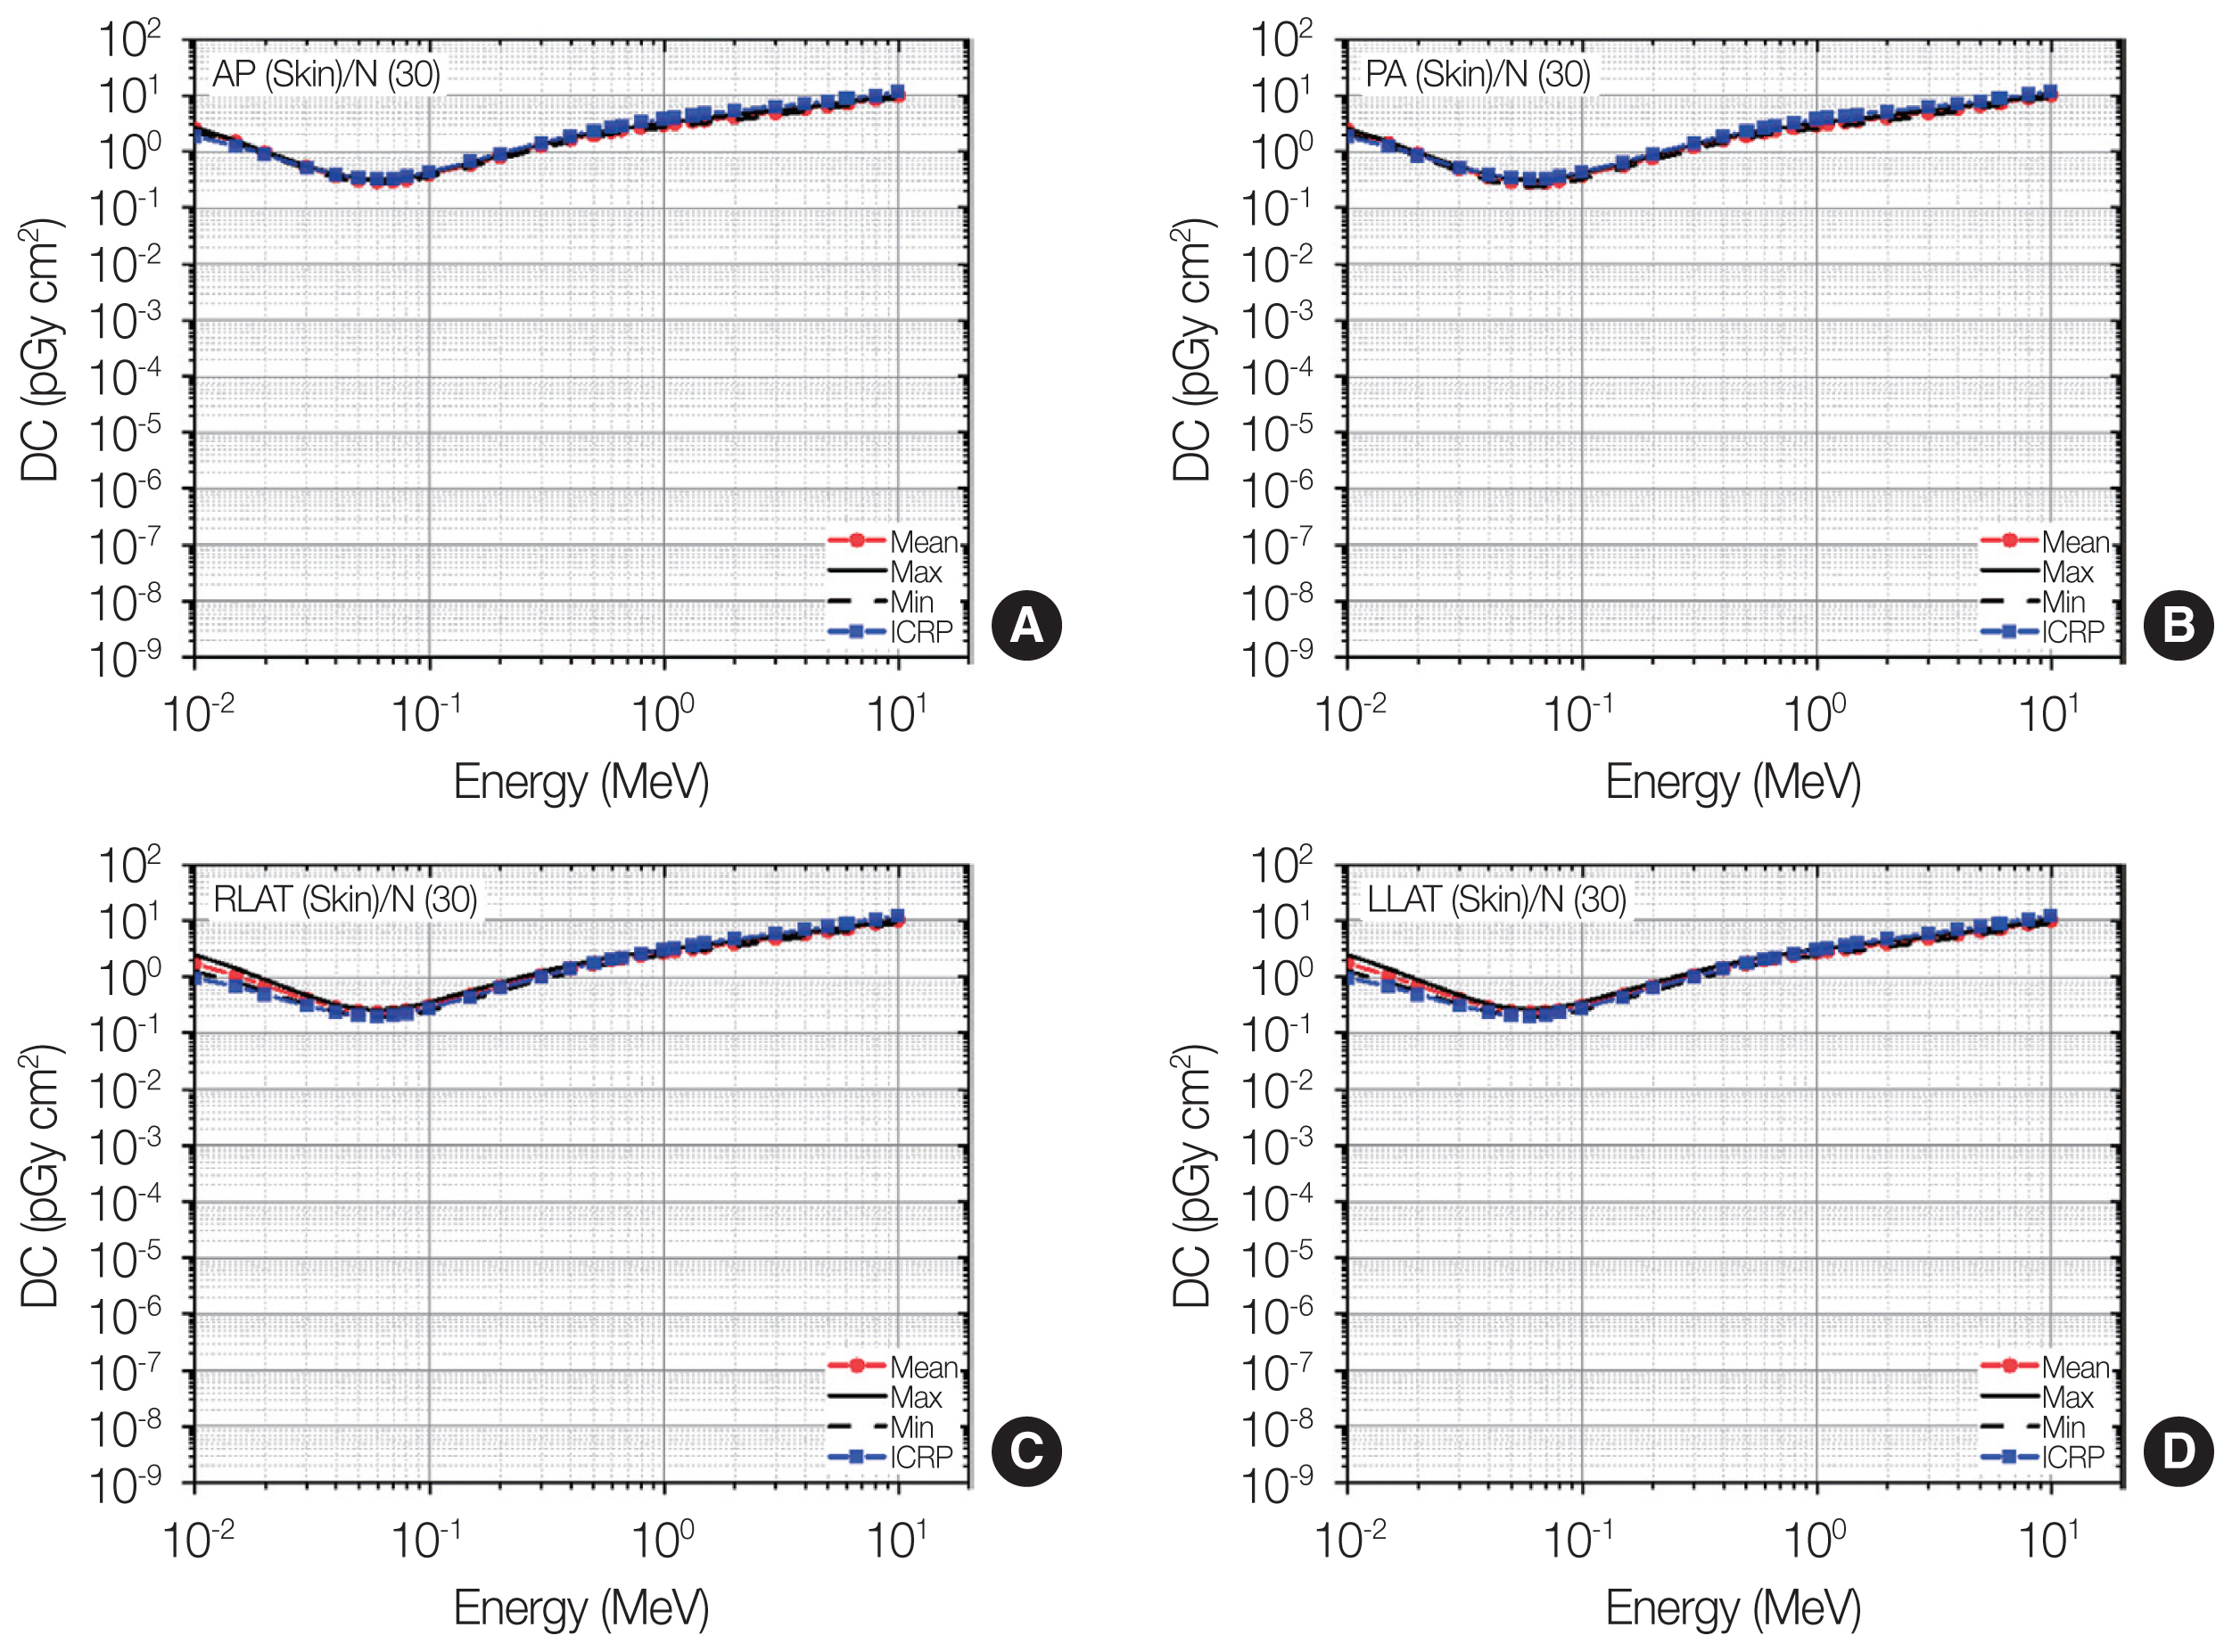
Distributions of skin dose coefficients (DCs) among the patients as maximum, mean, and minimum values for each energy at four irradiation geometries (A: antero-posterior [AP]; B: postero-anterior [PA]; C: right-lateral [RLAT]; D: left-lateral [LLAT]) along with the gender-averaged values of the skin DCs in the International Commission on Radiological Protection (ICRP) Publication 116 (ICRP, 2010) [2] produced using the ICRP Publication 110 reference phantoms (ICRP, 2009) [3].

Distributions of breast dose coefficients (DCs) among the patients as maximum, mean, and minimum values for each energy at four irradiation geometries (A: antero-posterior [AP]; B: postero-anterior [PA]; C: right-lateral [RLAT]; D: left-lateral [LLAT]) along with the gender-averaged values of the breast DCs in the International Commission on Radiological Protection (ICRP) Publication 116 (ICRP, 2010) [2] produced using the ICRP Publication 110 reference phantoms (ICRP, 2009) [3].
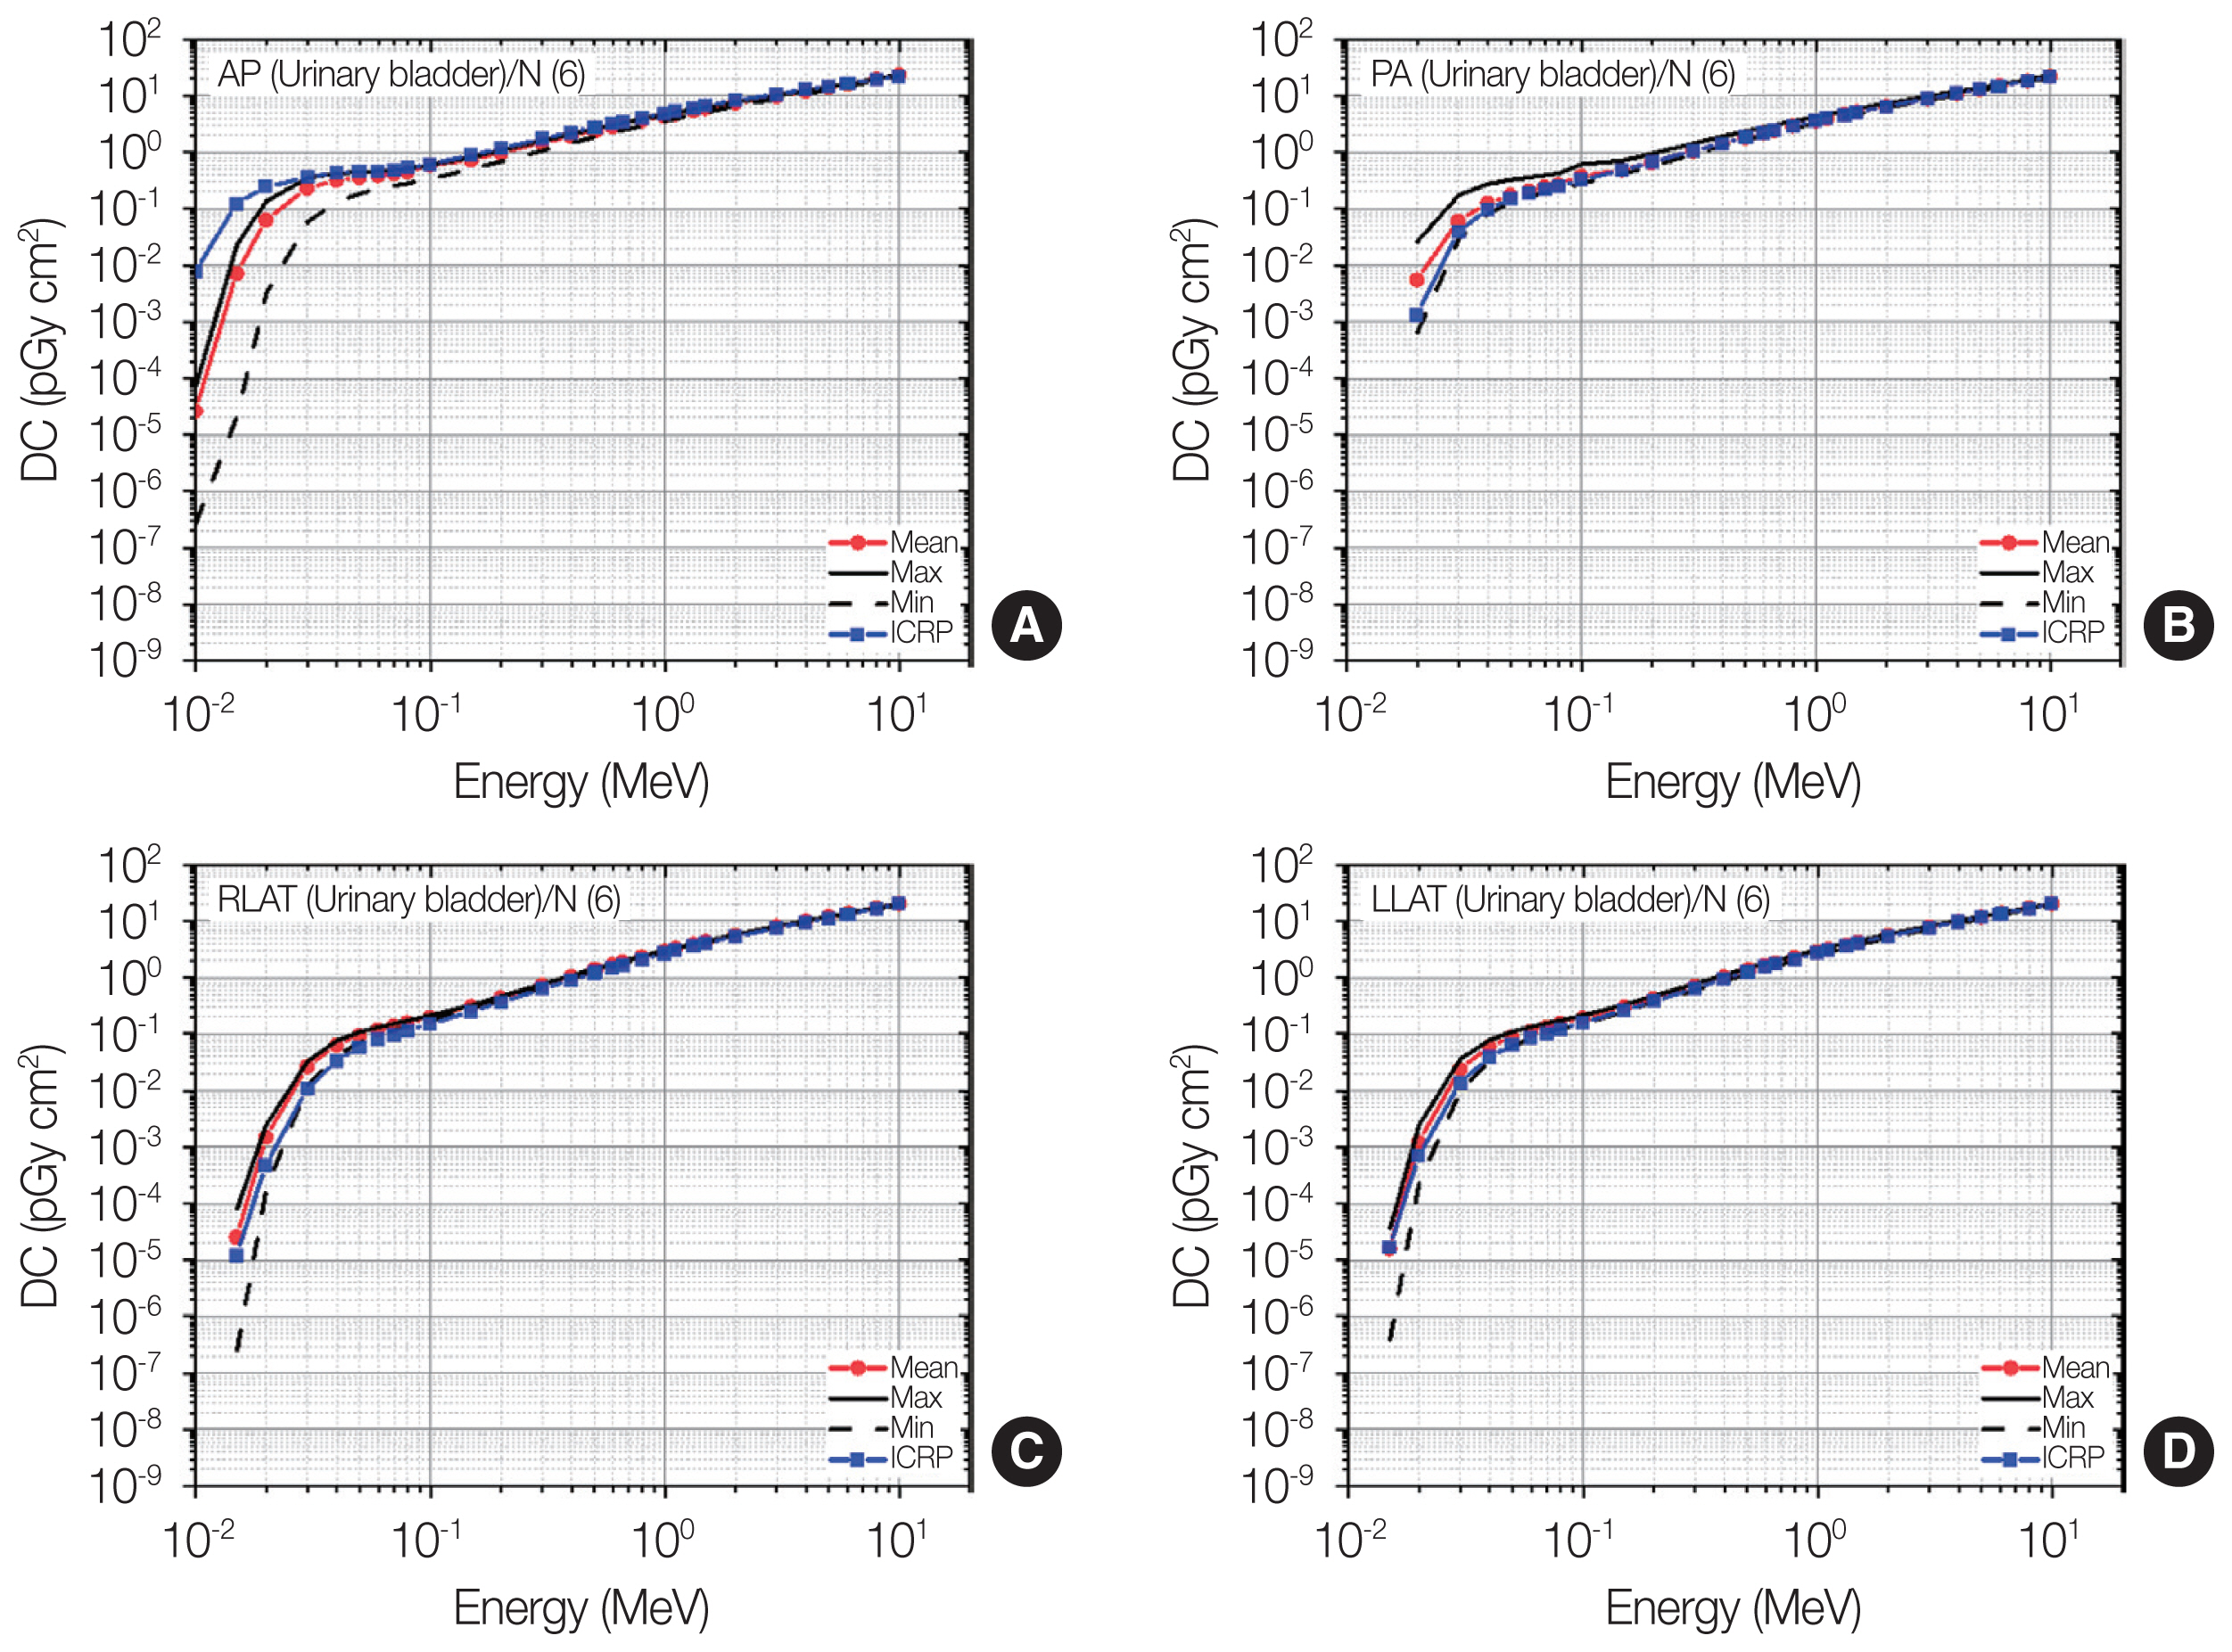
Distributions of urinary bladder dose coefficients (DCs) among the patients as maximum, mean, and minimum values for each energy at four irradiation geometries (A: antero-posterior [AP]; B: postero-anterior [PA]; C: right-lateral [RLAT]; D: left-lateral [LLAT]) along with the gender-averaged values of the urinary bladder DCs in the International Commission on Radiological Protection (ICRP) Publication 116 (ICRP, 2010) [2] produced using the ICRP Publication 110 reference phantoms (ICRP, 2009) [3].
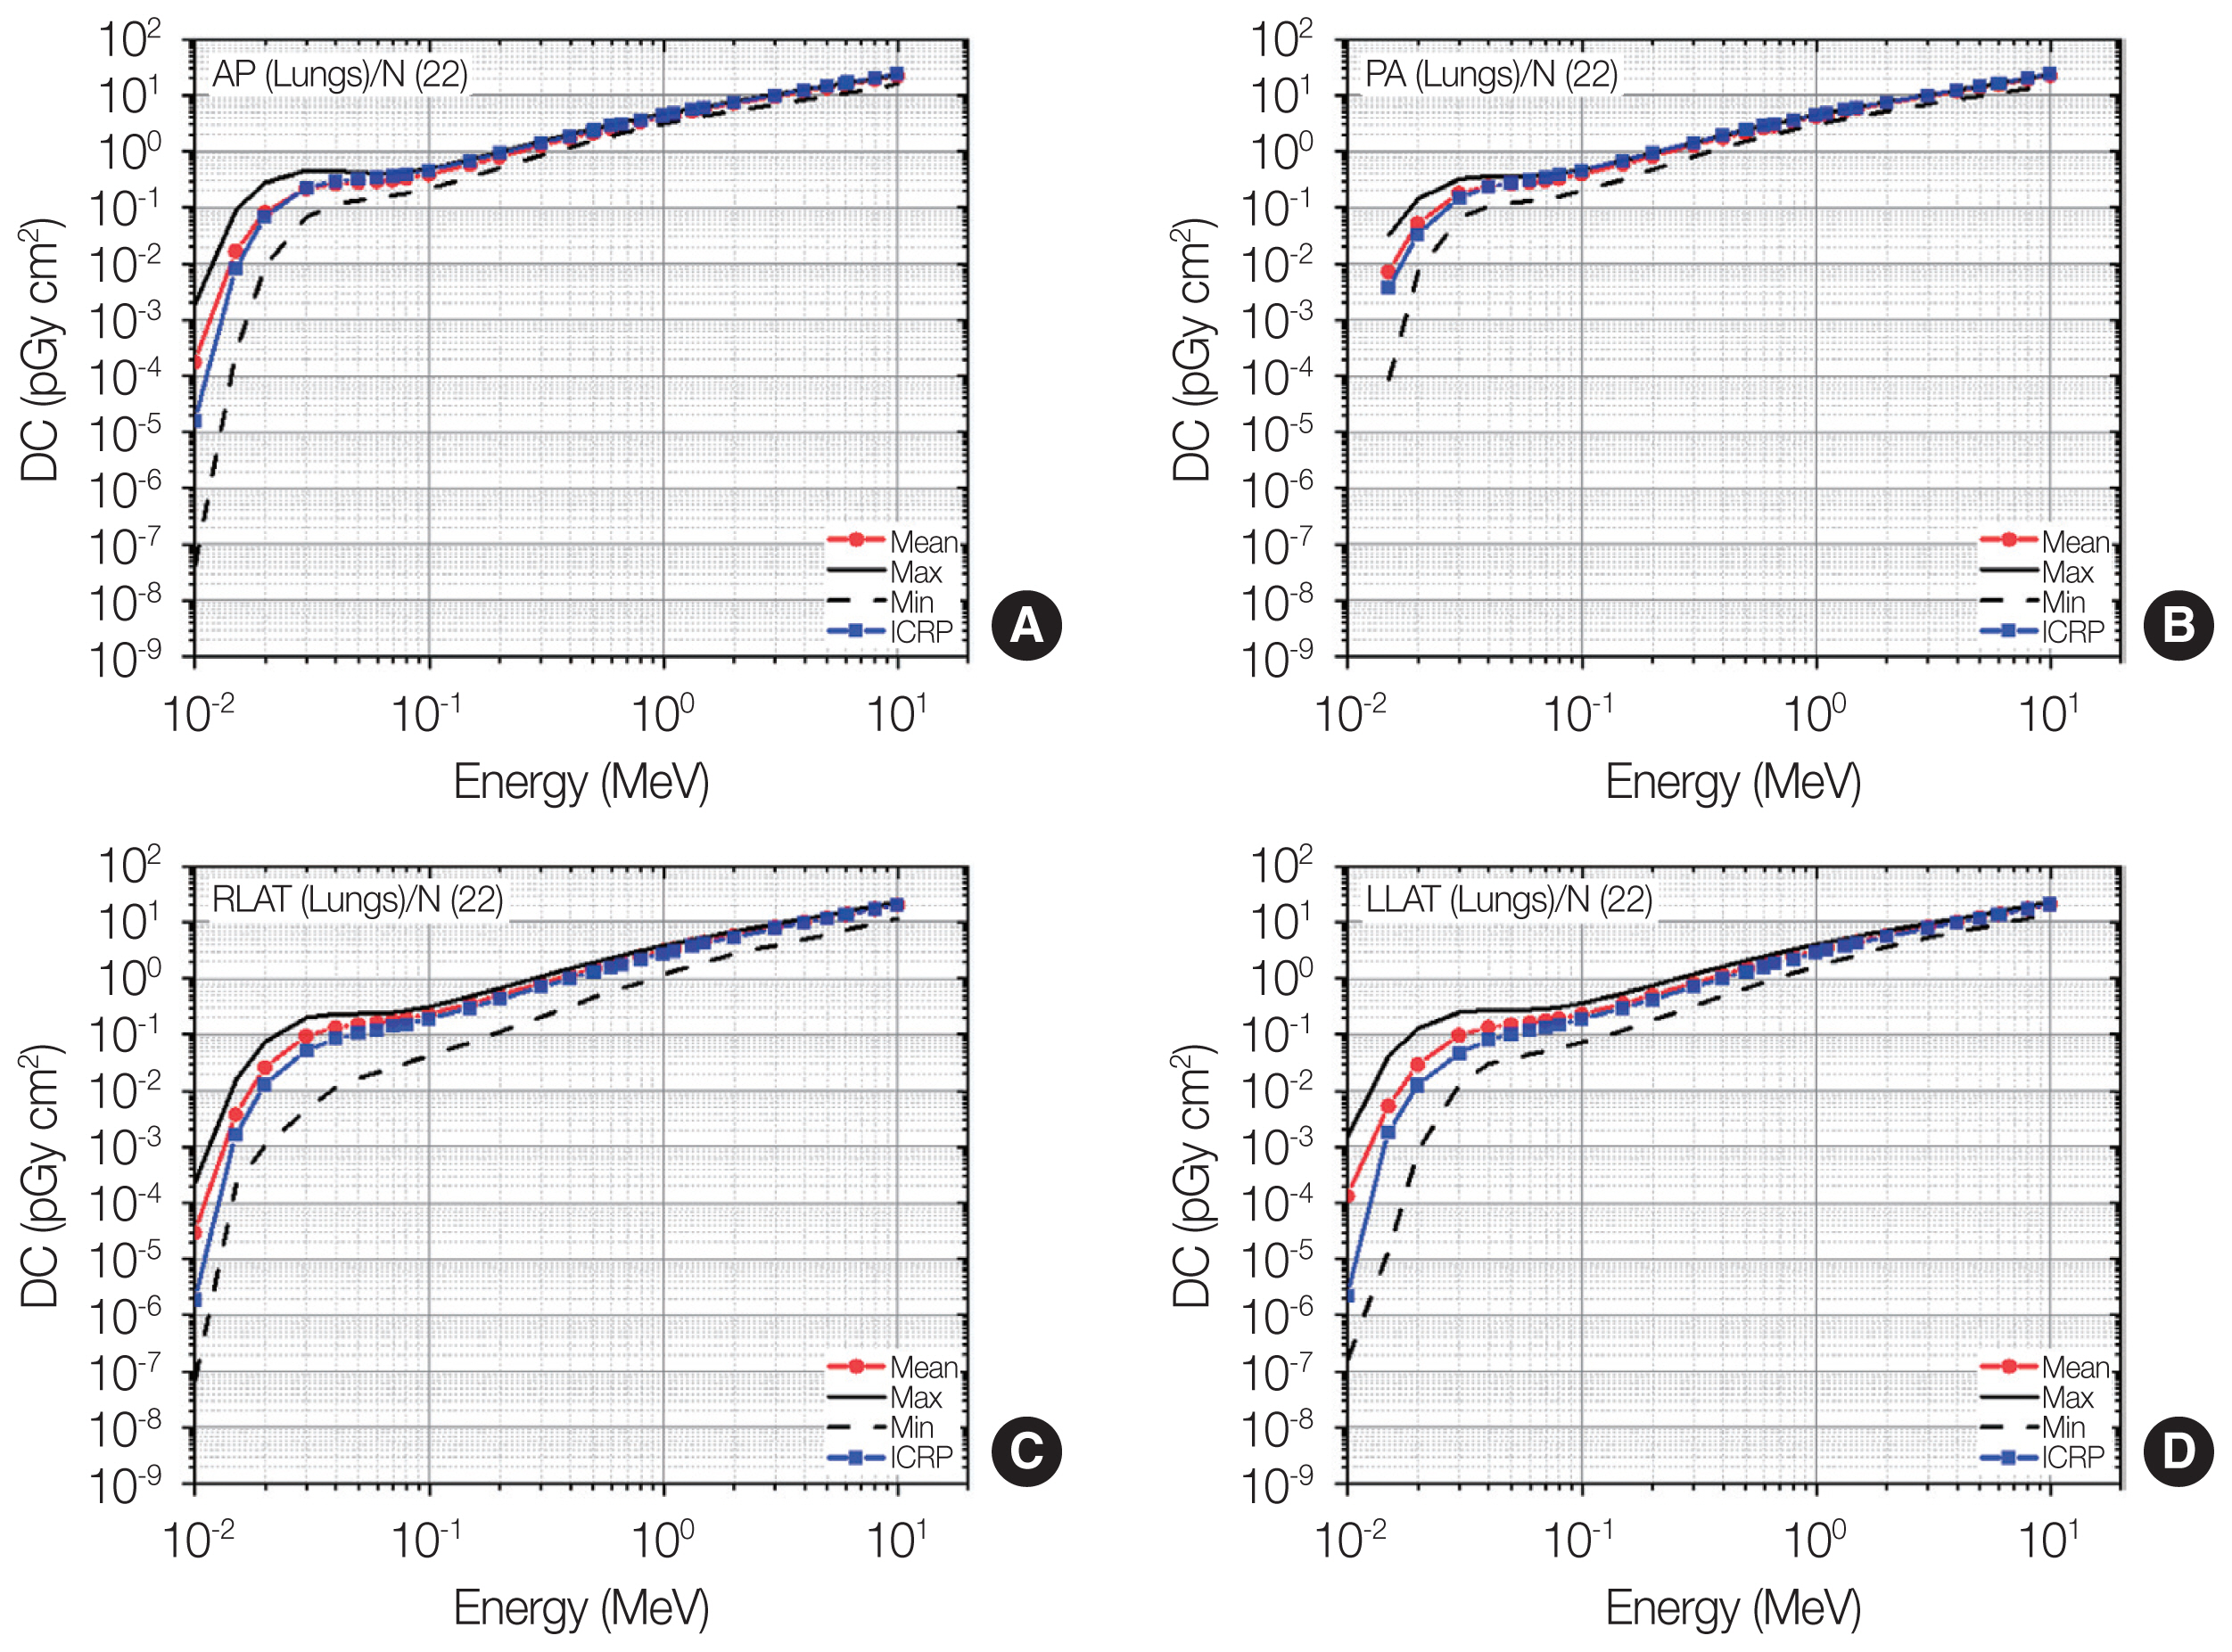
Distributions of lung dose coefficients (DCs) among the patients as maximum, mean, and minimum values for each energy at four irradiation geometries (A: antero-posterior [AP]; B: postero-anterior [PA]; C: right-lateral [RLAT]; D: left-lateral [LLAT]) along with the gender-averaged values of the lung DCs in the International Commission on Radiological Protection (ICRP) Publication 116 (ICRP, 2010) [2] produced using the ICRP Publication 110 reference phantoms (ICRP, 2009) [3].
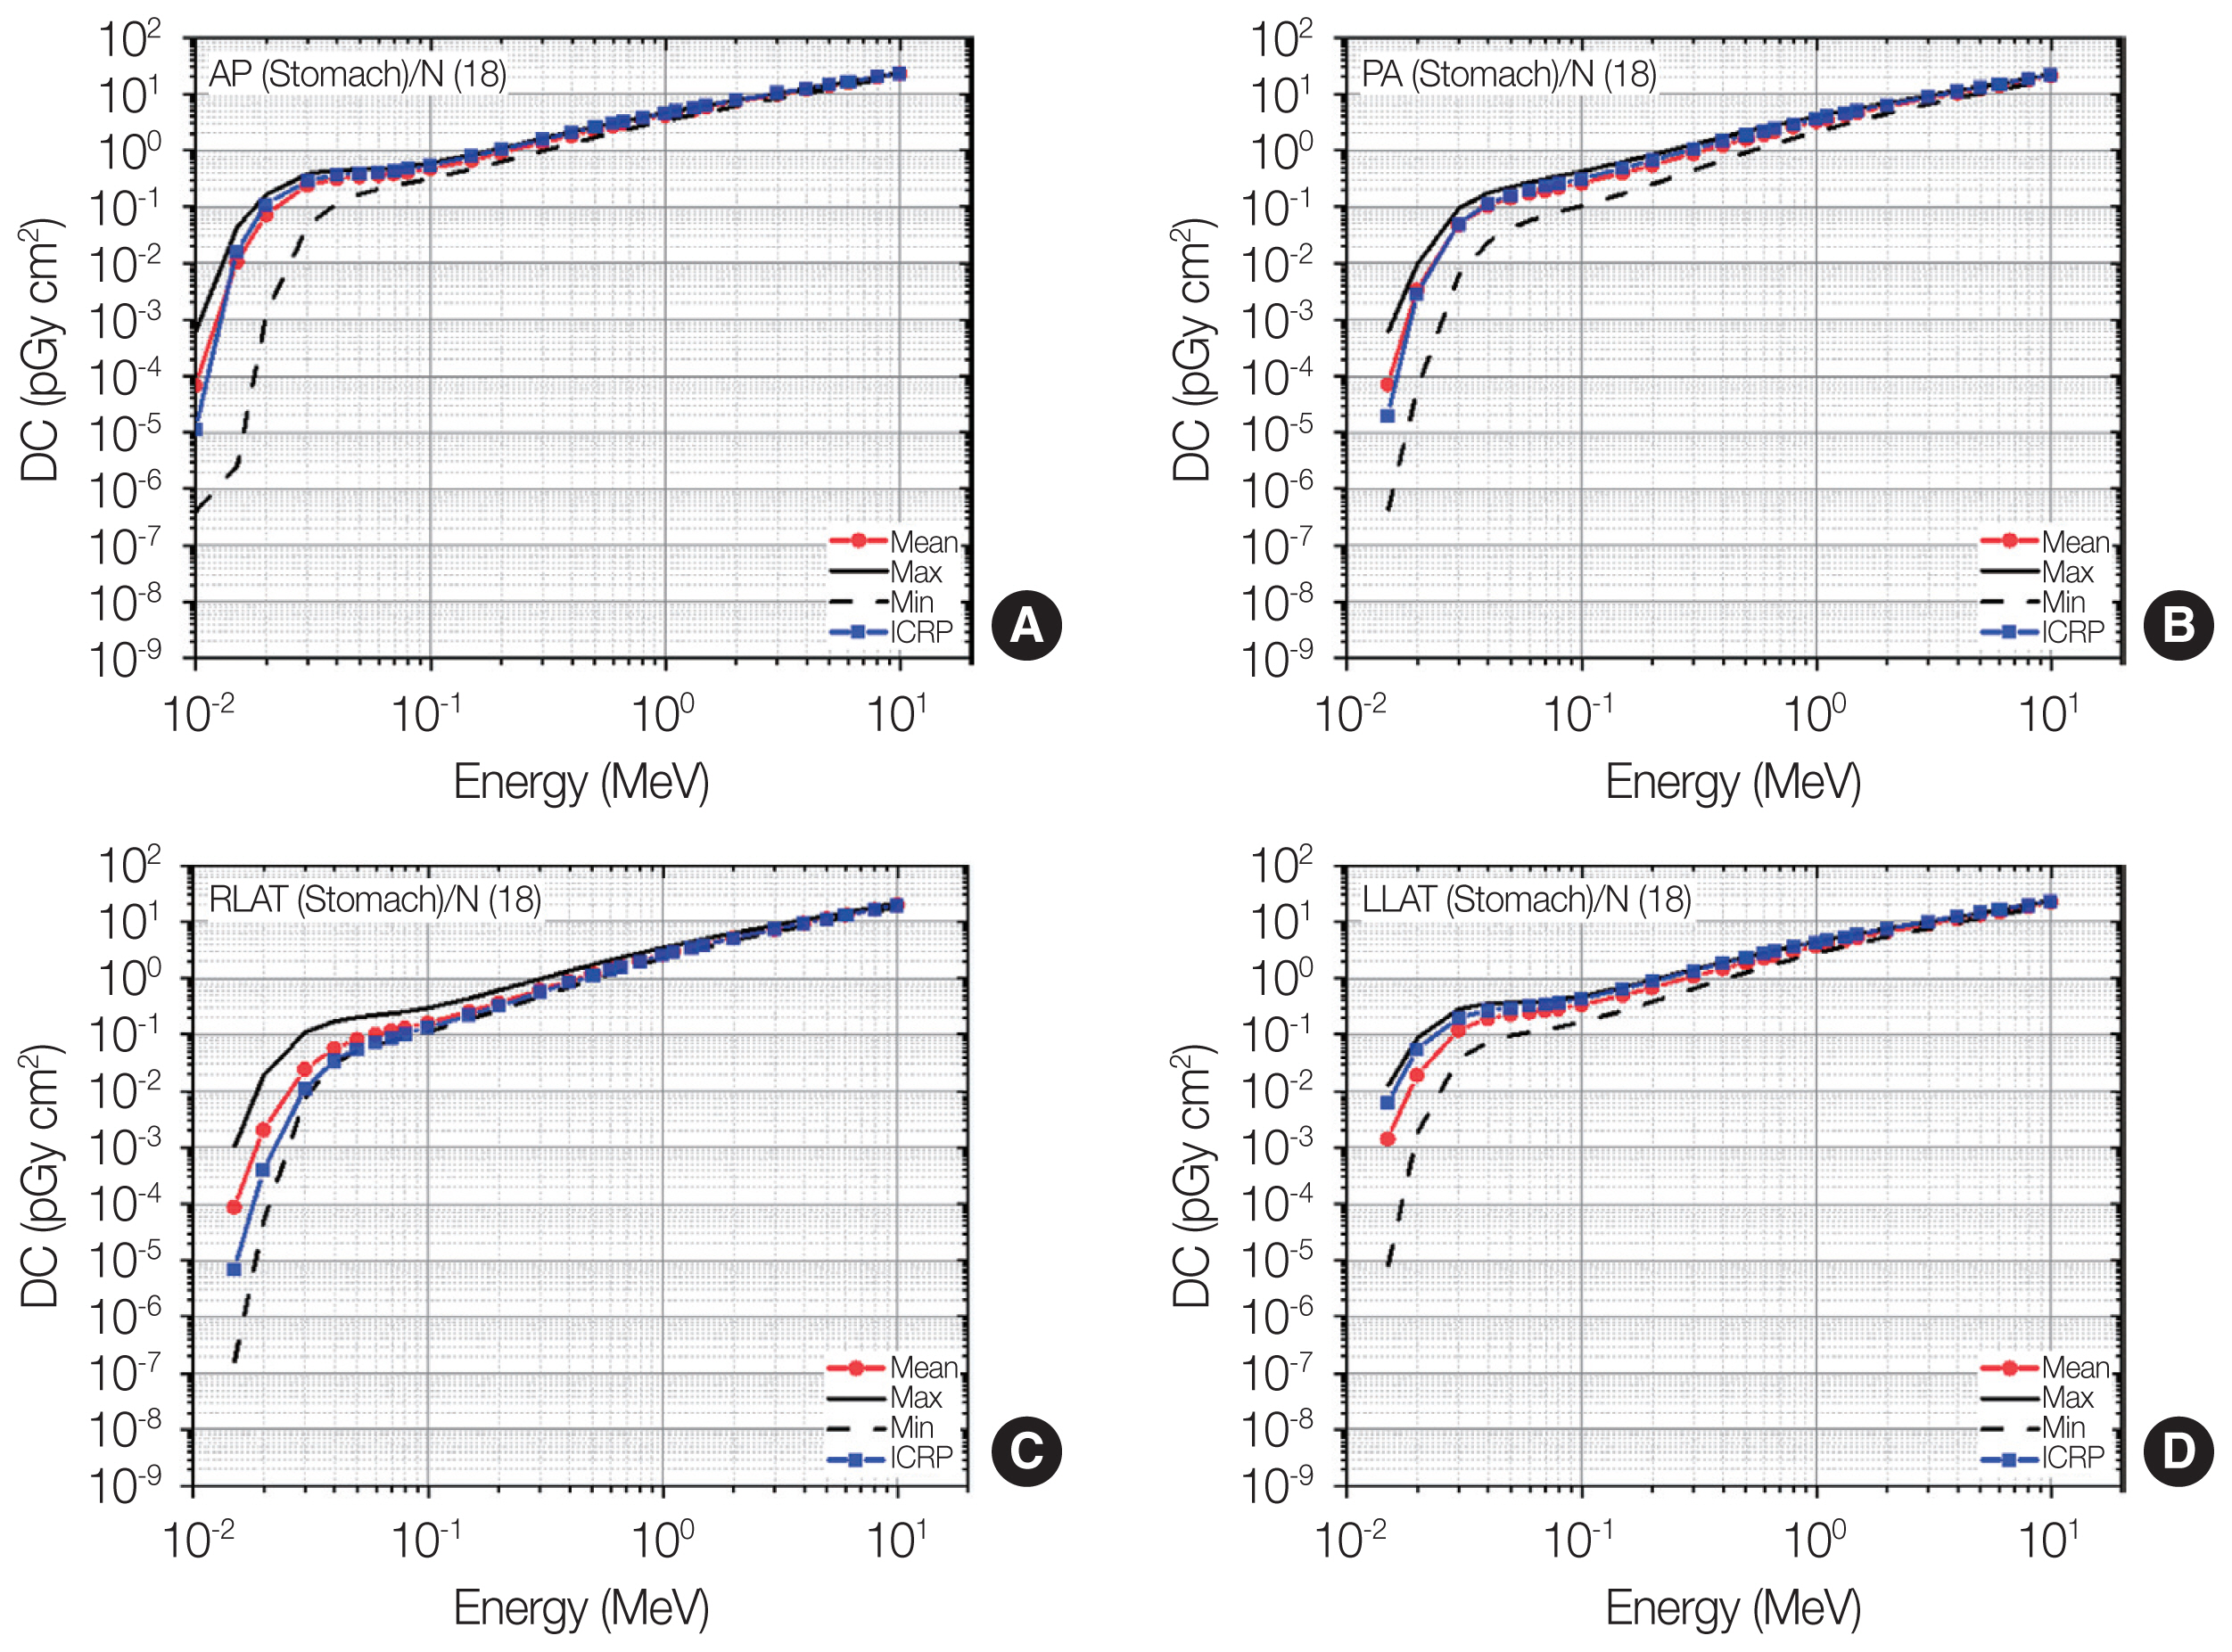
Distributions of stomach dose coefficients (DCs) among the patients as maximum, mean, and minimum values for each energy at four irradiation geometries (A: antero-posterior [AP]; B: postero-anterior [PA]; C: right-lateral [RLAT]; D: left-lateral [LLAT]) along with the gender-averaged values of the stomach DCs in the International Commission on Radiological Protection (ICRP) Publication 116 (ICRP, 2010) [2] produced using the ICRP Publication 110 reference phantoms (ICRP, 2009) [3].

Distributions of liver dose coefficients (DCs) among the patients as maximum, mean, and minimum values for each energy at four irradiation geometries (A: antero-posterior [AP]; B: postero-anterior [PA]; C: right-lateral [RLAT]; D: left-lateral [LLAT]) along with the gender-averaged values of the liver DCs in the International Commission on Radiological Protection (ICRP) Publication 116 (ICRP, 2010) [2] produced using the ICRP Publication 110 reference phantoms (ICRP, 2009) [3].

Distributions of red bone marrow dose coefficients (DCs) among the patients as maximum, mean, and minimum values for each energy at four irradiation geometries (A: antero-posterior [AP]; B: postero-anterior [PA]; C: right-lateral [RLAT]; D: left-lateral [LLAT]) along with the gender-averaged values of the red bone marrow DCs in the International Commission on Radiological Protection (ICRP) Publication 116 (ICRP, 2010) [2] produced using the ICRP Publication 110 reference phantoms (ICRP, 2009) [3].
1) Brain
Fig. 5 shows the result for the brain doses. At energies ≥0.1 MeV, the maximum-and-minimum values among the patients were not much different at all the irradiation geometries. The differences between the maximum-and-minimum values were all less than 20%. This means that the individual variation in the brain doses was negligibly small. At lower energies (i.e., <0.1 MeV), on the other hand, the maximum-and-minimum values among the patients were significantly different, and the difference tended to increase as the energy decreased. At 0.015 MeV, for example, the maximum value was much greater than the minimum value by a factor of 75 (AP), 51 (PA), 24 (RLAT), and 20 (LLAT). This also implies that the individual variation of the brain doses in the anterior/posterior irradiation would be more significant than in the lateral irradiation.
The ICRP-116 values show an excellent agreement with the mean values among the patients at AP and PA over the entire energy region. The differences were all less than 17%. This suggests that the brain doses produced using the ICRP reference phantoms could serve as good representative values for external exposures to photon beams in AP/PA directions. At RLAT and LLAT, both ICRP-116 values and the mean values of the patients were generally in an excellent agreement; the differences were mostly less than 12%. Only for very low energies (<0.02 MeV), notable differences greater than 12% can be found, with the maximum difference of 47 times at 0.01 MeV and RLAT. In addition, the ICRP-116 values tended to be lower than the mean values of the patients.
2) Skin
Fig. 6 shows the result for the skin doses. At AP and PA, the maximum-and-minimum values among the patients were very similar over the entire energy region; the differences were all less than 22%. This observation can be interpreted as indicating that the individual variation of the skin doses would be negligibly small. At LLAT and RLAT, it can also be seen that the individual variation of the skin doses is small for most energies. Only for the low energy region (<0.04 MeV), relatively large variation can be observed; the differences between the maximum-and-minimum values among the patients were greater than 30% and tended to increase as the energy decreased by up to 1.9 times (at 0.01 MeV).
The ICRP-116 values at AP and PA show excellent agreement with the mean values among the patients over the entire energy region; the differences were all less than 34%. In addition, excellent agreement between the ICRP-116 values and the mean values among the patients can also be observed at RLAT and LLAT, only except for very low energies (i.e., <0.07 MeV). This shows the notion that the skin doses calculated using the ICRP reference phantoms could serve as good representative values for photon external exposures in general. At the low energies <0.07 MeV, the ICRP-116 values tended to be smaller by up to 78% than the mean values among the patients. These ICRP-116 values were interestingly in a highly good agreement with the minimum values among the patients.
3) Breasts
Fig. 7 shows the result for the breast doses. At AP, the difference between the maximum-and-minimum values was small and below 10% for most of the energies, indicating that the individual dose variation was negligibly small. Only for the energies below 0.03 MeV or above 5 MeV, relatively large variations can be observed, but the maximum-and-minimum differences were all less than 62%. The results at RLAT and LLAT also show that the individual dose variation was negligibly small over the entire energy region, except for the energies below 0.03 MeV, where the maximum-and-minimum differences were greater than 20% and tended to increase as the energy decreased up to 4%. At PA, it can be again seen that the individual dose variation for the energies above 0.1 MeV was negligibly small. In contrast, for the lower energy region, on the other hand, the significant dose variation among the patients can be observed and tended to become larger at the lower energy; the maximum-and-minimum difference goes up to by a factor of 567 at 0.015 MeV.
The ICRP-116 values at RLAT and LLAT show excellent agreement with the mean values among the patients over the entire energy region (differences <26%), supporting that the breast doses calculated from the ICRP reference phantoms may be valid as the population-averaged values were considered. The ICRP-116 values at AP also show excellent agreement with the mean values for most energies, while relatively large differences between the ICRP-116 and mean values were shown for the energies below 0.03 MeV or above 5 MeV, but the differences were all less than 64%. At PA, in contrast to the other irradiation geometries, the ICRP-116 values notably show significant differences with the mean values among the patients, especially for the energies below 0.1 MeV. The differences also tend to become larger for the lower energy by a factor of 567. Interestingly, the ICRP-116 values were significantly underestimated against the mean values and very close to the minimum values.
4) Urinary bladder
Fig. 8 shows the result for the urinary bladder doses. It can be seen that the general trend of the individual variation of urinary bladder doses was similar for all irradiation geometries. That is, the largest variation was observed at the lowest energy but tended to become smaller as the energy increased, while the variation for the energies above 0.1 MeV was generally seen to be negligibly small. The individual variations at AP and PA against the lateral irradiation geometries were generally more significant; for example, for 0.02 MeV, the maximum-and-minimum differences at AP and PA were about 40 times, while those for RLAT, and LLAT were about 10 times, respectively.
The ICRP-116 values for the energies above 0.1 MeV show excellent agreement with the mean values among the patients at all the irradiation geometries; the differences were mostly less than 10%. For the lower energy region, relatively large differences can be seen and overall, the differences are the most significant for AP (e.g., difference of 294 times at 0.01 MeV). Interestingly, the ICRP-116 values only for AP were greater than the mean values and even greater than the maximum values among the patients up to five times. The ICRP-116 values for the other irradiation geometries (PA, RLAT, and LLAT) tended to be underestimated against the mean values but were at least greater than the minimum values among the patients.
5) Lungs
Fig. 9 shows the result for the lung doses. Overall, the individual dose variation for lungs was generally seen to be more significant than that for the organs (brain, skin, breasts, and urinary bladder) discussed above. The general trend of the individual variation in the lung doses was also similar for all the irradiation geometries. The largest variation can be observed at the lowest energy, and the variation tends to decrease as the energy increases. For AP, as an example, the maximum value at 0.015 MeV was 320 times greater than the minimum value, while the maximum-and-minimum difference was reduced to 30% only for 10 MeV. The individual variations for RLAT/LLAT tend to be larger than those for AP/PA.
While a large dose variation among the patients was frequently observed, the ICRP-116 values generally show good agreement with the mean values among the patients in many cases. For AP and PA, the differences between the ICRP-116 and mean values were less than 16% over the entire energy region, except for very low energies (<0.04 MeV), where the largest difference of 11 times was seen for AP and 0.01 MeV. For RLAT and LLAT, relatively large differences between the ICRP-116 and mean values can be seen at energies below 0.1 MeV by up to 58 times (LLAT and 0.01 MeV), whereas the differences above 0.1 MeV were all less than 20%.
6) Stomach
Fig. 10 shows the results for the stomach doses. Similar to the general trend observed in the results for the lungs, the individual variation in the stomach doses was seen to be the most significant at the lowest energy, and the variation gradually decreased as the energy increased. At energies above 4 MeV, the individual variation was small in general; the differences between the maximum-and-minimum values among the patients were mostly less than 20%. At the lower energies (i.e., below 4 MeV), the variation was not negligible and dramatically increased as the energy decreased by up to 3–5 orders of the magnitude (maximum-and-minimum differences). The amount of the variation was generally in a similar level although the variation tended to be larger for AP or lower for LLAT compared with all the other irradiation geometries.
The ICRP-116 values for AP and PA, although significant variations of individual stomach doses exist at the energies below 1 MeV, surprisingly show a good agreement with the mean values among the patients for most energies (differences mostly <18%). Relatively large differences can be observed only at very low energies (i.e., below 0.03 MeV). For LLAT and RLAT, the ICRP-116 values also show a good agreement with the mean values at energies above 0.3 MeV, where the differences are all less than 10%. At the lower energy region (<0.3 MeV), notable differences can be observed by up to 12 times (RLAT and 0.015 MeV); interestingly, the ICRP-116 values against the mean values tend to be underestimated for RLAT but overestimated for LLAT.
7) Liver
Fig. 11 shows the results for the liver doses. The general trend shown in the lungs and stomach doses (i.e., increasing the individual dose variation with decreasing the energy) can also be observed in the liver doses. The individual variation for LLAT was seen to be the most significant over the entire energy region compared with that for other irradiation geometries. At energies above 1 MeV, the individual variation for all irradiation geometries except for LLAT can be considered negligible (maximum-and-minimum differences <10%), but the variation for LLAT cannot be negligible (maximum-and-minimum differences mostly >20%).
The ICRP-116 values generally show an excellent agreement with the mean values among the patients for all the irradiation geometries; the differences between the ICRP-116 and mean values were mostly less than 10%. Only for RLAT and energies below 0.05 MeV, the difference was greater than 20% with the maximum of 24 times at 0.01 MeV, where the ICRP-116 values were underestimated against the mean values but greater than the minimum values.
8) Red bone marrow
Fig. 12 shows the results for the red bone marrow doses. It can be seen that the general trend of the individual variation was similar for all the irradiation geometries. At the energies above 0.2 MeV, the individual variation can be considered negligibly small; the maximum-and-minimum differences were all less than 10%. In contrast, in the lower energy region (<0.2 MeV), the variation was significant and tended to increase as the energy decreased. The largest value of the maximum-and-minimum differences was observed at the lowest energy (0.01 MeV) and varied from 3 to 7 orders of the magnitude depending on the irradiation geometry. In general, the variation for AP was the most significant, whereas that for PA was the least significant, considering the irradiation geometry dependency on the individual dose variation. The variation for RLAT was similar to that for LLAT, as expected, considering that the left and right of the skeletal system and the body shape were nearly symmetrical.
The ICRP-116 values at the energies above 0.2 MeV show an excellent agreement with the mean values among the patients (differences mostly <10%). At the energies below 0.2 MeV, the ICRP-116 values were significantly different from the mean values, and the differences tended to increase with decreasing the energy for all irradiation geometries. The ICRP-116 values for all the energies (below 0.2 MeV) and irradiation geometries were consistently underestimated against the mean values by up to 68 times. The ICRP-116 values, although significantly lower than the mean values, were greater than the minimum values among the patients for all irradiation geometries, except only for PA, where the ICRP-116 values were very close to the minimum values.
3. Discussion
The results of the present study imply several aspects about the individual variation of organ doses for whole-body external exposures to photon beams. We observed that the individual dose variation tends to increase at lower energies. This observation could be explained by the fact that steeper gradient dose distribution (i.e., more significant heterogeneity of the dose distribution in the body) can be established by lower energy photon beams and thus more sensitively affects the resulting doses to the organs linked to the anatomical variation. In other words, the individual dose variation becomes smaller at higher energies, practically resulting in the variation for most cases being considered negligibly small at the photon energies from 0.2 MeV to 10 MeV. Such similar trend was also observed in a previous study [20] that investigated the body size dependency on organ dose calculations for photon external exposures using a set of percentile-specific phantoms constructed from the ICRP mesh-type reference phantoms (ICRP 2020) [21]. At this energy region (0.2–10 MeV), of course, the ICRP-116 organ DCs derived from the ICRP reference voxel phantoms (ICRP 2009) [3] also showed an excellent agreement with those of the patients calculated in this study. Therefore, it would be confident that the use of the ICRP reference phantoms as well as even any non-reference phantoms can provide reliable organ dose values in individual dose assessments for whole-body external exposures with the 0.2–10 MeV photon beams.
At the energies below 0.2 MeV, we frequently observed significant dose variations among the patients. The magnitude of the dose variation is highly dependent on the locations of the organs. The organs deeply located in the body such as stomach and liver generally showed larger dose variations than those shallowly located in the body such as skin and breasts. This trend can be easily understood that the deeply located organs can be strongly influenced by the radiation shielding effect of the fatty tissues, the amount of which is significantly associated with the individual variation in the body size and anatomy. Despite the large individual variations seen at the energies below 0.2 MeV, we surprisingly observed that the ICRP-116 organ DCs (i.e., based on the ICRP reference phantoms) for many cases were similar to the mean values of the organ DCs among the patients and for most cases were at least within a range from the maximum-and-minimum values. The results of the present study quantitatively support the reliability of the ICRP reference phantoms serving as representative persons to produce radiation protection quantities such as effective doses.
Nevertheless, the ICRP-116 organ DCs for several cases were largely different from those of the patients; for example, the ICRP-116 values were significantly underestimated for the breasts and PA (Fig. 7) but overestimated for the urinary bladder and AP (Fig. 8) against the mean values of the patients and even beyond the maximum-and-minimum range. For applications or studies requiring accurate organ dose estimates of individuals and dealing with external exposures to photons below 0.2 MeV such as diagnostic X-ray examinations, it is important to be aware of the large uncertainty potentially involved in the alternative use of representative phantoms, such as the ICRP reference phantoms, in the individual dose assessment.
We acknowledged several limitations of the present study. First, although the CT images for the 30 patients were employed in the present study, these are partial-body CT images and thus cannot fully reflect the anatomical variation among the 30 patients in organ dose calculations. The dose variation of the skin and red bone marrow among all 30 patients can be observed, while the dose variation of some organs such as brain and breasts among the six patients can only be observed in this study. To enhance the insights of the individual dose variations, it is essential to acquire the whole-body CT images and increase the number of patients. Second, eight organs (brain, breasts, lungs, liver, red bone marrow, skin, stomach, and urinary bladder) were considered in the present study while the current ICRP Recommendations (ICRP Publication 103) [1] considered almost 30 organs at a detrimental risk associated with ionizing radiation exposures. Nevertheless, we believe that the eight organs considered, which are widely distributed within the body and also include most of the organs having the highest tissue weighting factors recommended by the ICRP, would be sufficient to represent most of the radiosensitive organs. Finally, in the present study, we focused only on the photon external exposures, which we think would be considered as the most common scenarios for external exposures, while the ICRP-116 provides external DCs for various particles, including not only photons but also neutrons, electrons, and even heavier charged particles. This investigation of the dosimetric variations should be extended to other particles as well as to internal exposure scenarios in the future.
Conclusion
The present study investigated the individual variation in organ doses for photon external exposures (10 keV to 10 MeV) by performing MC dose calculations based on the CT images for 30 patients after eight organs were contoured. The result of this work indeed showed significant variation in organ doses due to the difference in anatomy among the individuals, especially in the kilovoltage energy region (e.g., <100 keV), which is commonly used in diagnostic X-ray imaging procedures such as projection radiography, CT, and fluoroscopy. The amount of the dose variation for the organs deeply located in the body tended to be more significant than for those shallowly located in the body. In the megavoltage energy region (1–10 MeV), on the other hand, the individual variation of the organ doses was found to be negligibly small in general; and thus, the use of a single available phantom might be sufficient to estimate organ doses for most individuals. It was also interestingly observed that the organ doses of the ICRP reference phantoms showed good agreement with the mean values of the organ doses among the patients for many cases rather than expected, supporting the reliability of the ICRP reference phantoms for use in population-based dosimetry mainly for radiological protection purposes. We believe that the results of the present study would be informative for improving their insights on the individual-specific dosimetry, although it should be extended to further studies in the future to tackle many aspects (e.g., other particles such as neutrons or charged particles, other exposures such as internal exposures, increased number of patients), which could not be addressed in the present work.
Notes
Conflict of Interest
No potential conflict of interest relevant to this article was reported.
Ethical Statement
This article uses the anonymized data of computed tomography images of patients, which was confirmed by the Memorial Sloan Kettering Cancer Center Institutional Review Board with the IRB waiver for the data usage.
Author Contribution
Conceptualization: Lee C, Yeom YS. Methodology: Lee Y, Choi JW. Data curation: Braunstein L, Yeom YS. Formal analysis: Lee Y, Yeom YS. Funding acquisition: Braunstein L, Yeom YS. Project administration: Lee C, Yeom YS. Visualization: Lee Y, Choi JW. Writing - original draft: Lee Y, Choi JW. Writing - review & editing: Braunstein J, Lee C, Yeom YS. Approval of final manuscript: all authors.
Acknowledgements
This work was supported by the Korea Institute of Energy Technology Evaluation and Planning (KETEP) and the Ministry of Trade, Industry & Energy (MOTIE) of the Republic of Korea (No. 20214000000070), the National Research Foundation of Korea (NRF) grant funded by the Korean government (No. 2022R1C1C100809312), “Regional Innovation Strategy (RIS)” through the National Research Foundation of Korea (NRF) funded by the Ministry of Education (MOE) (2022RIS-005).