Assessment of Potential Radiation Dose Rates to Marine Organisms Around the Korean Peninsula
Article information
Abstract
Background:
It is very difficult to set a regulatory guidance or criteria for the protection of non-human species from the ionizing radiation, because there are no generally or internationally accepted methods for demonstrating the compliance with such criteria. It is needed that Korea develop the primary dose rate standards for the protection of both aquatic and terrestrial biota in the near future.
Materials and Methods:
The potential dose rates due to both external and internal radiation exposures to marine organisms such as plaice/flounder, gray mullet, and brown seaweed collected within territorial seas around the Korean Peninsula were estimated.
Results and Discussion:
The total dose rates to plaice/flounder, gray mullet and brown seaweed due to 40K, a primordial radionuclide in marine environment, were found to be 0.2%, 0.08% and 0.3% of approximately the values of the Derived Consideration Reference Levels (DCRLs, i.e. 1-10 mGy ․ d-1), respectively, as suggested by the International Commission on Radiological Protection (ICRP) publication 124. The total dose rates to marine fishes and brown seaweed due to anthropogenic radionuclides such as 90Sr, 137Cs and 239+240Pu were considered to be negligible compared to the total dose rate due to 40K. The external exposure to benthic fish due to all radionuclides was much higher than that of pelagic fish.
Conclusion:
From this study, it is recommended that the further study is required to develop a national regulatory guidance for the evaluation of doses to non-human species.
1. INTRODUCTION
The United Nations Scientific Committee on the Effects of Atomic Radiation (UNSCEAR) initially addressed the effects of radiation exposure on plant and animal communities in 1996 [1]. Radiological protection of the environment has greatly advanced since the new recommendation publication 103 of the International Commission on Radiological Protection (ICRP) was adopted on 21 March 2007 [2]. Even though there is no simple or single universal definition of environmental protection, the commission considered that it is necessary to expand into a system of radiological protection including the environment itself [3].
In the past decades, regulatory activities and scientific studies related to radiation protection focused on the human exposure to ionizing radiation from radionuclides resulting from normal operations of nuclear facilities or accidents [4]. It was the prevailing view that if humans were adequately protected, then other living things are also likely to be sufficiently protected [5]. Especially, most national regulatory agencies have implemented their environmental protection mandates within the framework of limiting radiation doses to members of the public. But recently, some countries are developing new regulatory standards for the protection of the environment itself from ionizing radiation.
It is very difficult to set a regulatory guidance or criteria for the protection of non-human species from the ionizing radiation, because there are no generally or internationally accepted methods for demonstrating the compliance with such criteria. In view of this, many countries are currently developing screening methods for evaluating doses to biota for comparison with the proposed regulatory standards. For example, the Department of Energy in the United States (US DOE) sets the dose limit of 10 mGy ․ d-1 for the protection of aquatic organisms and terrestrial plants [6].
In light of this international paradigm, it is needed that Korea also develop the primary dose rate standards for the protection of both aquatic and terrestrial biota in the near future. This study was performed in terms of an understanding of the relationship between the levels of radiation dose and the radioactivity concentrations of some radionuclides in the environmental media, in which the marine organism resides. In this study, the potential radiation dose rates to marine organisms such as plaice/flounder, gray mullet, and brown seaweed collected around the Korean Peninsula were evaluated in terms of the external and internal exposure. These results were also compared with the Derived Consideration Reference Levels (DCRLs) suggested by the ICRP Publication 124 (ICRP 2014) [7].
2. MATERIALS AND METHODS
2.1 Selection of organisms
The Korea Institute of Nuclear Safety (KINS) has biannually monitored the marine environmental radioactivity within territorial seas around the Korean Peninsula since 1994 [8]. A variety of the samples such as seawaters, marine organisms, and sediments are collected at the fixed 22 stations. In this study, among sampled marine organisms, plaice/flounder, gray mullet and brown seaweed were selected in order to estimate dose rates, particularly since it is possible to utilize dose conversion factors recommended by ICRP Publication 108 for the marine organisms [3]. In reality the real shapes and dimensions for those organisms are a little bit different from the assumed those for the reference animals and plants used by the publication ICRP 108 and even gray mullet does not belong to the family Salmonidae (trout).
Considering that the animal kingdom is characterized by a vast variety of shapes and sizes, this is alternative approaches to calculating dose rates to animals [9]. Also, these kinds of marine organisms could be easily sampled from the coast of eastern, southern and western sea of the Korean Peninsula every year. For above reasons, seaweed and two kinds of fish were chosen in this study.
2.2 Radioactivity concentration in the marine environment
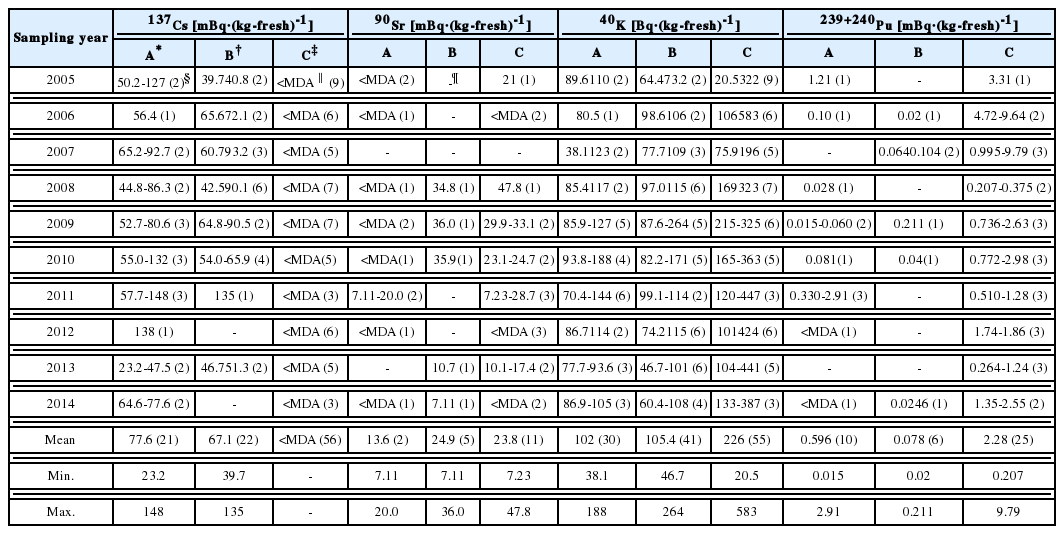
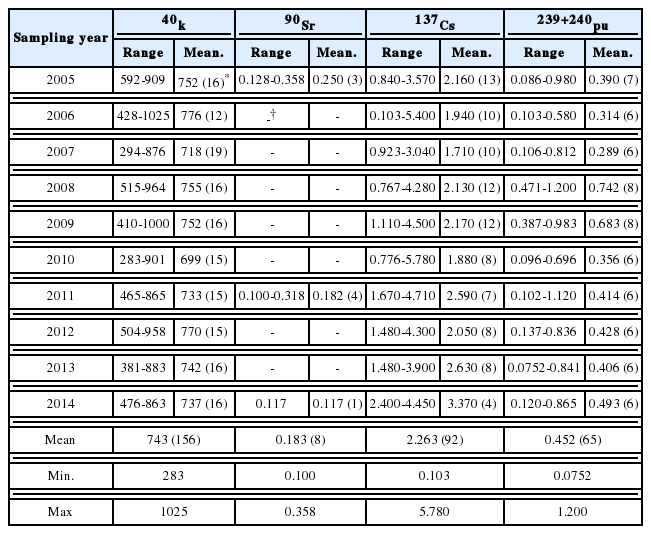
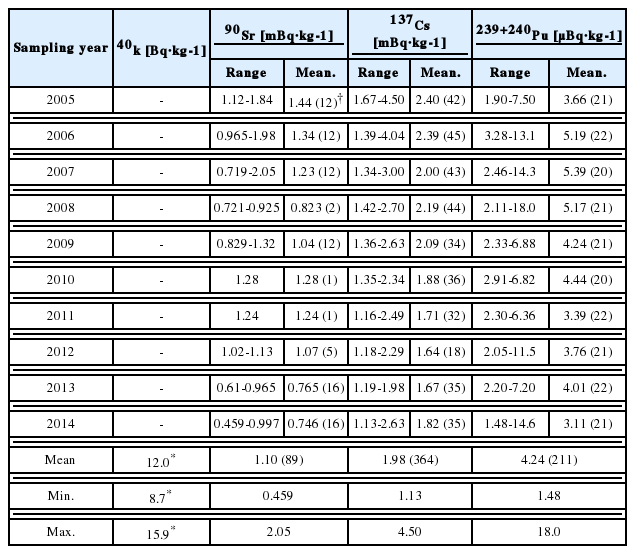
Firstly, the radioactivity concentrations of 40K, 137Cs, 90Sr, and 239+240Pu in marine organisms, sea-water and sediment samples are analyzed in terms of mean, minimum, and maximum value and are listed in Table 1, Table 2, and Table 3, respectively. The radioactivity concentrations of 137Cs in brown seaweeds and 90Sr in plaice/flounder are found to have the lower values of the minimum detectable activity (MDA) for all the analyzed samples except benthic fish in 2011, as shown in Table 1. The MDA values for 137Cs in the samples of brown seaweed and 90Sr in plaice/flounder were estimated to be approximately 100, 10 mBq ․ (kg-fresh)-1, respectively, but a slightly different depending mainly on the sample quantities and the counting times. All these data were provided by the annual report on marine environmental radioactivity survey of KINS from the year of 2005 to 2014 [8].

Radioactivity Concentrations of 137Cs, 90Sr, 40K, and 239+240Pu in Marine Fish and Brown Seaweed Samples Around the Korean Peninsula

Radioactivity Concentrations of 40K, 90Sr, 137Cs, and 239+240Pu in Sediment Samples Around the Korean Peninsula. [Bq·(kg-dry)-1]

Radioactivity Concentrations of 90Sr, 137Cs, and 239+240Pu in Seawater Samples Around the Korean Peninsula.
The radioactivity concentrations of 40K in seawater samples were not determined, as shown in Table 3, since the radionuclide was not the monitoring target of the routine monitoring program of KINS. In this study, the radioactivity concentration of 40K was used from the report on a survey of artificial radionuclides conducted in the East Sea in 1996 [10].
2.3 Dose calculation
In a marine environment, organisms are exposed to radiations from radionuclides in seawater and also sediment in the cases of benthic fish and seaweed, and internally exposed by incorporated radionuclides. Therefore, the total radiation dose received by an organism is the sum of the contributions from both external and internal exposure. The total dose rate (D) is given by [11]:
Where DCFext,r is the dose conversion factor (DCF) for the external exposure due to radionuclide r (μGy ․ day-1 per Bq ․ kg-1); Cs,w,r is the radioactivity concentration of radionuclide r in seawater or sediment (Bq ․ kg-1); DCFint,r is the DCF for the internal exposure due to radionuclide r (μGy ․ day-1 per Bq ․ kg-1); and Co,r is the radioactivity concentration of radionuclide r in marine organism (Bq ․ kg-1). The DCFs in this study (Table 4) are given by Annex C of the ICRP publication 108 (ICRP 2008) [3]. The external exposure of plaice/flounder which live at the interface seawater-sediment was calculated as follows [3]:
Where Dext is the external dose rate; Cw is the radioactivity concentration in seawater for infinite source; Cs is the radioactivity concentration in the sediment. It is implicitly assumed that the DCF at the water/surface interface is one-half of the DCF within the medium (water). Therefore, this equation could be applied for biota living at the sediment/water interface such as flatfish.
3. RESULTS AND DISCUSSION
Table 5 shows the estimated total dose rates to marine organisms around the Korean Peninsula. The mean values of the total dose rates to plaice/flounder due to 40K, 90Sr, 137Cs and 239+240Pu were 1.59 μGy ․ d-1, 3.01×10⁻⁴ μGy ․ d-1, 8.47×10⁻³ μGy ․ d-1, 4.31×10⁻⁵ μGy ․ d-1 and in the range of 0.606-2.53 μGy ․ d-1, 1.60×10⁻⁴-4.96×10⁻⁴ μGy ․ d-1, 4.70×10⁻⁴-2.14×10⁻² μGy ․ d-1, 1.18×10⁻⁶-2.09×10⁻⁴ μGy ․ d-1, respectively.

Total Dose Rates to External and Internal Radiation Exposures to Marine Fish and Brown Seaweed Around the Korean Peninsula [μGy·day-1]
The mean values of the total dose rates to gray mullet due to 40K, 90Sr, 137Cs and 239+240Pu were 0.794 μGy ․ d-1, 3.74×10⁻⁴ μGy ․ d-1, 3.09×10⁻⁴ μGy ․ d-1, 5.55×10⁻⁶ μGy ․ d-1, respectively, and in the range of 0.359-1.96 μGy ․ d-1, 1.07×10⁻⁴-5.41×10⁻⁴ μGy ․ d-1, 1.83×10⁻⁴-6.25×10⁻⁴ μGy ․ d-1, 1.42×10⁻⁶-1.50×10⁻⁵ μGy ․ d-1, respectively.
In case of the external exposure, the estimated dose to benthic fish (plaice/flounder) due to all radionuclides is much higher than that of pelagic fish (gray mullet). Particularly, the external exposure to gray mullet due to 239+240Pu was about five orders of magnitude less than that to plaice/flounder. These results are probably caused by which the gamma external exposure from the sediment is the critical pathway to benthic fish. Meanwhile, there were no significant differences in terms of the internal dose rate between the benthic and pelagic fish.
The mean values of the total dose rates to brown seaweed due to 40K, 90Sr, and 239+240Pu were 2.67 μGy ․ d-1, 6.67×10⁻⁴ μGy ․ d-1, 1.64×10⁻⁴ μGy ․ d-1, respectively, and in the range of 0.644-5.25 μGy ․ d-1, 3.01×10⁻⁴-1.32×10⁻³ μGy ․ d-1, 1.49×10⁻⁵-7.01×10⁻⁴ μGy ․ d-1, respectively. The internal exposure to brown seaweed due to137Cs radionuclides was not estimated because all of the data values were less than MDA.
Figure 1 shows the total dose rates to marine fish and brown seaweed around the Korean Peninsula for different radionuclides. As you see in this figure, the main contribution to the total dose rates is from 40K radionuclide. The total dose rates due to 90Sr were about four orders of magnitude less than those due to 40K radionuclide. Radiation exposure due to 137Cs radionuclide was higher than that due to 90Sr owing to a little higher concentration of 137Cs in marine organism compared to 90Sr. The lowest contribution to the total dose rates is 239+240Pu in this study.
4. CONCLUSION
The total dose rates to plaice/flounder, gray mullet and brown seaweed due to 40K, a primordial radionuclide in marine environment, were found to be 0.2 %, 0.08 %, 0.3 % of approximately of the values of the DCRLs (i.e. 1-10 mGy ․ d-1), respectively, as suggested by the ICRP Publication 124. The total dose rates to marine fishes and brown seaweed due to anthropogenic radionuclides such as 90Sr, 137Cs and 239+240Pu were considered to be negligible compared to the total dose rate due to 40K radionuclide. The external exposure to benthic fish due to all radionuclides was much higher than that of pelagic fish. This result might imply that gamma external exposure from sediment is the critical pathway to benthic organism. From this study, it is recommended that further study is required to develop a national regulatory guidance for the evaluation of doses to non-human species.
Acknowledgements
This study was supported by grants from the Nuclear Safety and Security Commission, Republic of Korea, through the Nuclear Safety Regulatory Technology R&D program (Project No.1305004-0315-CG100).

