Calculation of Low-Energy Reactor Neutrino Spectra for Reactor Neutrino Experiments
Article information
Abstract
Background:
Nuclear reactors produce a great number of antielectron neutrinos mainly from beta-decay chains of fission products. Such neutrinos have energies mostly in MeV range. We are interested in neutrinos in a region of keV, since they may take part in special weak interactions. We calculate reactor antineutrino spectra especially in the low energy region. In this work we present neutrino spectrum from a typical pressurized water reactor (PWR) reactor core.
Materials and Methods:
To calculate neutrino spectra, we need information about all generated nuclides that emit neutrinos. They are mainly fission fragments, reaction products and trans-uranium nuclides that undergo negative beta decay. Information in relation to trans-uranium nuclide compositions and its evolution in time (burn-up process) were provided by a reactor code MVP-BURN.
We used typical PWR parameter input for MVP-BURN code and assumed the reactor to be operated continuously for 1 year (12 months) in a steady thermal power (3.4 GWth). The PWR has three fuel compositions of 2.0, 3.5 and 4.1 wt% 235U contents. For preliminary calculation we adopted a standard burn-up chain model provided by MVP-BURN. The chain model treated 21 heavy nuclides and 50 fission products. The MVB-BURN code utilized JENDL 3.3 as nuclear data library.
Results and Discussion:
We confirm that the antielectron neutrino flux in the low energy region increases with burn-up of nuclear fuel. The antielectron-neutrino spectrum in low energy region is influenced by beta emitter nuclides with low Q value in beta decay (e.g. 241Pu) which is influenced by burp-up level: Low energy antielectron-neutrino spectra or emission rates increase when beta emitters with low Q value in beta decay accumulate
Conclusion:
Our result shows the flux of low energy reactor neutrinos increases with burn-up of nuclear fuel.
1. INTRODUCTION
A great number of neutrinos from a nuclear reactor give possibility of neutrino application. Based on current knowledge. There are some ideas to make neutrino measurement for nuclear reactor monitoring (non-proliferation monitoring) and for monitoring reactor power and cycles1),. Our group is interested in the experiment influenced by low energy neutrinos in a region of keV [1].
Neutrinos are produced in the reactor via beta decay. For neutrino research, neutrino energy spectrum is required. However, it is hard to experimentally obtain neutrino spectrum below 1.8 MeV due to the threshold energy of inverse beta decay.
Reactor neutrino spectra can be calculated theoretically in principle. To compute neutrino spectra we need information on all created nuclides that emit neutrinos. The nuclides are mainly fission fragments, reaction products and trans-uranium nuclides that undergo negative beta decay.
Information on fuel compositions and their evolution in time (burn up process) is provided by reactor neutronics calculation codes. Among them MVP-BURN code enables us to make the burn-up calculations using continuous-energy Monte Carlo code MVP and auxiliary code BURN which calculates the buildup and decay of nuclides in irradiated materials [2, 3]. In this paper we use this code with JENDL-3.3 as nuclear data library [4].
Our result shows the antielectron neutrino flux in the low energy region increases with burn-up of nuclear fuel and influenced by accumulated nuclides with low Q values in beta decay.
2. MATERIAL AND METHODS
2.1 Reactor Parameters
Reactor parameters such as reactor thermal power, fuel characteristics and core geometry determine the number of produced nuclides, which generate probabilistic spectra of emitted antielectron-neutrinos.
2.1.1 Reactor Geometry and Fuel
We used typical Pressurized Water Reactor (PWR) parameters as input for the MVP-BURN code. The PWR input takes three fuel compositions of 2.0, 3.5 and 4.1 wt% 235U contents. We divide the reactor operation period into 12 time steps; each step is one-month duration in a steady thermal power (3.4 GWth).
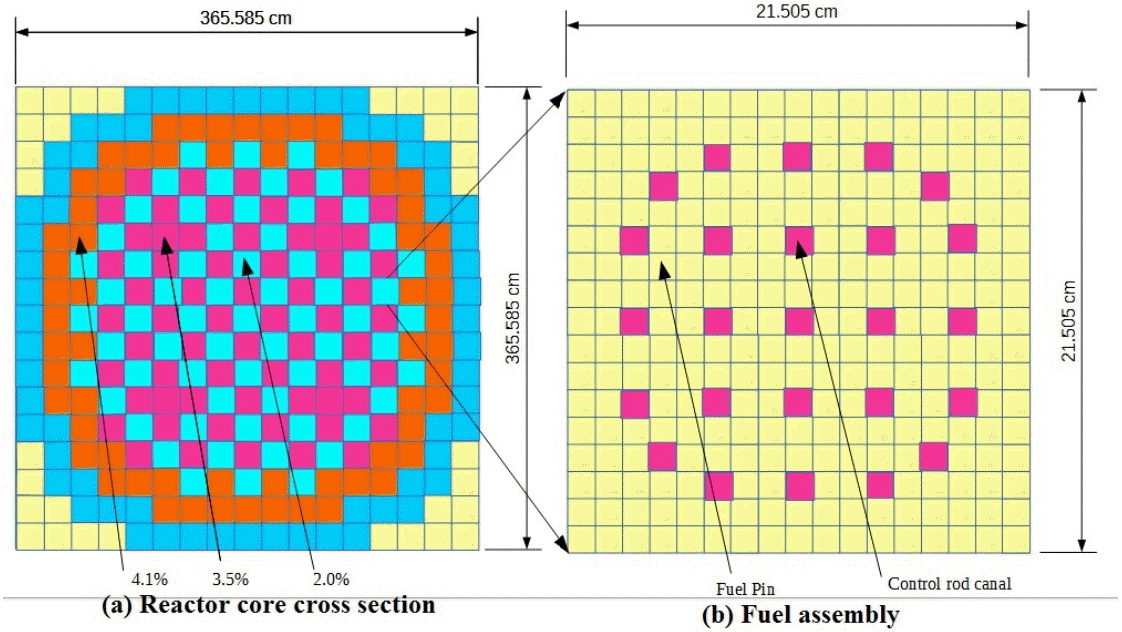
Figure 1 illustrates cross section, geometry and fuel configuration for both PWR core and fuel assembly. Left drawing (Fig. 1A) shows the reactor core cross section and dimension; color indicates placement of three fuel compositions in core, i.e., orange for 4.1 t%, pale blue for 2.0 wt% and pink for 3.5 wt% 235U contents. Right one (Fig. 1B) stands for the fuel assembly cross section; yellow color shows fuel pin region and pink one does coolant canal/control rod canal.

Reactor core geometry in calculation. (a): Reactor core cross section and dimension; color indicates placement of three fuel compositions in core (orange for 4.1 wt%, pale blue for 2.0 wt% and pink for 3.5 wt% 235U contents). (b): Fuel assembly cross section; color stands for fuel pin region (yellow) and coolant canal/control rod canal (pink).
2.1.2 Nuclear Data Library
For preliminary calculation we adopted a standard burn-up chain model provided by MVP-BURN. The chain model treated 21 heavy nuclides and 50 fission products. The MVB-BURN code utilized JENDL 3.3 as nuclide library. We progress to calculate other nuclides such as trans-uranium because they may have considerable contribution to low energy electron neutrino spectra. For heavy nuclides we utilize International Atomic Energy Agency (IAEA) nuclear data library2), for other fission product nuclide decay information we use JENDL FP Decay Data File 2011 (JENDL/FPD 2011) [5].
2.2 Reactor Antielectron-neutrino Spectra
In this work we focus on reactor antielectron-neutrinos spectra in a low energy region below 30 keV for typical PWR with standard fuel. Structural elements should have contribution to reactor antielectron-neutrino spectra. Our previous calculation shows that antielectron neutrino spectra from structural constituent is relatively low in comparison to antielectron neutrino spectra from fission product (FP) [6].
Measurements of reactor antielectron neutrinos mostly rely on inverse beta decay (IBD) reactions. Those neutrinos which have energies smaller than 1.8 MeV cannot be detected with this mechanism [7]. As a first attempt at low energy reactor antielectron neutrino estimate, we compute low energy spectra from FP and trans-uranium nuclide.
2.2.1 Antielectron neutrinos from Nuclides
First we generate nuclide yield which have contribution to spectra using MVP-BURN code. Then, we calculate β- and antielectron-neutrino probabilistic spectra with use of
and
where
Cv : Constant of the interaction strength
F(Z,Eβ) : Fermi function
M : Transition matrix element
Q : Q value of the reaction
m0 : Electron rest mass
Y : Yield of nuclides
As for Fermi function we use the following equation with provided table [8].
where
p : Momentum
ρ : Nuclear radius
α : Hyperfine structure constant
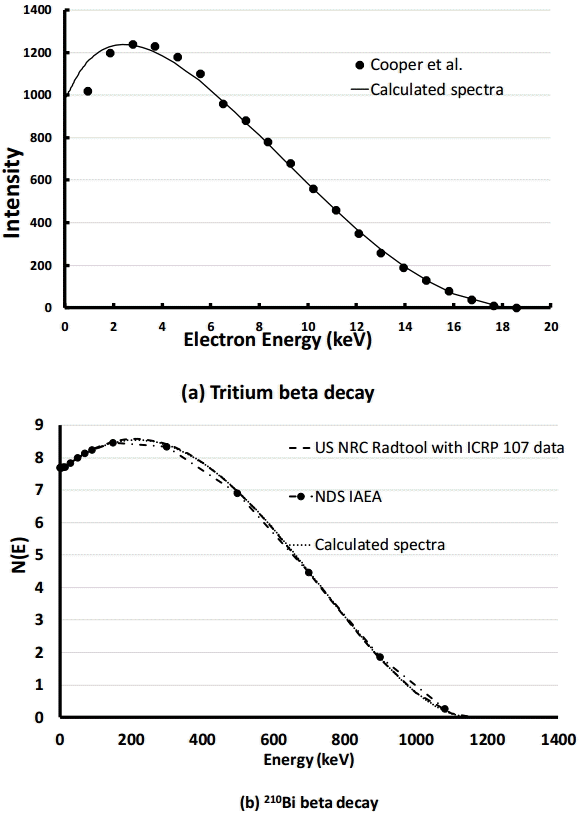
Figure 2 gives beta spectra generated from the above equation. The results are in good agreement with the experimental data [9, 10].
2.2.2 Antielectron-neutrino from Reactor Core
To generate spectra from reactor we sum spectra from nuclides of heavy nuclides and fission products as
where β- is the nuclide extracted from MVP-BURN output and fission product.
Additionally, the MVP-BURN code provides numbers of nuclides at a particular time (e.g. each month or special time step). With the output data we compute reactor antielectron-neutrino spectra from beginning of cycle (BOC) to end of cycle (EOC).
3. RESULTS AND DISCUSSION
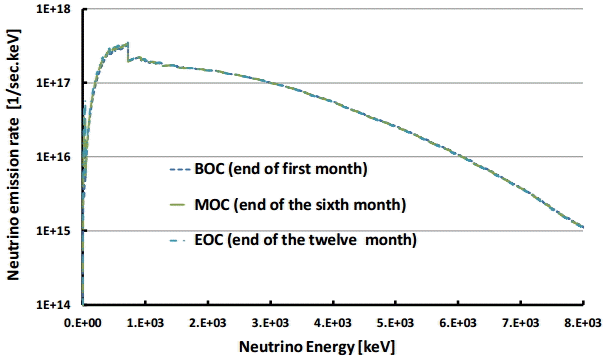
Figure 3 presents the antielectron-neutrino spectra as emission rate in the whole energy region. We can see that antielectron-neutrinos emitted with low energy below about 100 keV are relatively small compared with higher energy portion in a few MeV region.

Calculation results of antielectron-neutrinos spectra. The curves provide spectra at BOC (beginning of cycle at the end of the first month), MOC (medium of cycle) and EOC (end of cycle).
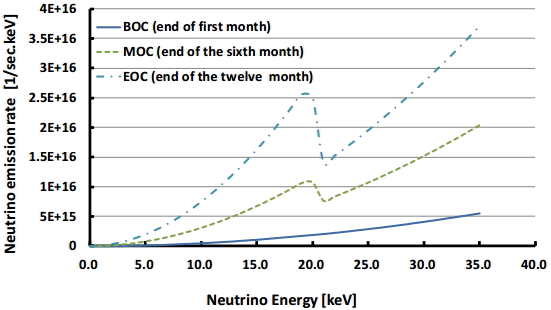
Figure 4 shows the spectra in the low energy region below 35 keV. Emission rate of low- energy neutrinos below 20 keV arises as the burn-up increases. At the EOC (end of cycle, twelfth month) low energy antielectron-neutrino emission rate gives the largest values. The spectral peak around 20 keV is ascribed to the maximum beta decay energy Q (β) = 20.783 keV of 241Pu. One can see that 241Pu build-up during reactor operation exerts a great influence on the emission of antielectron-neutrino.

Calculated antielectron neutrino spectra in the low energy region below 30-keV energy. The curves provide spectra at BOC (beginning of cycle at the end of the first month), MOC (medium of cycle) and EOC (end of cycle).
We only consider nuclides which are loaded in the core are the first burning by MVB-BURN. These spectra should change with inclusion of burned fuel which contains other heavy nuclide such as trans-uranium, other fission products and other nuclides (such as tritium).
4. CONCLUSION
We applied the MVP-BURN code to calculate the antielectron-neutrino spectra from typical PWR. We confirm that the antielectron neutrino flux in the low energy region increases with burn-up of nuclear fuel. The antielectron-neutrino spectrum in low energy region is influenced by beta emitter nuclides with low Q value in beta decay (e.g. 241Pu) which is influenced by burp-up level: Low energy antielectron-neutrino spectra or emission rates increase when beta emitters with low Q value in beta decay accumulate.
Addition of more nuclides with low Q value in beta decay, may lead to changed spectra: Another type of reactor, for example CANDU reactor, may have different low energy spectra in comparison the present calculation because of tritium influence, tritium Q (β) of 18.591 keV.
Notes
Lane C, et al. A new type of neutrino detector for sterile neutrino search at nuclear reactors and nuclear nonproliferation applications. 2015 Jan 27; arXiv:1501.06935v1.
