Optical Characterizations of TlBr Single Crystals for Radiation Detection Applications
Article information
Abstract
Background:
TlBr is of considerable technological importance for radiation detection applications where detecting high-energy photons such as X-rays and γ-rays are of prime importance. However, there were few reports on investigating optical properties of TlBr itself for deeper understandings of this material and for making better radiation detection devices. Thus, in this paper, we report on the optical characterizations of TlBr single crystals. Spectroscopic ellipsometry (SE) and photoluminescence (PL) measurements at RT were performed for this work.
Materials and Methods:
A 2-inch TlBr single crystalline ingot was grown by using the vertical Bridgman furnace. SE measurements were performed at RT within the photon energy range from 1.1 to 6.5 eV. PL measurements were performed at RT by using a home-made PL system equipped with a 266 nm-laser and a spectrometer.
Results and Discussion:
Dielectric responses from SE analysis were shown to be slightly different among the different samples possibly due to the different structural/optical properties. Also from the PL measurements, it was observed that the peak intensities of the middle samples were significantly higher than those of the other two samples. With the given values for permittivity of free space (ε0 = 8.854x10⁻¹² F·m-1), thickness (d = 1 mm), and area (A = 10x10 mm2) of the TlBr sample, capacitances of TlBr were 6.9 pF (at hν = 3 eV) and 4.4 pF (at hν = 6 eV), respectively.
Conclusion:
SE and PL measurement and analysis were performed to characterize TlBr samples from the optical perspective. It was observed that dielectric responses of different TlBr samples were slightly different due to the different material properties. PL measurements showed that the middle sample exhibited much stronger PL emission peaks due to the better material quality. From the SE analysis, optical, dielectric constants were extracted, and calculated capacitances were in the few pF range.
1. INTRODUCTION
TlBr is of considerable technological importance for radiation detection applications where detecting high-energy photons such as X-rays and γ-rays are of prime importance [1]. TlBr material has high effective atomic number (Zeff=(81+35)/2=58), high density (7.56 g·cm-3), and the high optical bandgap (~2.7eV) [2], which are all desirable properties for making high-performance radiation detectors operable at room temperature (RT). Furthermore, TlBr melts congruently above a relatively low melting point of 480℃ and has no destructive phase transition between the solidification and RT, thus enabling the simple melt-based crystal growth processes [3]. Therefore, a lot of efforts were devoted to realizing high-quality bulky single crystals of TlBr. For example, Hitomi et al. [3, 4] reported on the growth and characterization of TlBr single crystals grown by using the combination of multi-pass zone-purification and travelling molten zone (TMZ) growth methods. They could obtain nearly stoichiometric, high-purity, and single crystalline TlBr, resulting in the radiation detection devices with good charge transport and radiation detection performances. However, there were few reports on investigating optical properties of TlBr itself. In other word, further investigations on the optical characteristics of TlBr should be performed for deeper understandings of this material and for making better radiation detection devices.
Thus, in this paper, we report on the optical characterizations of TlBr single crystals grown by using the vertical Bridgman method. Spectroscopic ellipsometry (SE) and photoluminescence (PL) measurements at RT were performed for this work. The complex dielectric function, which has not yet been reported in detail in the previous reports, was obtained by SE in the energy spectral region from 1.1 to 6.5eV. From this result, capacitance of our TlBr samples was calculated. Based on the PL measurement and analysis results, qualities of TlBr single crystals from the optical perspectives are discussed.
2. MATERIALS AND METHODS
A 2-inch TlBr single crystalline ingot was grown by using the vertical Bridgman furnace. Detailed growth and subsequent sampling procedures can be found in reference [5]. Briefly speaking, TlBr samples from the top, middle, and bottom part of the ingot were mechanically and chemically polished to a mirror-like finish.
SE measurements were performed at RT by using a V-VASE system (J.A. Woollam Co., Lincoln, NE) within the photon energy range from 1.1 to 6.5eV. While doing SE analysis with the measured parameters (psi/delta values), we assumed a 3-layer sample structure, namely, TlBr itself, “intermix” layer based on the EMA (effective medium approximation) [6] to mimic the surface roughness of TlBr, and finally air. More detailed measurement and analysis procedures can also be found in references [7, 8].
PL measurements were performed at RT by using a home-made PL system equipped with a 266 nm-laser (MPL-N-266-30mW, Changchun New Industries Optoelectronics Tech Co. Ltd., Changchun, China) and a spectrometer (SA-100, Lamda Vision Inc., Kanagawa, Japan) Sample stage was located inside the dark box to eliminate any contribution by the external light source. Measurement wavelength range was from 300 to 800nm.
3. RESULTS AND DISCUSSION
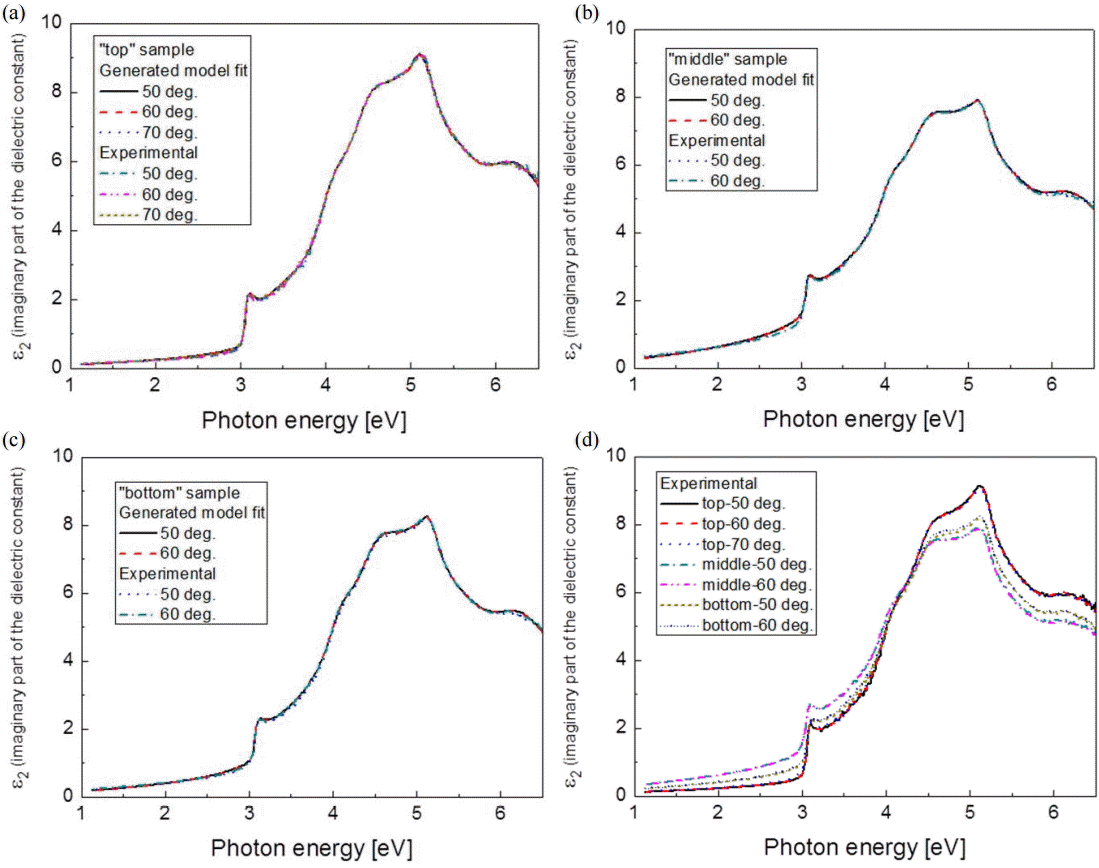
Figure 1 (a)-(c) show experimentally measured curves and generated model fits for top, middle, and bottom parts of a TlBr crystal, respectively, as a function of incidence angles of linearly polarized light. Considering the fact that a MSE (mean squared error) close to, or on order of, unity provides little difference between experimental spectra and theoretical spectra as well as correct extracted physical parameters verified with other metrology techniques [9], we can mention that qualities of our fitting procedures were good because the MSE values were below 2 for all our model fits. It is also noted that there were negligible effects of incidence angles (50-70 degrees) of linearly polarized incident light on the measured experimental dielectric properties. If we compare three different measurement results as summarized in Figure 1D, we can observe that dielectric responses were shown to be slightly different among the different samples possibly due to the different material properties (i.e. structural/optical properties), as also reported in ref. [5].

Experimentally measured curves and generated model fits for (a) top, (b) middle, and (c) bottom samples, respectively, as functions of incidence angles and photon energies of linearly polarized light, (d) compilation of experimentally measured curves for top, middle, and bottom samples, respectively as a function of incidence angle.
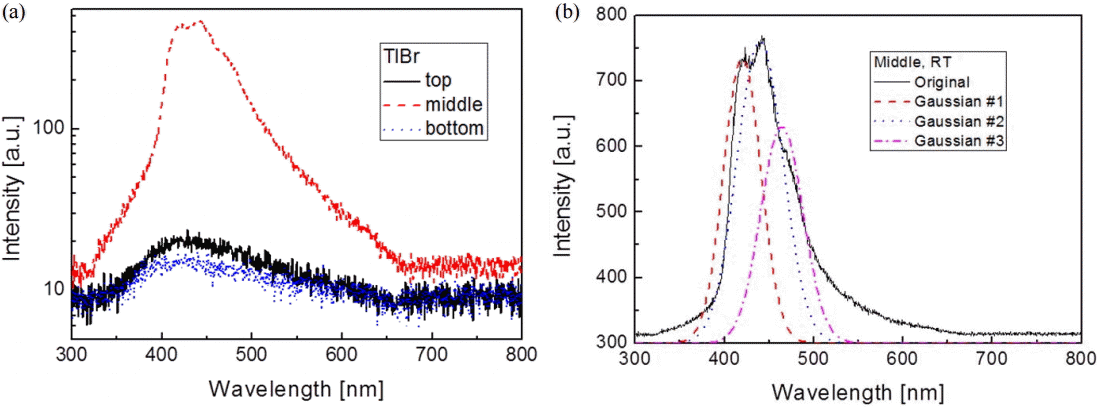
Figure 2 (a) shows PL measurement results for top, middle, and bottom samples. We can clearly observe that the peak intensities of the middle samples were significantly higher than those of the other two samples. Zhang et al. [10] also observed similar phenomena that their highest-quality sample exhibited highest PL peak intensity and narrowest FWHM. Thus, we can judge that the middle sample is of highest material qualities from the optical perspective, consistent with our recent observation [5].

(a) RT-PL measurement results for top, middle, and bottom samples, respectively, (b) deconvolution results of the middle sample’s photoluminescence(PL) spectrum.
Because the material quality of the middle sample was the best among the three samples, we hereafter focused on the middle sample only for deeper analyses. Figure 2 (b) shows deconvolution results of the middle sample’s PL spectrum (Fig. 2 (a)). This was obtained by deconvolution of the experimental spectra assuming Gaussian line shape for the PL emission bands [11]. It is noted that deconvolution of the original spectrum resulted in the three peaks with wavelengths of 421 nm (= 2.95 eV), 441 nm (= 2.81 eV), 467 nm (= 2.66 eV), respectively. Hayakawa et al. [12] also reported similar results and explained that the PL peak at 3eV originates from direct transition and the peak at 2.6 eV is indirect transition emission relating to impurities [13]. However, there is some notable difference for relative intensities of the 2.6 eV and 3.0 eV peaks between our case (Fig. 2 (b)) and that reported by Hayakawa et al [12], and the existence of strong 2.8 eV peak in our case was not mentioned in reference [12]. We are thus currently under further investigation to clarify this point.
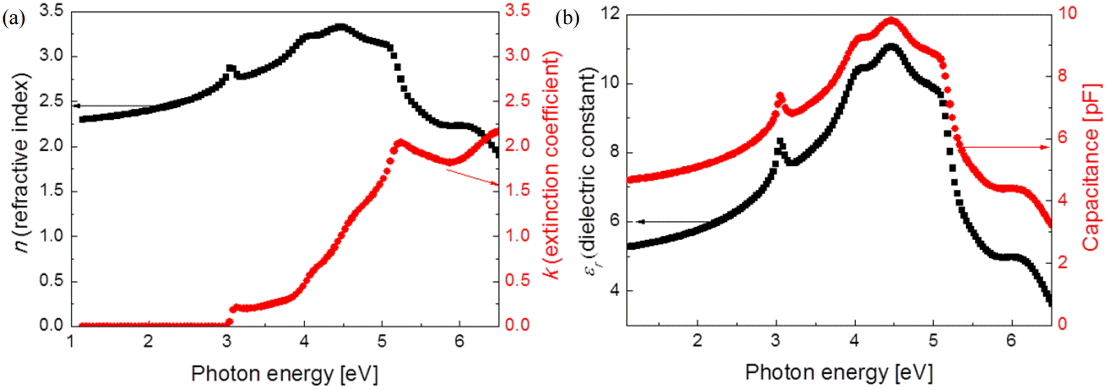
Figure 3 (a) shows refractive indices (n) and extinction coefficients (k) as a function of photon energy (in eV) for the middle sample. MSE value was below 2 for this model fit. It should also be mentioned that the surface effects were more exquisitely incorporated into the physical modeling procedure, thus resulting in the zero k values below the edge, which leads to the enhancement of the quality of the model fit. With n and εr (= n2) values, capacitance can be calculated based on the simple equation below [14];

(a) Refractive indices (n) and extinction coefficients (k) as a function of photon energy (in eV) for the middle sample, (b) relative permittivity (=dielectric constant, εr) and capacitance of the middle sample.
With the given values for permittivity of free space (ε0 = 8.854x10⁻¹² F·m-1), thickness (d = 1 mm), and area (A = 10x10 mm2) of the TlBr sample, capacitance values were calculated and plotted in Figure 3B. For example, capacitances of TlBr were 6.9 pF (at hν = 3 eV) and 4.4 pF (at hν = 6 eV), respectively. These values are similar to the ones reported for other radiation detection materials (HgI2) by Wang et al. [15].
Kim et al. [5] recently reported that the middle sample from the middle part of the grown TlBr ingot exhibited lower impurity concentrations, better crystalline quality, and higher resistivity. Those data might be correlated with the different dielectric responses (Fig. 1 (d)) and stronger PL peaks (Fig. 2). Furthermore, the middle sample has capacitances on the order of several pF, which values are good enough [15] for this material to be used to fabricate lower-noise radiation detection devices. Thus, we can conclude that high-quality TlBr samples can be utilized to make high-performance next-generation solid-state ionizing radiation detectors.
4. CONCLUSION
SE and PL measurement and analysis were performed to characterize TlBr samples from the optical perspective. It was observed that dielectric responses of three (top, middle, and bottom) TlBr samples were slightly different due to the different material properties. PL measurement results showed that the middle sample exhibited much stronger PL emission peaks due to the better material quality. From the SE analysis, optical, dielectric constants were extracted, and subsequently calculated capacitances were in the few pF range. These observations lead to the conclusion that the TlBr is promising to fabricate high-performance next-generation radiation detectors.
Acknowledgements
The authors would like to express their sincere gratitude to Prof. Tae Jung Kim, Prof. Young Dong Kim, and Mr. Han Gyeol Park (all with Department of Physics, Kyung Hee University) for supporting SE measurement and analysis, and to Prof. Kyoung-Kook Kim and Mr. Dongjun Kim (all with Department of Nano-optical Engineering, Korea Polytechnic University) for supporting PL measurement and analysis. This work was financially supported by Nuclear R&D program of the Ministry of Science, ICT & Future Planning (MSIP) of South Korea (NRF-2010-0026096, NRF-2013M2A2A4023359, NRF-2013M2B2B1075775) and by a grant from Korea Atomic Energy Research Institute (grant No.: 523280-16).