AbstractBackgroundRadiation portal monitors (RPMs) involving plastic scintillators installed at the border inspection sites can detect illicit trafficking of radioactive sources in cargo containers within seconds. However, RPMs may generate false alarms because of the naturally occurring radioactive materials. To manage these false alarms, we previously suggested an energy-weighted algorithm that emphasizes the Compton-edge area as an outstanding peak. This study intends to evaluate the identification of radioactive sources using an improved energy-weighted algorithm.
Materials and MethodsThe algorithm was modified by increasing the energy weighting factor, and different peak combinations of the energy-weighted spectra were tested for source identification. A commercialized RPM system was used to measure the energy-weighted spectra. The RPM comprised two large plastic scintillators with dimensions of 174×29×7 cm3 facing each other at a distance of 4.6 m. In addition, the in-house-fabricated signal processing boards were connected to collect the signal converted into a spectrum. Further, the spectra from eight radioactive sources, including special nuclear materials (SNMs), which were set in motion using a linear motion system (LMS) and a cargo truck, were estimated to identify the source identification rate.
Results and DiscussionEach energy-weighted spectrum exhibited a specific peak location, although high statistical fluctuation errors could be observed in the spectrum with the increasing source speed. In particular, 137Cs and 60Co in motion were identified completely (100%) at speeds of 5 and 10 km/hr. Further, SNMs, which trigger the RPM alarm, were identified approximately 80% of the time at both the aforementioned speeds.
ConclusionUsing the modified energy-weighted algorithm, several characteristics of the energy weighted spectra could be observed when the used sources were in motion and when the geometric efficiency was low. In particular, the discrimination between 60Co and 40K, which triggers false alarms at the primary inspection sites, can be improved using the proposed algorithm.
IntroductionThe radiation portal monitor (RPM) systems, installed at airports or other ports to detect illicit trafficking of radioactive materials, are mostly developed using plastic scintillators. These detectors, used to quickly detect radiation emanating from large cargo containers, are manufactured on a large scale [1]. However, plastic scintillators composed of carbon and hydrogen have a higher probability of Compton scattering than the photoelectric effect, and its large size with relatively narrow surface area of PMTs causes many reflections of produced optical photons that gives rise to poor energy resolution in comparison to semiconductor detectors or inorganic scintillators. Thus, when used to identify radioisotopes, their ability to measure the photo-peak of incident gamma radiation emitted from the original radioisotope is limited. Nevertheless, in terms of detecting radioactive materials, the gross count and energy window algorithms have been applied to the conventional RPM system.
The gross count algorithm triggers an alarm when the measured total count rate of radioactive sources in a container exceeds a certain threshold. However, this algorithm cannot distinguish between artificial and natural radionuclides with high accuracy [2]. Owing to poor energy resolution, numerous false alarms have been caused by naturally occurring radioactive materials (NORM), which also emit radiation similar to that emitted by the targeted artificial sources. This leads to interruptions in logistics and necessitates secondary inspections.
The energy window algorithm, developed based on the gross count algorithm, discriminates between artificial and natural radionuclides by comparing the ratio of measured counts in a designated energy window of energy spectrum. However, this method is hardly used to discriminate between isotopes such as 60Co (0.960 and 1.116 MeV) and 40K (1.243 MeV) that have theoretically similar gamma energy within the same energy window [3].
Therefore, it has been suggested that RPMs should employ NaI(Tl) [4] or high-purity germanium (HPGe) radiation detectors [5], considering the energy resolution of the detector or, alternatively, an algorithm based on the artificial neural network concept that includes the pattern-matching information of the energy spectrum [6]. However, owing to physical constraints and high cost, these systems were also evaluated as being unsuitable for a port environment. Consequently, these new methods have not yet been implemented in a practical RPM system.
The Pacific Northwest National Laboratory (PNNL) has reported that several gamma sources such as 137Cs or 60Co have demonstrated an intrinsic Compton maximum in their energy spectrum [7]. Based on the physical properties of plastic scintillators, we had earlier proposed an energy-weighting algorithm that emphasizes the Compton maximum in the form of a peak by multiplying the counts per channel of the energy spectrum with the energy of the corresponding channel [8–11]. Using this algorithm, we could distinguish among 137Cs, 60Co, 226Ra, and 22Na in a lab-scale experiment. In particular, the energy-weighted spectra of 137Cs, 60Co, and 226Ra set in motion by a vehicle were also successfully identified at one of the domestic ports in Korea, where a commercial RPM was installed. However, in the American National Standard Institute (ANSI) N42.38 [12], ANSI recommends that a total of 19 radiation sources, including special nuclear materials (SNMs), should be used for the performance evaluation of RPM systems. When the concentration of the nuclide of interest increases, even an energy-weighted algorithm may identify the overlap of peak detection regions, thereby reducing the accuracy of nuclide classification.
Therefore, the goals of this study are to formulate an improved energy-weighted algorithm by changing the intensity of energy weighting and evaluate the degree of identification of radiation from various sources through repeated measurements of the spectrum.
Materials and Methods1. Improvement of Energy-Weighted AlgorithmThe energy-weighted algorithm proposed in the previous studies multiplies the counts in each energy bin and the energy corresponding to the same channel (in the form of a coefficient) using the following equation:
where CEW,i is the energy-weighted count of the energy spectrum’s i th bin, Ci is the original optical photon count in the i th bin, and Ei is the energy coefficient in the i th bin [8–11]. Applying the equation, it was observed that the increased area, such as the Compton maximum of the gamma energy spectrum measured by the plastic scintillator, was converted into an identifiable peak as shown in Fig. 1.
However, as the number of sources of interest increases, the number of peak detectable areas also increases. This causes overlaps between the areas and hinders accurate peak detection for source discrimination. Therefore, considering that the energy-weighted algorithm derives different features of the spectrum, Equation (1) was transformed into Equation (2) with the integer constants a and b:
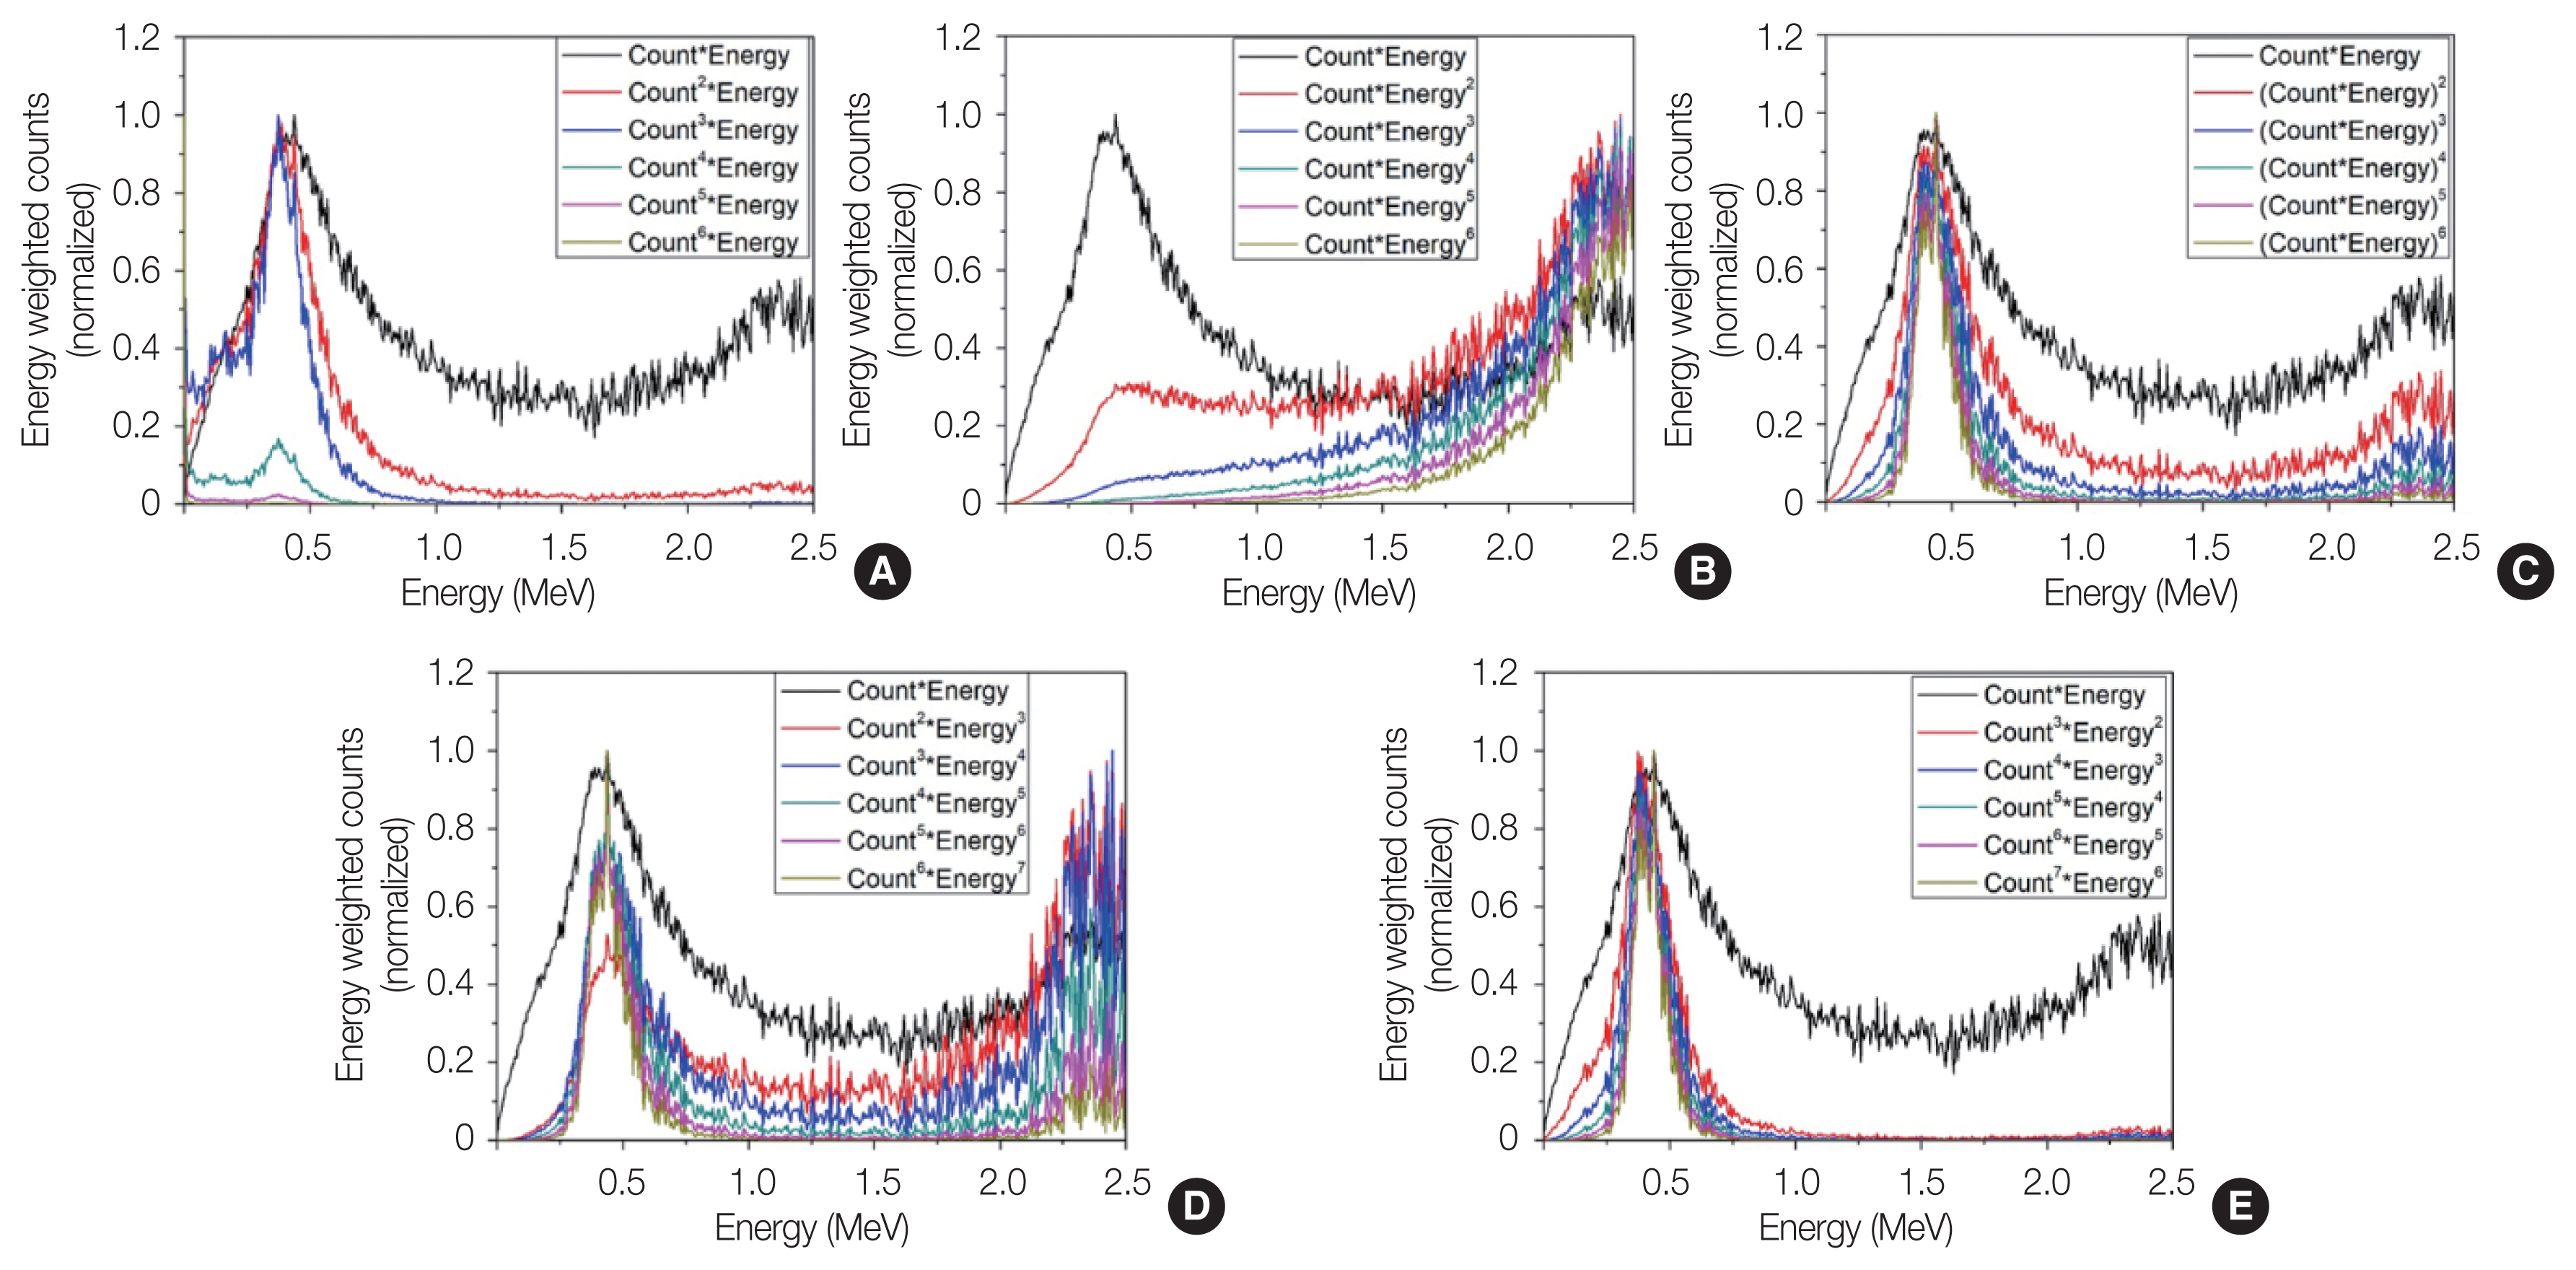
The exponents a and b were varied and the resultant energy-weighted spectra of 212Bi corresponding to these variations are presented in Fig. 2. The energy spectrum of 212Bi as raw data was calculated using the Geant4 simulation under the same conditions as in the previous study [8]. It was observed that the peak obtained using the Ci × Ei equation was more emphasized as the exponent of the “count” was raised to power as depicted in Fig. 2A. Further, as the exponent of “energy” was raised, a tremendous increase was observed in the energy-weighted counts in the high-energy region. In the case of simultaneous weighting of the “count” and “energy”, an improved resolution of the peak was observed, as presented in Fig. 2C–2E.
Considering that the degree of spectral resolution and emphasis of statistical fluctuations are different depending on the application of the exponents, three energy-weighting equations were applied simultaneously as follows:
These equations were arbitrarily determined considering the number of used radioactive sources. Therefore, they are not optimized value and can be further modified according to the interested radionuclides. And nuclide classification was performed in combination with a comparison of the count ratio of the energy spectrum, as depicted in the flowchart presented in Fig. 3.
Furthermore, when the energy-weighted algorithm was applied, the statistical fluctuation of the energy spectrum measured under moving condition is increased as it goes to the high-energy region [10]. And it was found that the maximum peak positions fluctuate within tens of keV due to it. Therefore, it is essential to designate the energy window where can detect fluctuating peaks for each radioisotope of interest.
In the normalized energy weighted spectrum measured under static condition, the peak region is no Poisson distribution. We calculated the width (b to c shown in Fig. 4) between the maximum peak and a point at 80% height of the peak on the high-energy side. And it was considered as half of the peak detectable energy window. The height at 80% of peak was conservatively decided to search peak in any condition. The same width was additionally applied to the region before the peak as the other half of the energy window (a to b).
2. RPM System under Test and Spectrum Measurement ConditionIn this study, the commercialized RPM (Model 4500-3000; Ludlum Measurements Inc., Sweetwater, TX, USA) installed on the test track located at PNNL for performance test was used as shown in Fig. 5. The used RPM model was one of commercialized models have been used at inspection site in seaport or airport. The RPM consists of two 174×29×7 cm3 sized plastic scintillators made of polyvinyltoluene (PVT) panels bonded with photomultiplier tubes (PMT). The distance between the faces of each panel was 4.6 m, as depicted in Fig. 5. In addition, to divide the signal obtained from the PMTs, signal summing (SS) boards fabricated in-house and a data acquisition (DAQ) board [11] were connected to the PMTs using a T-connector.
The divided signal was converted into an energy spectrum that the original system does not measure. The SS boards conduct the signals synthesized from the two PMTs and the DAQ board converts the composed analog signal into a digital signal. The digitized signals were converted into the energy and energy-weighted spectra through a spectrum-monitoring program based on LabVIEW (version 2014; National Instrument Corp., Austin, TX, USA) which was similar program used in [11] for testing, as presented in Fig. 6. Especially, for the peak detection, we used “threshold peak detection VI” in the LabVIEW. It scans the input data and search valid peaks through evaluating the parameters of threshold and width of spectrum (https://www.ni.com/ko-kr/support/documentation/supplemental/06/peak-detection-using-labview-and-measurement-studio.html).
We measured the energy-weighted spectra of eight radioactive sources including the SNMs listed in Table 1 based on recommended sources [12]. The sources were set in motion using the linear motion system (LMS) and intermodal cargo container (IMCC) depicted in Fig. 7 at speeds of 5 and 10 km/hr along the center track between the two PVT panels. The sources on the LMS of 13.4 m length were in bare condition without any shielding material and their speeds were controlled by computer. The IMCC, including a 6-m steel container, which can be shielding material, was moved using a global positioning system (GPS) to maintain constant speed.
Results and Discussion1. Spectrum Analysis of Moving SourcesIn this study, the energy spectra of eight radionuclide sources were studied as three types of energy-weighted spectra. It was commonly observed that each energy-weighted spectrum of all the sources had a specific peak location although high statistical fluctuation errors of spectrum were identified as the speed of the source increased.
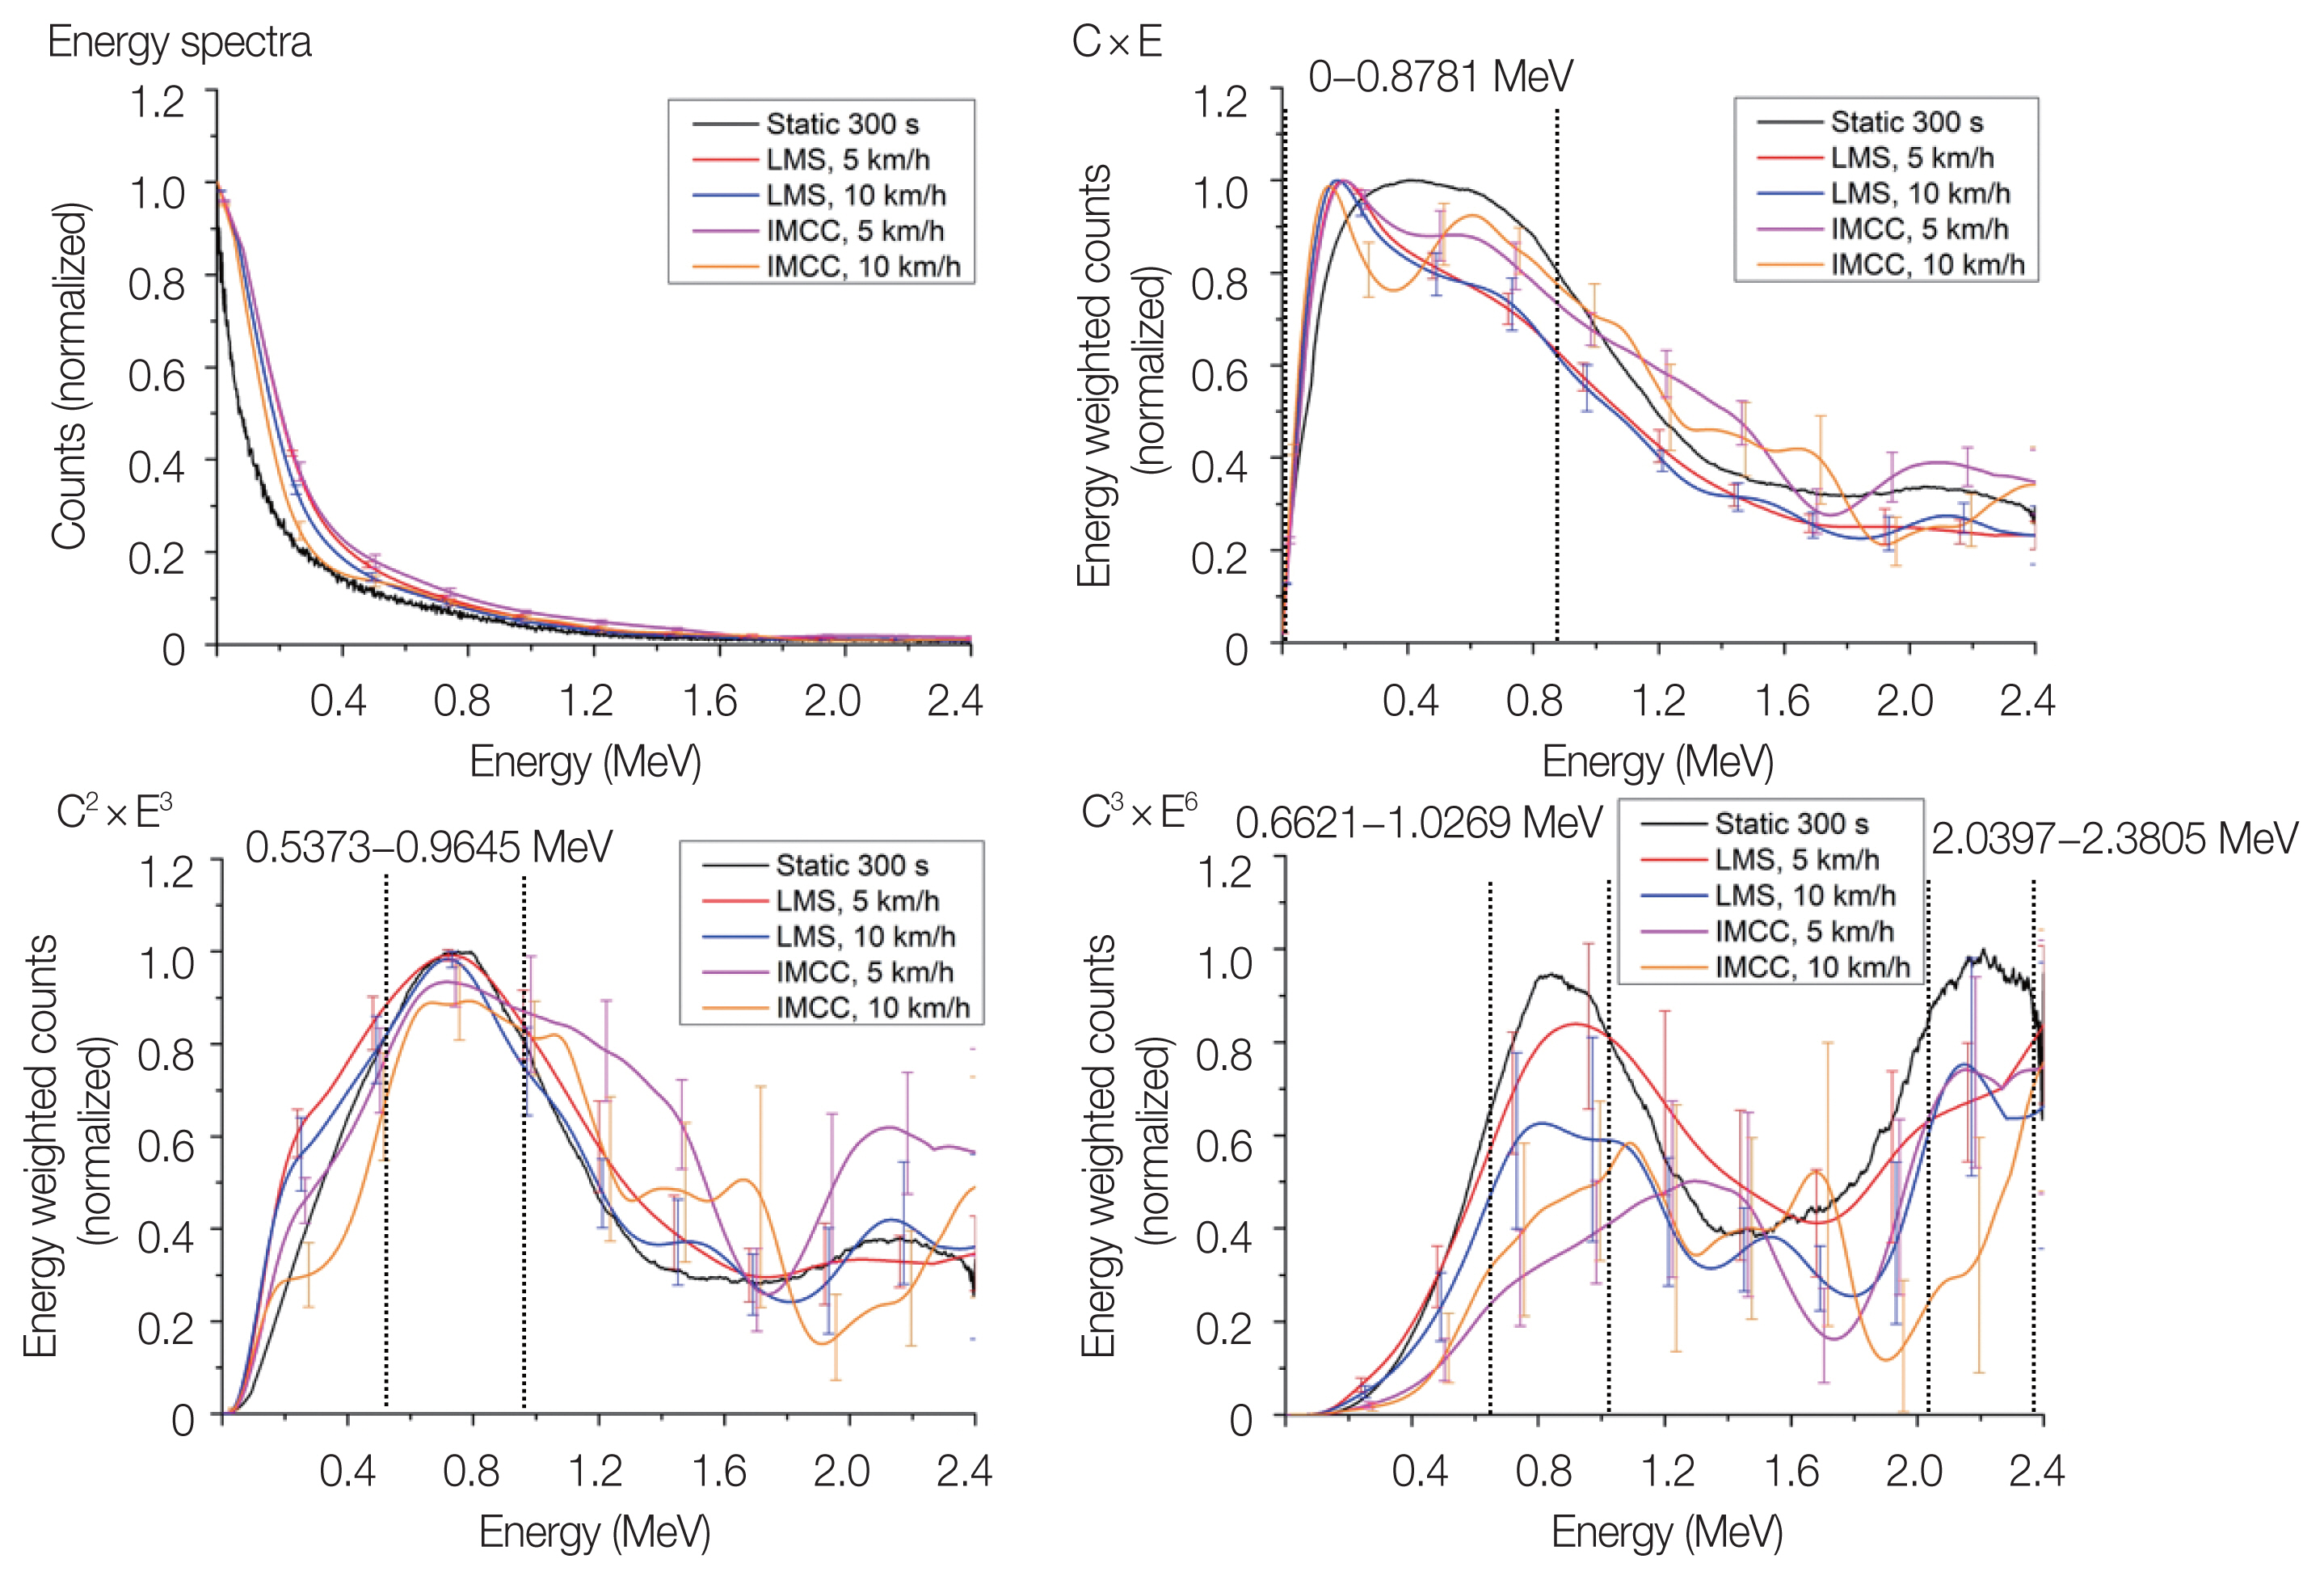
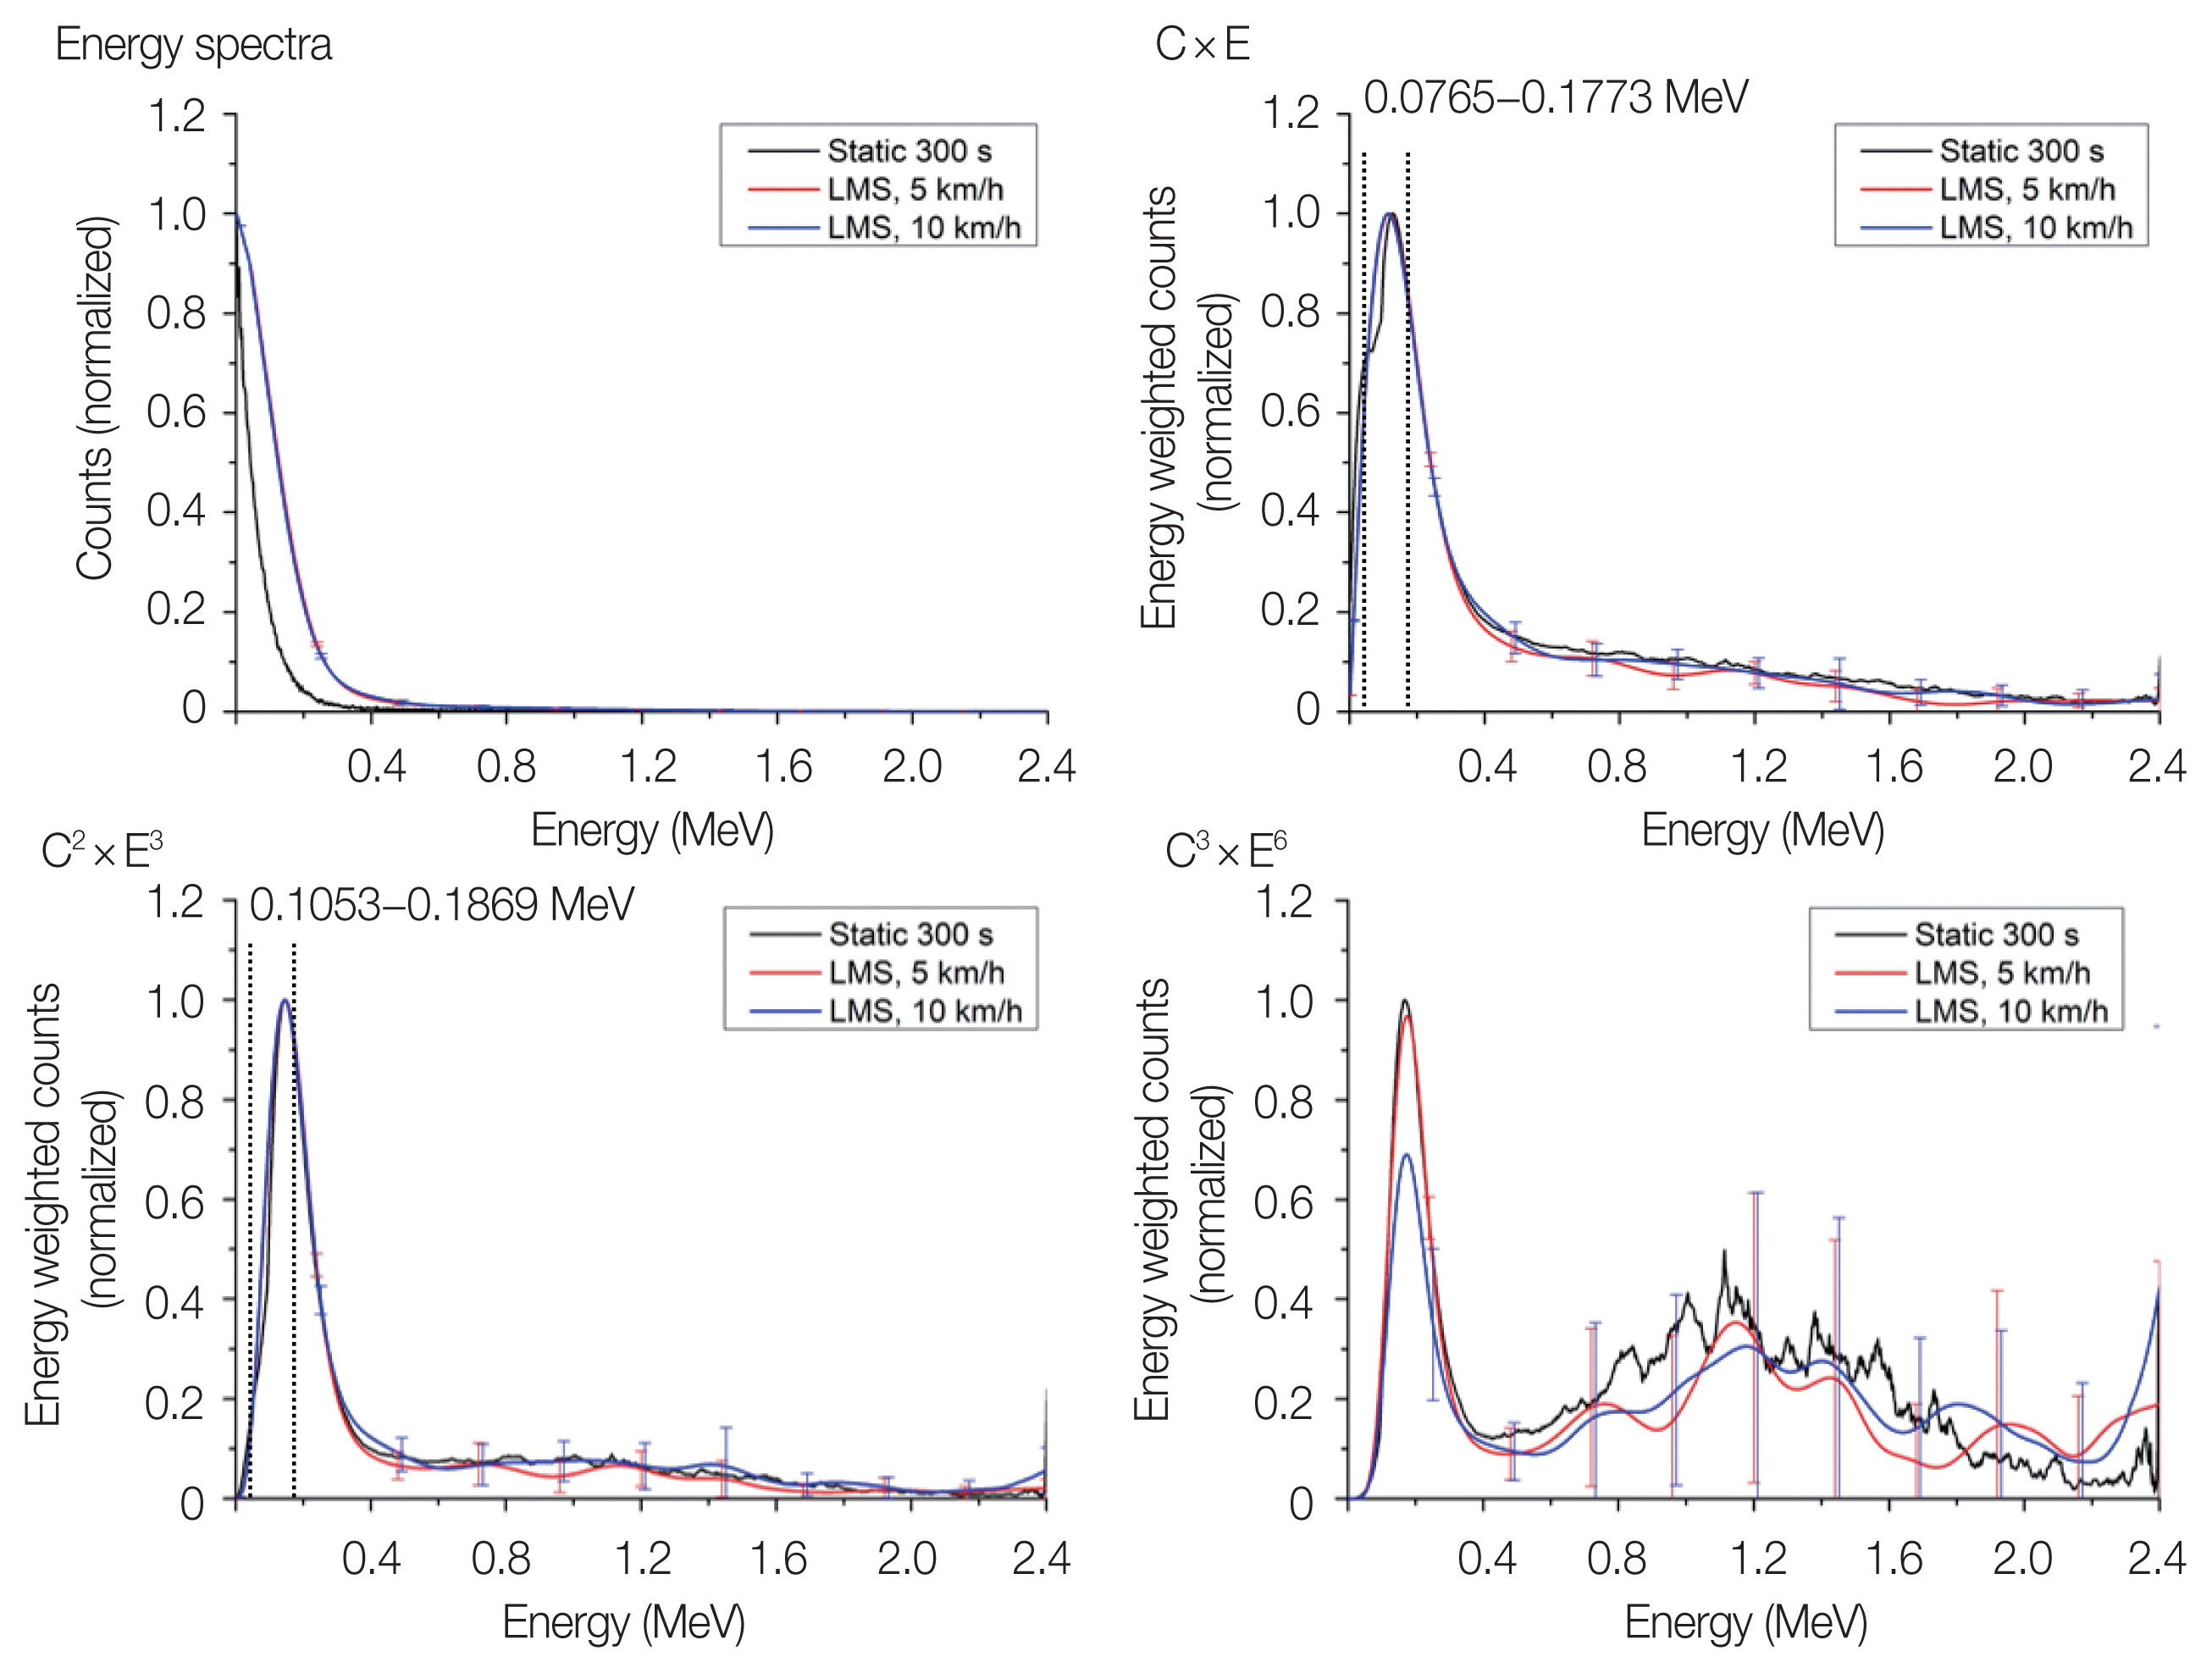
In case of 137Cs having a Compton edge at 0.477 MeV theoretically, it was already observed that the peak of the energy-weighted spectrum that originated from the Compton maximum was a feature for nuclide identification in previous studies. Similarly, 60Co having a clear Compton maximum of the energy spectrum at 1.041 MeV also exhibited a discernable peak in the energy-weighted spectrum [8–11]. Figs. 8 and 9 depict energy spectra and three types of energy-weighted spectra of 137Cs and 60Co based on the speed of the moving source. The black solid lines in Figs. 8 and 9 are spectra measured under static conditions for 300 seconds, and there are no expanding distributions except the peak areas, although there were increased weighting levels. Although the source speed and spectral fluctuation were increased, the peak locations of the colored lines were detected in the designated energy range, represented as dotted lines.
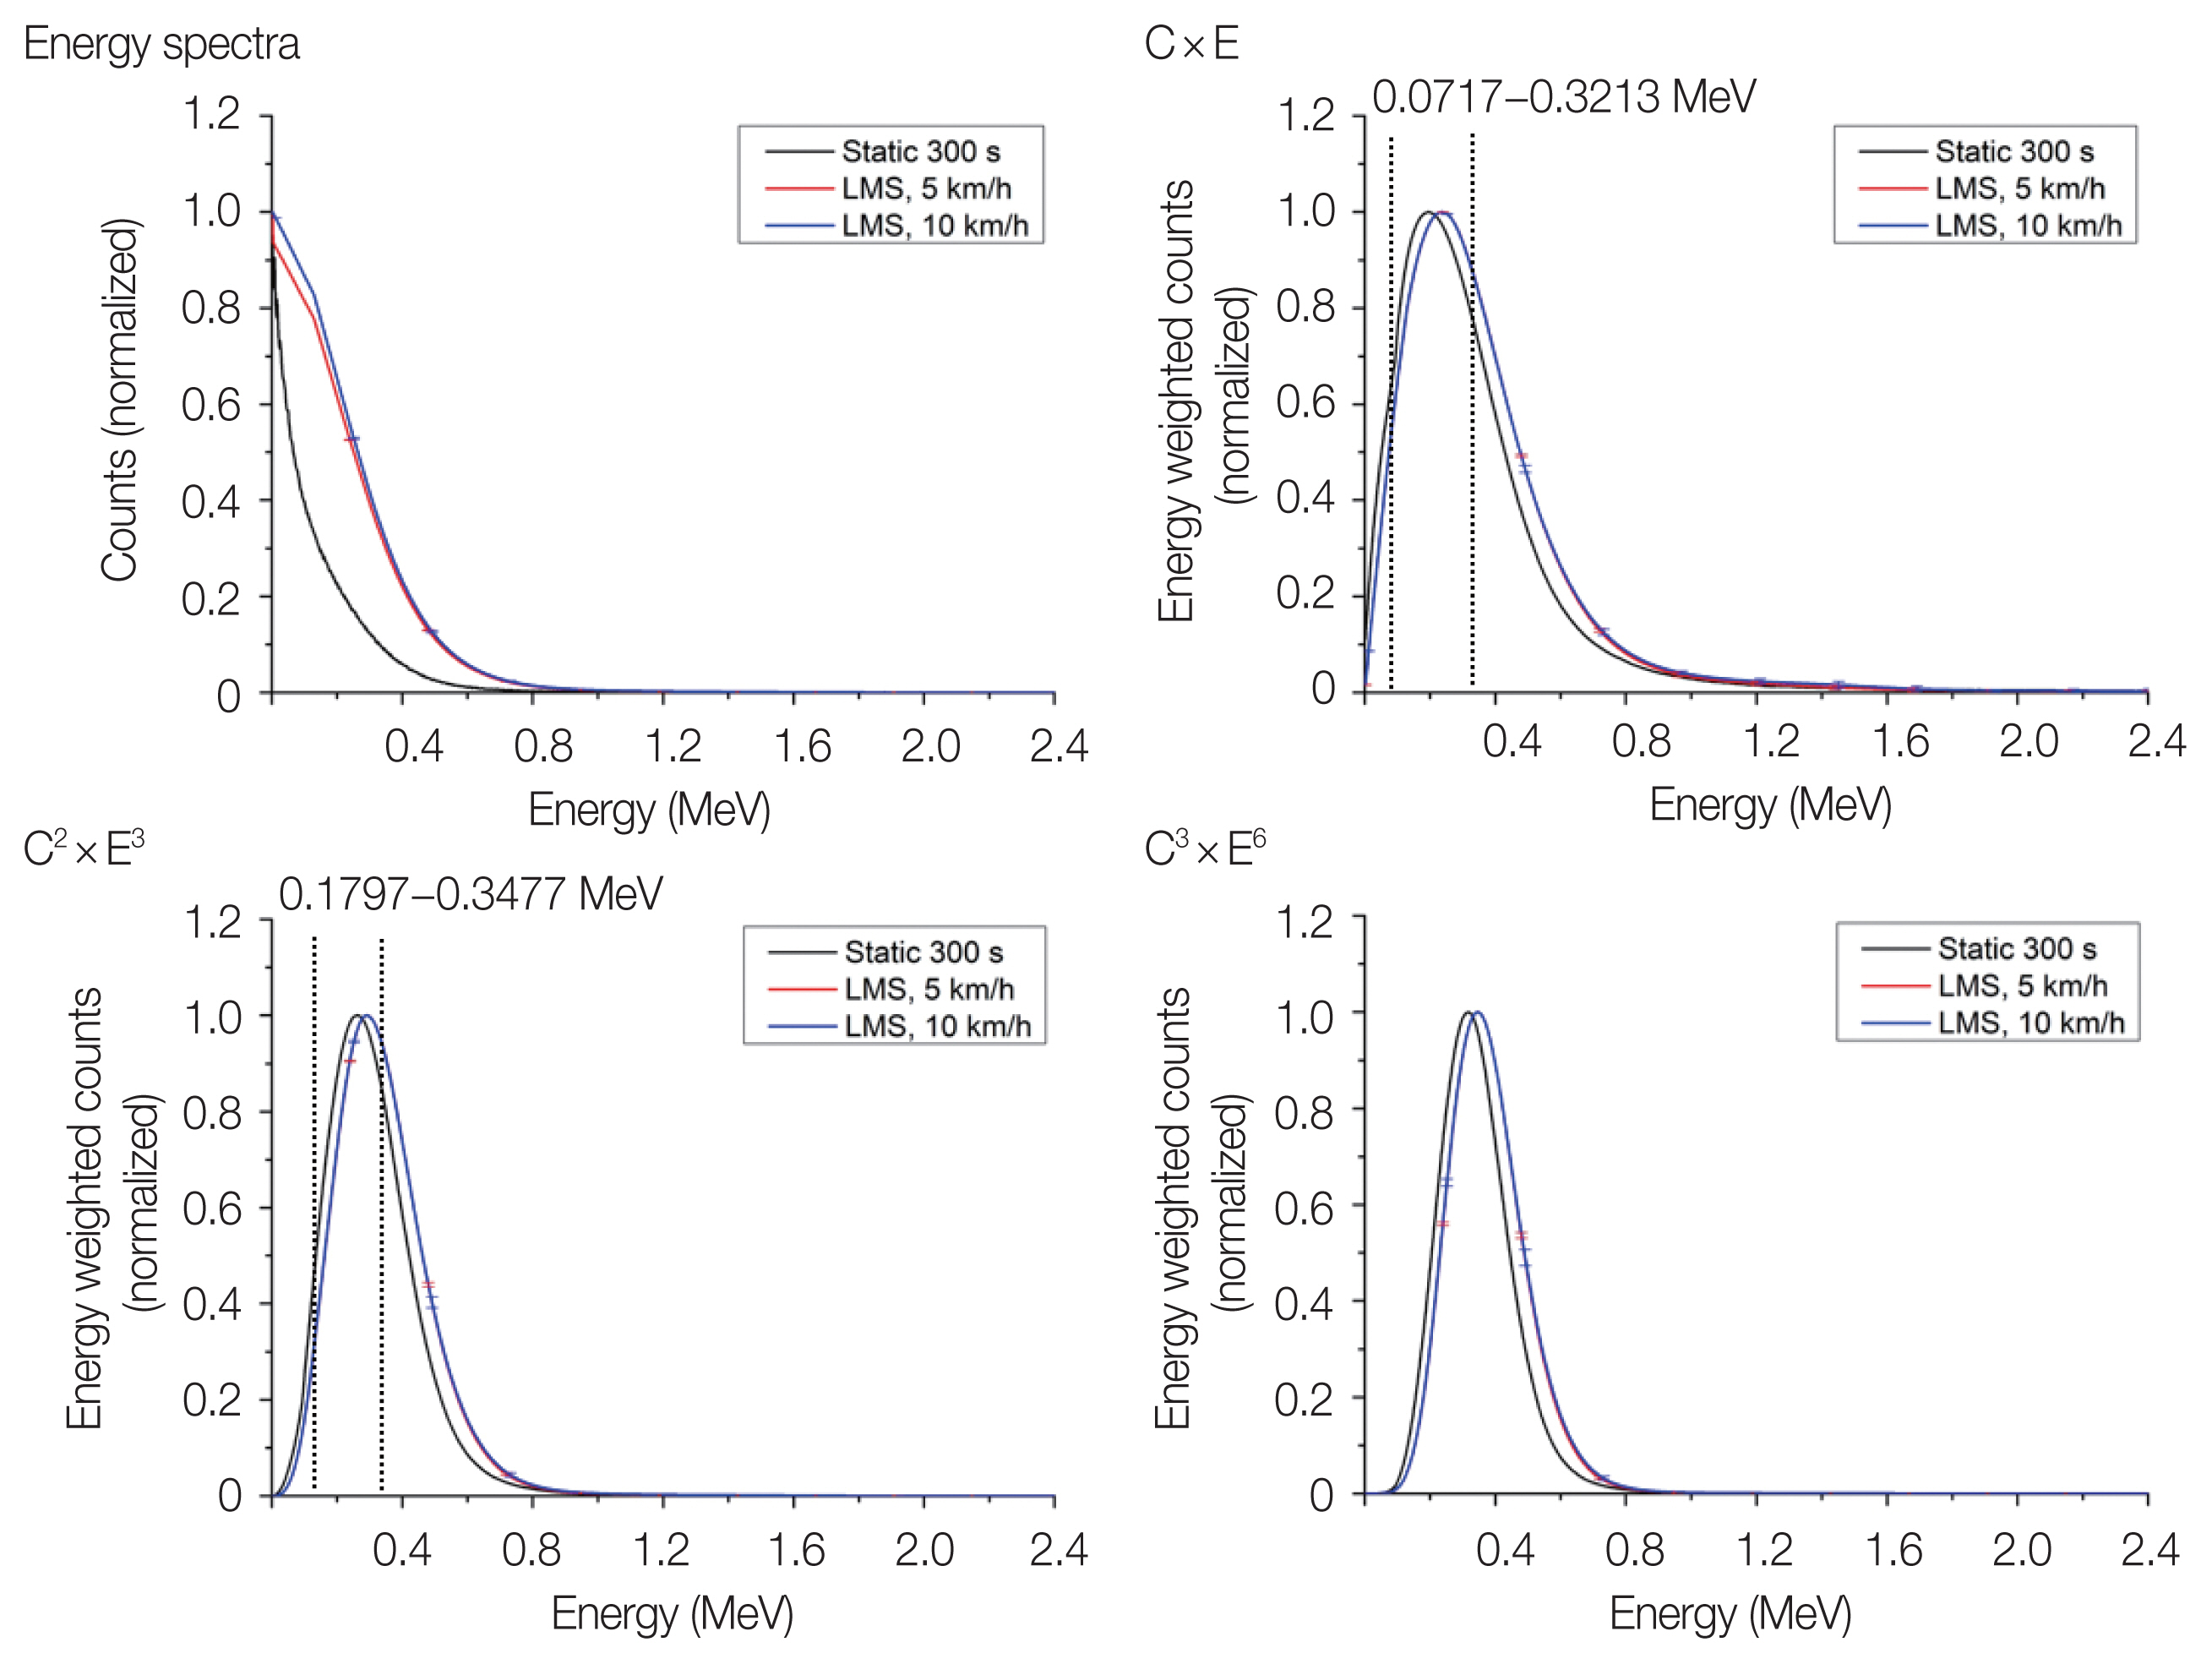
On the other hand, as depicted in Fig. 10, 226Ra is a natural radioactive nuclide and its daughter products emit gamma rays in various energy lines. In the Ci × Ei energy-weighted spectrum, the measured counts were highest up to 0.2 MeV and decreased after that. As the weighting factor was increased, the counts within 0.8–1.2 MeV increased, which led to a change in the peak detection area in the
232Th is also a natural radioactive nuclide and exhibits wide count distribution until 0.8 MeV in the Ci × Ei energy-weighted spectrum as shown in Fig. 11, where the peak detection area is similar with 226Ra. However, in the
In the RPM inspection site, 40K, which has a Compton edge at 1.243 MeV, gives off a false alarm by being perceived as 60Co, whose theoretical Compton edge is at 1.041 MeV. Even when the energy-weighting method was applied, the peaks were misidentified because the peak detection areas were similar to those of 60Co, as depicted in Fig. 12. Therefore, an additional algorithmic step comparing the count ratios of 0.9573–1.3781 MeV and 0.9573–1.1677 MeV in the
The energy spectrum of depleted uranium (DU) having 235U enrichment under 0.72% exhibits relatively high counts under 0.2 MeV and decreases rapidly after that, as presented in Fig. 13. In the three types of energy-weighted spectra, similar distributions are observed with 232Th except in the energy range over 2 MeV in the
2. Source Identification TestThe 137Cs and 60Co recommended sources [12] were completely identified at both the speeds of 5 and 10 km/hr implemented by LMS, as presented in Table 2. Further, 232Th, which exhibited high spectral fluctuation, was successfully identified by comparison, as 226Ra was discriminated up to 90% at a speed of 5 km/hr. The SNMs that must trigger an RPM alarm were identified up to over 80% at speeds of both 5 and 10 km/hr although they were misidentified as natural sources in some cases. In addition, at a speed of 10 km/hr, the energy-weighted spectra of 232Th, 226Ra, and DU were evaluated erroneously as similar spectra because their relative geometrical efficiencies decreased.
In the case of the test conducted with the IMCC, most cases were misidentified, except 137Cs of 58.25 μCi and 60Co of 27.9 μCi at 5 km/hr, which were discriminated successfully even at 10 km/hr. In the energy-weighted spectra of misidentified sources, relatively high fluctuations were observed, which was attributed to the structure of the container where was surrounded with steel plate which can shield radiation. The sources were placed at the bottom portion of the truck, and their heights from the ground were the same as the centers of the PVT panels. Further, it was also inferred that the radiation scattering increased because of the under-structure of the truck.
The 40K volume source, however, was identified up to 58.3% at speeds of both 5 and 10 km/hr. Unlike the other sources, the Compton maxima of 60Co and 40K were observed in the 1–1.3 MeV region in the energy spectra. It is possible to discriminate between the two nuclides by comparing the count ratio between the designated peak detection regions of the energy-weighted spectra. Although more spectral data is required, it is expected that the high false alarm rate owing to the 40K source can be reduced by applying the energy-weighting method at the primary inspection site.
ConclusionIn this study, the energy spectra of eight radioactive sources set in motion by an LMS and IMCC were measured using a commercialized RPM system; the energy-weighted algorithm was applied to evaluate the identification of the radioactive sources. Further, the variety of spectral characteristics for each source was observed by changing the intensity of energy-weighting, as the energy-weighted algorithm proposed in the previous study did not identify the spectral characteristics sufficiently.
The peak detection areas based on the intensity of energy weighting were organically combined for source identification. Further, count ratios in specific energy regions were compared with respect to similar spectral distribution. This method derived a relatively high identification rate for the eight sources set in motion by the LMS. In particular, 137Cs, 60Co, and SNMs were successfully identified up to 80% even at a speed of 10 km/hr. The algorithm proposed in this study was also able to discriminate between 60Co and 40K, which triggers false alarms at primary RPM inspections.
Although the majority of cases set in motion by container trucks were identified at a lower rate than expected, it is estimated that the algorithm can be improved through additional studies with respect to the evaluation of the energy-weighted spectrum according to the source locations in the container.
AcknowledgementsThis research was supported by the Basic Science Research Program through the National Research Foundation of Korea (NRF), which is funded by the Ministry of Science, ICT & Future Planning (No. 2020R1A2C2011576), and by the Nuclear Safety Research Program through the Korea Foundation Of Nuclear Safety (KoFONS) using the financial resource granted by the Nuclear Safety and Security Commission (NSSC) of the Republic of Korea (No. 1803027).
NotesAuthor Contribution Conceptualization: Kim HS. Data curation: Lee HC, Koo BT. Funding acquisition: Kim HS, Min CH. Methodology: Lee HC. Project administration: Park CS, Kwon J. Writing - original draft: Lee HC. Writing - review & editing: Min CH. Investigation: Lee HC, Choi CI. Resources: Choi CI. Supervision: Min CH. Validation: Chung H. References1. Siciliano ER, Ely JH, Kouzes RT, Milbrath BD, Schweppe JE, Stromswold DC. Comparison of PVT and NaI (Tl) scintillators for vehicle portal monitor applications. Nucl Instrum Methods Phys Res A. 2005;550:647-674.
2. Geelhood BD, Ely JH, Hansen RR, Kouzes RT, Schweppe JE, Warner RA. Overview of portal monitoring at border crossings. Proceedings of 2003 IEEE Nuclear Science Symposium. Conference Record (IEEE Cat. No. 03CH37515). 2003 Oct 19–25. Portland, OR. 513-517.
3. Ely J, Kouzes R, Schweppe J, Siciliano E, Strachan D, Weier D. The use of energy windowing to discriminate SNM from NORM in radiation portal monitors. Nucl Instrum Methods Phys Res A. 2006;560:373-387.
4. Stromswold DC, Darkoch JW, Ely JH, Hansen RR, Kouzes RT, Milbrath BD, et al. Field tests of a NaI(Tl)-based vehicle portal monitor at border crossings. Proceedings of the IEEE Symposium Conference Record Nuclear Science. 2004 Oct 16–22. Rome, Italy. 196-200.
5. Keyser RM, Sergent F, Twomey TR, Upp DL. Minimum detectable activity estimates for a germanium-detector based spectroscopic portal monitor. Proceedings of the INMM 47th Annual Meeting Conference. 2006 Jul 16–20. Nashville, TN.
6. Kangas LJ, Keller PE, Siciliano ER, Kouzes RT, Ely JH. The use of artificial neural networks in PVT-based radiation portal monitors. Nucl Instrum Methods Phys Res A. 2008;587:398-412.
7. Jordan DV, Geelhood BD, Reeder PL, Stephens DL, Craig RA, McIntyre JI. Progress Report on the Advanced Large-Area Plastic Scintillators (ALPS) Project (No. PNNL-14283). Richland, WA, Pacific Northwest National Lab. 2003.
8. Shin WG, Lee HC, Choi CI, Park CS, Kim HS, Min CH. A Monte Carlo study of an energy-weighted algorithm for radionuclide analysis with a plastic scintillation detector. Appl Radiat Isot. 2015;101:53-59.
9. Lee HC, Shin WG, Park HJ, Yoo DH, Choi CI, Park CS, et al. Validation of energy-weighted algorithm for radiation portal monitor using plastic scintillator. Appl Radiat Isot. 2016;107:160-164.
10. Lee HC, Shin WG, Choi HJ, Choi CI, Park CS, Kim HS, Min CH. Radioisotope identification using an energy-weighted algorithm with a proof-of-principle radiation portal monitor based on plastic scintillators. Appl Radiat Isot. 2020;156:109010.
11. Lee HC, Choi HJ, Koo BT, Choi CI, Park CS, Kim HS, et al. Dynamic radionuclide identification using energy weighted algorithm with commercialized radiation portal monitor based on plastic scintillators. Radiat Phys Chem. 2020;170:108645.
12. American National Standards Institute. American National Standard for Performance Criteria for Spectroscopy-Based Portal Monitors Used in Homeland Security. Washington, DC, American National Standards Institute. 2015;IEEE/ANSI N42.38-2015.
Fig. 2Distribution variety of energy-weighted spectra according to weight methods of (A) countn, (B) energyn, (C) (count×energy)n, (D) countn×energyn+1, and (E) countn+1×energyn. The energy spectrum of 212Bi was simulated by Geant4. 
Fig. 5Commercialized RPM system consisting of two plastic scintillation panels (A) used for spectrum measurement; in addition, in-house fabricated signal-processing boards (B) were connected to RPM system to divide and acquire signals obtained from PMTs (C). RPM, radiation portal monitor; PMT, photomultiplier tube; PVT, polyvinyltoluene; DAQ, data acquisition; MCU, microcontroller unit; MUX, multiplexer; FPGA, field programmable gate array. 
Fig. 6Energy-weighted spectrum-monitoring GUI based on LabVIEW program. Three energy-weighted algorithms, (A) count×energy, (B) count2×energy3, and (C) count3×energy6, were applied in this test GUI and source names were designated after peak detection result. GUI, graphical user interface. 
Fig. 8Energy spectra and three types of energy-weighted spectra (averaged value) of 137Cs of 17.4 μCi measured under static (black line) for 300 seconds and moving (colored lines) conditions at 5 and 10 km/hr by the linear motion system (LMS) and intermodal cargo container (IMCC). 
Fig. 9Energy spectra and three types of energy-weighted spectra (averaged value) of 60Co of 6.2 μCi measured under static (black line) for 300 seconds and moving (colored lines) conditions at 5 and 10 km/hr by the linear motion system (LMS) and intermodal cargo container (IMCC). 
Fig. 10Energy spectra and three types of energy-weighted spectra (averaged value) of 226Ra of 8.1 μCi measured under static (black line) for 300 seconds and moving (colored lines) conditions at 5 and 10 km/hr by the linear motion system (LMS) and intermodal cargo container (IMCC). 
Fig. 11Energy spectra and three types of energy-weighted spectra (averaged value) of 232Th of 13.6 μCi measured under static (black line) for 300 seconds and moving (colored lines) conditions at 5 and 10 km/hr by the linear motion system (LMS) and intermodal cargo container (IMCC). 
Fig. 12Energy spectra and three types of energy-weighted spectra (averaged value) of 40K measured under static (black line) for 300 seconds and moving (colored lines) conditions at 5 and 10 km/hr by the intermodal cargo container (IMCC). 
Fig. 13Energy spectra and three types of energy-weighted spectra (averaged value) of depleted uranium measured under static (black line) for 300 seconds and moving (colored lines) conditions at 5 and 10 km/hr by the linear motion system (LMS). 
Fig. 14Energy spectra and three types of energy-weighted spectra (averaged value) of highly enriched uranium measured under static (black line) for 300 seconds and moving (colored lines) conditions at 5 and 10 km/hr by the linear motion system (LMS). 
Fig. 15Energy spectra and three types of energy-weighted spectra (averaged value) of weapon-grade plutonium measured under static (black line) for 300 seconds and moving (colored lines) conditions at 5 and 10 km/hr by the linear motion system (LMS). 
Table 1Radioactive Sources Used for Energy-Weighted Spectrum Measurement in Static and Dynamic Conditions Table 2Dynamic Source Identification Result |
|
||||||||||||||||||||||||||||||||||||||||||