Introduction
A Maximum Hypothesis Accident (MHA) in the nuclear research reactor HANARO is the fuel damage by a flow channel blockage and the release of radioactive materials by the design leak rate of the reactor building. The design leak rate of the HANARO reactor building was confirmed by the pressure differential experiments in 1995. In these experiments, the positive pressure was derived by air supply to the building, and the pressure drop and duration were measured, and the leak rate was then calculated by the equation described in the document of American National Standards Institute (ANSI) [1]. The range of leak rate measured for 10 times in 1995 was 405–546 m3·hr−1 in the pressure differential 25 mmWG and 37–45 m3·hr−1 in the pressure differential 1.54 mmWG [2]. However, the positive pressure is not caused in the reactor building by a fuel channel blockage accident because the HANARO research reactor is operated at about 40°C in the pool temperature under normal air pressure and the loss of the reactor pool water does not occur in the MHA. Thus, only the pressure differential can be derived by the high wind outside of the building. According to the equation, the 25 mmWG pressure differential between the inner and outer walls can be derived by a 20 m·sec−1 wind speed in the outside of the building, the 1.54 mmWG pressure differential can be derived by a 5 m·sec−1 wind speed outside of the building. Thus, HANARO considered a design leak rate of 600 m3·hr−1 derived in the condition of maximum wind speed, 20 m·sec−1, observed in the Daejeon area where HANARO is located. But this application has some problems. The positive pressure in a building makes the air in the building flow into every direction for releasing to the outside of the building. This means the pressure differential between the inner and outer walls by positive pressure in a building influences every walls of the building. But the pressure differential by a high wind speed outside of the building affects only the parts of the building over the ground, and the air inside the building can be flowed through leak points over the ground of the building, and also positive or negative pressure in a wall can be changed because the wind direction will be changed. This means air can be flowed to the inside from the outside of the building or to the outside from the inside of the building by the change in wind direction. Based on the review mentioned above, the air leak rate of the HANARO building under a typhoon condition was reviewed using the MELCOR code by applying the methodology suggested by the United States Department of Energy [3].
Materials and Methods
1. MELCOR computer code input design
The MELCOR computer code was used to calculate the leak rate of the HANARO reactor building under typhoon conditions. The following points are considered for calculation.
First, the building structure, such as the section plans and side views in the design documents, was analyzed to make the MELCOR input file about the building structure. The MELCOR input file about the HANARO building structure, which is called the Control Volume, was designed as shown in Table 1 and Figure 1.
Second, the pressure differential effect due to wind was designed by using the following equation:
Where cp is pressure coefficient, ρ is local air density, v is wind speed.
The values of the pressure coefficient, which was used in the determination of HNANRO building design leak rate were chosen [2]. The values are as follows:
- Upwind pressure coefficient: 0.8
- Downwind pressure coefficient: −0.5
- Side and top pressure coefficient: −0.7
Third, the air flow paths such as penetration, access doors, and duct of the HVAC system of the building were analyzed. The determined flow path based on the building structure analysis is shown in Table 2. The ratio in the Table 2 shows the relative size of flow paths, and the size was calculated based on the design drawing of HANARO structure. This table shows that the truck access area is the major leak point.
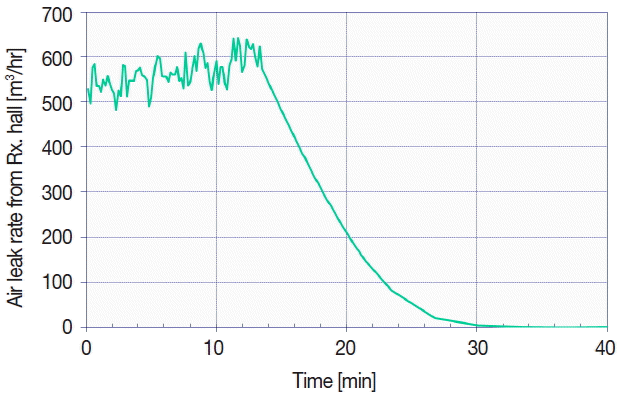
Fourth, the area of the flow path was defined. The leak rate under the condition of positive pressure in the reactor hall had been tested regularly. The leak rate in 25 mmWG positive pressure during reactor hall temperature 22°C was recently measured as about 486 m3·hr−1 by HANARO operating department.1) However, the design leak rate in 25 mmWG positive pressure was determined as 600 m3·hr−1. The determined flow path was adjusted to meet the design leak rate by using following equation and leak ratio.
The air leak rate in the 25 mmWG positive pressure in the reactor hall after the leak area correction was calculated as shown in Figure 2. The calculated results correspond to the design leak rate of the HANARO building.
Fifth, 1 kg noble gas and 1kg aerosol diffusion condition during 1 hour was applied to simulate an accident condition.
2. Design of typhoon condition
A typhoon passed through the Korean Peninsula two times in August of 2012. At that time, the wind speed and direction were measured at 10 m, 27 m, and 67 m heights of the meteorological tower at the Korea Atomic Energy Research Institute (KAERI) site. A momentary high wind speed more than 20 m·sec−1 at a 67 m height was measured 11 times on August 28 in 2012, and the average wind speed for 10 minutes at the time was about 15 m·sec−1. Even though the high wind was not sustained for enough time, the metrological data measured on August 2012 reflects the actual high wind speed condition by typhoon at KAERI site. The wind speed, 20 m·sec−1, was the wind condition considered to calculate the design leak rate in the HANARO building.
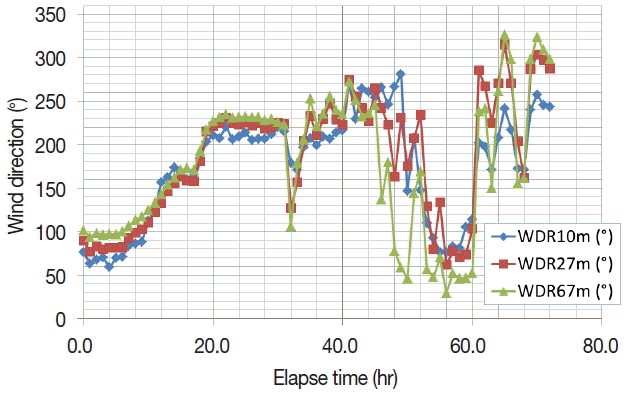
Also the wind direction is a very important factor from the point of view of negative pressure occurring at outside of the building by a high wind speed. The wind direction observed in 2012 is shown in Figure 3.
The MELCOR input file to apply the typhoon condition in 2012 was generated using Equation 1. The wind speed and direction for the MELCOR calculation were as shown in Table 3.
Results and Discussion
1. Radioactive material leak rate under typhoon conditions
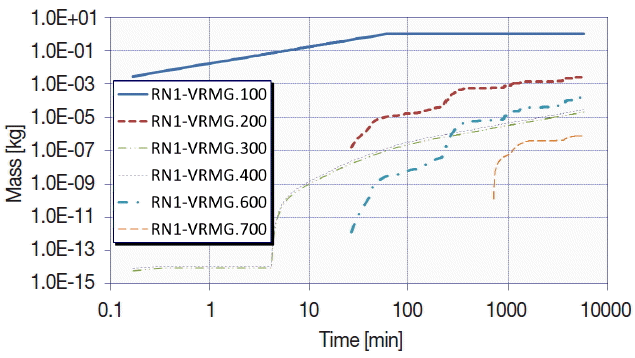
The change of noble gas distribution by a typhoon after an accident in each Control Volume was analyzed, and the results are described in Figure 4. In this figure, the RN1-VRMG.100 means the amount of noble gas in Control Volume 100 which is the reactor hall and RN1-VRMG. 600, 700, 900 mean the amounts of noble gas in a Control Volume of 600, 700, 900 respectively. The Control Volumes of 600, 700, and 900 mean the outside of the building. The calculation results show that most of the noble gas remained in the reactor hall and some noble gas was released to the outside of the building. The total amount of noble gas released to the environment for 4 days was 1.559722×10⁻⁴ kg, and it can be changed to 1.5597×10⁻²%·4 days−1 or 0.004%·day−1 leak rate.
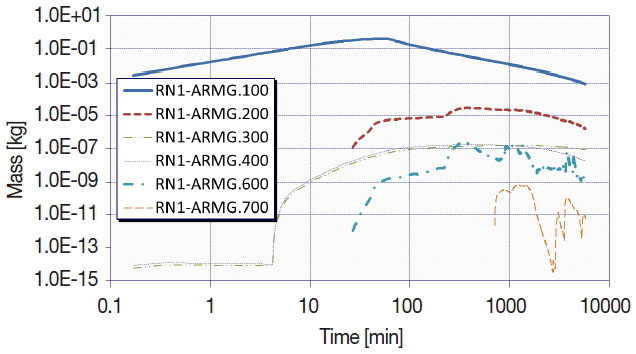
The changes of aerosol distribution in each Control Volume in air is shown in Figure 5 and on the floor of reactor hall and outside are shown in Figure 6. The amount of aerosol in the reactor hall was calculated as 0.9064003 kg that is 90.64%. The total amount of aerosol released into the environment for 4 days was 1.474×10⁻⁴%, and it can be converted to 3.7×10⁻⁵%·day−1. Almost all of the noble gases and aerosols will remain in the reactor hall in case of fuel damage by a channel blockage accident because the accident does not make a high pressure in the HANARO reactor hall.
2. Air leak rate in typhoon condition
Even though there is a typhoon in the outside of the building, air in the reactor hall does not flow to only one direction after the HVAC system shutdown. The typhoon makes the wind direction change while passing an area because the typhoon rotates. Thus, the typhoon creates a positive pressure differential or negative pressure differential against one side of a building in one area while passing. The simulated result of the air flow in the HANARO building while the typhoon passed in August 2012 is shown in Figure 7. The total air amount flowing into the reactor hall for 4 days was 76.2 m3, and the air amount leaked into the environment during 4 days was 130.79 m3. The air leak rate was 0.376%·4 days−1, it can be converted into 0.094%·day−1. Thus, the air leak rate of the HANARO building can be defined as 0.1%·day−1 for the typhoon condition.
Conclusion
The leak characteristic under typhoon conditions was simulated using the MELCOR computer code. The leaked air amount was 0.4%·4 days−1 of the reactor hall volume, and the leaked noble gas amount was 0.016%·4 days−1 of the total noble gas in the reactor hall, and the leaked aerosol amount was 1.47×10⁻⁴%·4 days−1 of the total aerosol in the reactor hall. The design air leak rate considered in the safety analysis reports was 600 m3·hr−1 under a 20 m·sec−1 wind speed condition, which can derive 25 mmWG pressure deferential between each sides of a wall, in the outside of the building and also the air leak rate recently measured in 25 mmWG positive pressure in reactor hall was about 486 m3·hr−1, but the simulated air leak rate in a real typhoon condition was 0.1%·day−1, which means 1.36 m3·hr−1. It shows that there was some misunderstanding in the assume of safety analysis, that is, first, the positive pressure inside building cannot be continued more than several minutes because air leak will make a negative pressure inside a building, second, the wind outside a building has a direction, it means that air will flow to outside or inside of a building depending on the geometrical structure of the building.
It can be found from this simulation that the design air leak rate is too high compared to the simulated result. If the leak rate is less than past consideration, the emergency preparedness should be changed. The direct radiation from the reactor hall will be more important detriment in emergency preparedness because almost all of the radioactive materials will be in the space of the reactor hall after releasing from reactor core to reactor hall because of low leak rate.


