

Introduction
Wide range of gamma spectrometric applications is performed using broad beam geometries. In-situ gamma ray spectrometry was used to estimate the deposition of different radionuclides on the ground and quantitatively determined the total deposition per unit area (Bq┬ĘmŌłÆ2). The peak to valley ratios for 137Cs in air were studied for incident angles between 0 and 90┬░. It was stated that the peak to valley ratios at three size detectors are of similar values. It was concluded that the peak to Compton ratio can differentiate between surface and shallow depth sources within a field of radius 3.5 m [1]. A method was introduced to estimate the penetration characteristics of the fall out radioactivity by using spectral information obtained from in-situ spectrometric measurements [2]. Additionally, the variability of the different parts of the spectrum are usually of attention for scientists in the field of ╬│-ray spectrometry, it is a durable topic along decades. The peak to total PtT, peak to valley, PtV and peak to Compton, PtC ratios besides the mass attenuation coefficients (╬╝
/
Žü) and the resolution are main parameters to evaluate the performance and reliability of ╬│-detectors. In this respect, build-up of gamma intensity due to Compton scattering is covered in many references [1ŌĆō7]. The PtT, PtV and PtC ratios provide origins to report how much the detector is efficient and accurate. These ratios directly express the intensities of the Compton continuum at the angles corresponding to the selected regions of interest. Consequently, qualitative and quantitative material analysis and radiation detection besides other applications of radiation are correlated with the set-up efficiency. Many researchers deal with the determination of the depth distribution of the contamination by radionuclides in soil impinges on the follow up of Compton continuum as well as primary and forward scattering of photons. The efficiency and the resolution are combined with the detector status parameters, moreover the accuracy of the measurement very much depends on these parameters of the detector and on the stability of the attached electronics [3]. A theoretical formalism is developed in which the path difference between the broad and parallel beams in three-dimensional case is taken into consideration for the attenuation of ╬│-radiation on transmitting through cellulose triacetate and aluminum targets of different areas [4]. Additionally, the curvatures of the plots were derived mathematically and calculated [5]. The forward scattering of the environmental radioactivity spectrum was used to estimate the mean mass depth of the vertical activity distribution within sediment profiles besides providing corrections for the distribution of radioactivity [6]. It was concluded that the PtT ratios depend on the source-detector distances, in other words on the geometrical arrangement. The highest PtT ratios were obtained from collimated beam arrangement, because in this geometry the path of the onefold-Compton scattered quanta is longer and hence the probability of further collisions in the crystal leading finally to total absorption of the quantum-energies is greater than other broad beam geometries. The possibility of using the Compton parts of the 137Cs and 60Co spectra to determine the thickness of shielding materials was applied and software for this task was written [7]. It was reported that the data from HPGe and NaI(Tl) verify the aim of work. Recently a ╬│-ray spectrometer with Si(Li) detector, was employed to measure the (╬╝
/
Žü) and Z
eff
, electron density and B for some compounds in the energy range 32.19 to 59.54 keV [8]. The mass attenuation coefficient (╬╝
/
Žü), Z
eff
and the build-up factor B have been calculated by different methods, and the obtained values have been compared with each other. It was observed that B increases as the collimator diameter is increased in the studied energy range. The PtT and PtC ratios were extensively dealt with in the frame work of specifications and performance of Compton suppression spectrometer using HPGe and NaI(Tl) detectors, the spectrometer was applied in a chemistry study [9]. In [10] (╬╝
/
Žü), Z
eff
and electron density were determined for some building materials according to the chemical composition, possible conclusions were drawn with respect to the variations in photon energy and chemical composition. In [11] a 3ŌĆ│├Ś3ŌĆ│ NaI(Tl) detector was placed in the air or water above a formation (rock or soil), for the emission, transport, and detection of the natural gamma radiation from the formation. It is shown that the rate of detection scattered is given by the product of the scaler number flux and the average angular counting cross section for the scintillation crystal. In [12] the authors measured B for 0.662 MeV gamma rays in the extended media of Bakelite and Perspex under different collimator conditions, it was concluded that for fixed solid angle (collimated size) there is a minimum thickness for which B remains unity, after this thickness B begins to increase. The minimum thickness of build-up equal one prevents multiple scattering from reaching the detector. With the increase in the solid angle, the absorber thickness, up to which B is unity, decreases. This means that there is a correlation between the absorber thickness and the collimator size for the determination of B.
In this work, the aim is directed towards the investigation of the ╬│-ray spectra at the energies 0.662 from 137Cs and 1.25, 1.33 MeV from 60Co after attenuation by the fundamental materials water, soil, sand and cement. The spectra were analyzed using a 3ŌĆ│├Ś3ŌĆ│ NaI(Tl) detector. The ratios of the photo peak to specified parts in the spectra were measured. These parts are the total area under the photo peak, the area of a selected region in the Compton valley and the area of a selected region below the Compton edge. The ratios are indicated as PtT, PtV and PtC respectively. Broad beam mass attenuation coefficients (╬╝
b/
Žü) and detector resolution were measured and commented on in conjunction with B.
Theoretical
The Lambert-Beer law for attenuation by narrow beam can only be applied if three conditions are verified:
For collimated beam geometry, the attenuation of radiation can be expressed as follows.
I
c
and I
0
c
are the intensities with and without material and (╬╝
/
Žü) is the theoretical mass attenuation coefficient. The differences in attenuation by air in the three arrangements are to be neglected. In broad beam geometry the radiation is attenuated (absorbed and scattered) by the material besides air (in the source-material-detector spacings) under the condition:
The radiation beam is opened to the angle ╬®.
It interacts with the material and air in different manners according to Figure 1.
What is measured is the peak areas I
0 and I, respectively, without and with the materials and are employed to calculate ╬╝
b/
Žü under the relevant experimental circumstances according to the relation,
In one hand, B relates the collimated and broad beam intensities. On the other hand, B relates broad and narrow (theoretical) mass attenuation coefficients as follows,
B must beŌēź1.
The angular distribution of the Compton scattered ╬│-rays is described by Klein-Nishina formula for the differential cross-section dŽā/d╬® as follows,
Where Z is the atomic number, r0 is the classical electron radius and ╬Ė is the scattering angle ╬▒=hv/m
0
c
2. According to this Equation, maximum differential cross sections occurs at minimum scattering angles and maximum photon energies.
Materials and Methods
To cover a wide range of currently used experimental arrangements, detector performance parameters, environmental materials and ╬│-ray energies, three experimental arrangements were chosen as well as the four materials; water, soil (from river Nile province), sand (from desert near Cairo) and Portland cement, were used to measure and analyze the ratios PtT, PtV and PtC, besides the attenuation coefficients. The materials are packed in plastic containers of dimensions 14├Ś19├Ś18 cm3 and in stepwise procedure the attenuation process was measured at the three positions as shown in experimental set-up Figure 1. In the arrangement I the material, with thickness 14 cm, is put directly on the source shield. In the arrangement II the material container is located 16-cm wide from the source shield and 14-cm from the detector face. In the arrangement III, the material is located on the detector face. The solid angles ╬® subtended between the source and the mid plane of the material and facing the detector for the arrangement I=7├Ś10ŌłÆ4 and for the arrangements II and III=2.2├Ś10ŌłÆ2. The sizes of the active cone (cone tractors) of the materials based on the experimental geometries are respectively 7.2, 142.3, and 448.39 cm3. Each one of the samples was located at the three different positions. The procedure was, (i) Comparing the full energy peak area to other nominated regions of the spectrum, namely the region of the total area (peak+back ground), to the Compton valley and to a defined plateau in the Compton region, (ii) Definition and measurement of mass attenuation coefficient belonging to the present experimental arrangements and the effect of B, (iii) Follow up of the detector resolution. According to Klein-Nishina formula the probability of Compton scattering is proportional to the number of electrons in the material, i.e. Z
eff
. The differential scattering cross section for 1-MeV photons does not change appreciably in the angular region 30┬░ŌĆō50┬░. Sources 137Cs and 60Co of activities about 580 ╬╝Ci and 180 ╬╝Ci respectively were used in this work. The number of counts in the photo peak was usually more than 105 counts which yields relative error less than 0.3%. The spectrometer consists of a 3ŌĆ│├Ś3ŌĆ│ NaI(Tl) detector attached to a 1,024 channel analyzer with built-in high voltage supply and amplifier.
The time of accumulation was 550 s for 60Co and 100 s for 137Cs measurements. Background spectrum was registered at the beginning and repeated frequently throughout the measurements. The fine and coarse gain are respectively 2 and 1.58. The high voltage applied is 1,000 V. The conversion gain used is 1,024 channels. The source-detector position was aligned with the aid of laser beam since a slight variation in the source detector alignment can change the sensitive ratio between the absorbed and scattered photons. The resolution ranged between 7.34 and 7.6% for the energy 0.662 MeV and between 5.25 and 5.57% for the energy 1.33 MeV. The Compton edge for 137Cs and 60Co is respectively 0.478 and 1.12 MeV. The choice of the energy window can be arbitrary to some extent, it was guided by the criteria that the number of counts in the channels around the region of interest is almost constant and the width is comparable with photo peak width. In case of cement and sand (Z
eff
)=14 and 11.62 respectively [13]. The peak centroid was shifted 2ŌĆō3 channels to larger values because of the forward single scattering. This effect has been taken into consideration by choosing region of interest ROI (an energy window range) that covers all the peak limits. A sensible strategy was followed according to what proportion to the total peak area one wishes to measure and set the limits accordingly. This algorithm doesnŌĆÖt impose any assumption on the peak shape, for a good set-up system such an assumption is not unreasonable. The PtT is the ratio of the net area in the photo peak to the total area in the total (peak+ background) in the same region. The PtV ratio is the ratio of the net area in the photo peak to the area under ROI in the Compton valley, which in turn, lies below the lower energy limit of the photo peak. The PtC ratio is the ratio of the net area in the photo peak to the area under ROI in the Compton plateau, which in-turn lies below the lower energy limit of the Compton edge. The peak areas of 1.33 MeV were multiplied by the ratio (ROI)1.25/(ROI)1.33 to normalize PtV and PtC at the two energies. The energies and scattering angles corresponding to ROI are listed in Table 1.
The conical space covered by the radiation in the material for the different geometries I, II and III is respectively, 6.19, 35.66, and 174.4 cm3. The densities for water, soil, cement and sand are respectively, 1, 1.32, 1.44, and 1.74 g┬ĘcmŌłÆ3. As applied in [7] the ROI for 1.25 MeV is the region including the cascade 1.173 and 1.33 MeV. The Compton region is respectively about 0.11 and 0.46 MeV below the Compton edge for 137Cs and 60Co. The ROI in PtT corresponds to forward scattering in the attenuator, which is likely occur as one-fold. The PtV and PtC ratios correspond to scattering at larger angles given in Table 1. The attenuation coefficient of air column lies between 0.0771 and 0.054 cm2┬ĘgŌłÆ1 for this interval of energies. Knowing that the density of air is 1.205├Ś10ŌłÆ3 g┬ĘcmŌłÆ3 [14] the linear attenuation coefficient ╬╝ is small, but it is worth to be taken into consideration. The ratios were measured with considering equal attenuation by air between the source and detector (back ground) for the three arrangements.
Results and Discussion
1. The peak ratios as function of effective atomic numbers
At the root of the spectrum analysis, is the decision of the interest region of the peak to be analyzed. For the energy 0.662 MeV the major interaction processes are the Compton scattering and the atomic photo electric absorption. The Compton scattering normally accompanies the photo electric effect and/or the pair production. The cross section does not depend upon properties of the materials, but only upon the average electron density. The Compton continuum increases with Z
eff
so that the peak ratios are substantially decreased gradually with increase in Z
eff
. The 1.25 peak represents the 1.173 and 1.33 MeV cascade. At these two energies the photoelectric effect is presumably less contributive, additionally, the nuclear field pair production is included. While the photo electric effect is proportional to Z
n
/E
╬│
3.5, n=4ŌĆō5, the Compton interaction is proportional to Z and the pair production is proportional to Z
2
f (E
╬│, Z). However, it is worth to recall that the ratio of pair production to Compton coefficients ╬║/Žā is <1.36├Ś10ŌłÆ4 for calcium (Z=20) at 1.25 MeV [14]. The ratio of incoherent cross section to the total cross section for aluminum at the energies 0.662, 1.25, and 1.33 MeV is respectively, 0.9947, 0.9980, and 0.9980 [14]. In this context, it is assumed that the photon interactions with air atoms play a limited role, but it has been taken into consideration. With regards to the solid angles and the active volumes given above, the arrangement I is of smallest Compton continuum and correspondingly, largest peak ratios, while II indicates to higher continuum. The arrangement III is characterized by most enhanced Compton continuum. The loss of energy by multiply scattered photons (Compton effect) and by Bremsstrahlung emission and leakage of photons produced from positron annihilation (generated by pair production) from the detector crystal is minimum in III. According to Table 2 below [13] aluminum (Z=13) is comparable to soil and cement. These circumstances combine common arguments of the discussion, and the complexity of the situation where multiple parameters that play important roles infuse in B. The peak to total ratios PtT as function of Z
eff
for all attenuators and energies at the three arrangements are illustrated in Figure 2A. It is seen that the number of counts: (i) Falls off gradually with increasing Z
eff
, (ii) Is inversely proportional to the source-material distance, in other words, the source- material- detector solid angle, (iii) For E
╬│
=0.662 MeV, the PtT ratios are scattered between 0.75 and 0.9, for E
╬│
=1.25 the range is 0.6ŌĆō0.65 and around 0.74 for E
╬│
=1.33 i.e. the ratios have values smaller than the values of 0.662 MeV and larger than the values of 1.25 MeV photons, this can be indicated as the inversion trend, IT. To interpret these results, the smallest solid angle and active volume in I, causes relatively small portion of the onefold Compton scattered quanta is absorbed in the material, subsequently more photon energies, by photo electric effect, can be absorbed in the detector, in agreement with [6]. This portion is larger in II and has largest value in III, therefore the Compton continuum is raised, and much energy is distributed over a wide region in the measured spectra. The intensity of the transmitted gamma photons throughout the spectrum depends differently upon E
╬│
, the material thickness t, the target atomic number Z and beam solid angle ╬®. Both the peak and its back ground are changed with respect to the Z
eff
. The build-up factor B, in this respect, expresses the combined changes. Similar behavior of B was found in Figure 2A, in the work of [15], where the energy absorption build-up factor was computed as function of the penetration depth for air and was compared with [16], standard data. It increases from about 1 at 0.015 MeV to about 104 at 0.15 MeV then decrease again to become 2├Ś102 at 1 MeV. The study of [17], is based on narrow beam geometry, the materials investigated are organic nonlinear optical of H, N, O and C atoms of low Z numbers. It is found that, the PtT plots at 0.662> at 1.33> at 1.25 which means that B is: At 0.662 MeV> at 1.33 MeV> at 1.25 MeV. The trend of decrease from 0.663 MeV to 1.25 MeV is inverted to increase from 1.25 MeV to 1.33 MeV, we indicate it the inversion trend, IT. In [8] it was found that B is proportional to the collimator diameter for some compounds. In [18] a parallel beam geometry was applied to measure (╬╝
/
Žü) for soil. The values reported are 0.08, 0.058, and 0.063 cm2┬ĘgŌłÆ1 at the ╬│-energies 0.662, 1.33, and 1.408 MeV respectively. The IT is quite clear at the energy 1.408 MeV, knowing that the errors given are from 0.4 to 3.1%. It would be of interest to declare the detailed dependence of IT on the experimental parameters. Figure 2B shows the PtT for the 0.662 MeV peak at the three arrangements. The PtT in Figure 2A and 2B disagree with [19] in which it was reported that the total-to-peak ratio is independent of the source position at energies higher than 200 keV. It should however be taken into account that in present study, the source is fixed, (see materials and methods).
Figure 3A shows PtV and PtC, as function of Z
eff
for 0.662 MeV photons (approximately equal ROI, s). Figure 3B compares the PtV as function of Z
eff
for 1.25 and 1.33 MeV photons at the three arrangements. Figure 3C compares between the PtC as function of Z
eff
for 1.25 and 1.33 MeV photons at the three arrangements. The ratios get smaller values gradually from the arrangements I to II to III. The PtV is relatively large and more spaced than the PtC since the heights of their regions are lower than the heights of the corresponding Compton plateaus. From 3A the PtV and PtC ratios are spaced while in the Figure 3B and 3C the PtV and PtC plots are quite nearer to each other. The ratios correspond to different scattering angles as given in Table 1, therefore this result indicates that the effect of B on the ratios is decremental for larger scattering angles. The IT extends to PtV and PtC regions where the ratios of 1.33 are larger than the ratios of 1.25 in the two Figure 3B and 3C. It is clearer in case of PtV than in PtC ratios. This result confirms Klein-Nishina formula, Equation 3. The differential scattering cross section from Klein-Nishina formula has maximum values in the forward scattering processes and decreases appreciably at larger scattering angles. This result also agrees with [12], where it was concluded that, with increase in the solid angle, the absorber thickness (Perspex and Bakelite) at which B begins to exceed unity decreases. According to the present results, it is expected that extension of [12], with a study at an energy about 1.4 MeV similar IT occurs, i.e. the absorber thickness indicated above tends to increase.
2. The peak ratios as function of energy
The dependence of the PtT ratios on E
╬│
for all attenuators at all arrangements on the gamma energy is shown in Figure 4A. Generally, the ratios at 1.33 MeV are larger than at 1.25 MeV. This trend was also obtained from comparing the PtT ratios for E
╬│
=1.173 and 1.33 MeV since the PtT ratios for E
╬│
=1.173 MeV were found to be smaller than the PtT ratios at E
╬│
=1.25 MeV. With increasing energy, besides the predominating Compton scattering mode the photo peak becomes faint and the pair production participates, with small contribution. The increase in the PtT, the IT discussed above, at 1.33 MeV is attributed to B, it affects the photo peaks and the Compton regions differently according to E
╬│
, Žü, Z
eff
besides ╬®. Variations hold for the photo peak region as well as the Compton continuum, for example at the arrangement II the number of counts per channel per second for water at E
╬│
=0.662, 1.25, and 1.33 MeV=30.3, 2.11, and 2.47 respectively, and =2.56 for E
╬│
=1.173 MeV. On the other hand, the corresponding total counts in the ROI (peak+back ground), are regular and have respectively the values 35.1, 3.3, and 3.11 and is equal to 4.3 for the peak 1.173 MeV. Comparison between the different arrangements and different ratios along with background for one of the materials, e. g. water is found in Figure 4B. Figure 4C displays PtT for cement and sand at the three arrangements. Besides the arraying mentioned above, at 0.662 MeV the spacings between the ratios increase from I to II to III which illustrates growing B effect in this order. This notation, on the other hand, becomes less observable at E
╬│
=1.25 and 1.33 MeV.
Figure 5A compares between the PtV and PtC for soil at II and III. The ratios at 1.33 MeV are not much larger than at 1.25 MeV. These can be aught to the intensities of the ROI,s for the valley and Compton plateau regions relative to the intensities of the ROI,s for the photo peak in II and III which are significantly larger than the corresponding values at I. (see Table 1 and eq. 4). Similar results have been achieved by [17], in which ╬╝
/
Žü at 0.2 MeV for organic nonlinear optical materials lei in larger range of values than at 1.4 MeV. The PtV and PtC are displayed at I for all materials and energies at Figure 5B, the values are in order and nearer to each other in the PtC results. Figure 5C shows (in ln scale) PtV for cement and sand. The ratios are one to one correspondence for the three arrangements. Figure 5D, shows the PtC for the conditions of Figure 5C. In the Figure 5 the IT exists and changes between faint and clear cases. This means that the IT is clear enough at PtT ratios (minimum scattering angle ╬Ė) and gradually becomes less detectable as ╬Ė increases, PtV and PtC ratios.
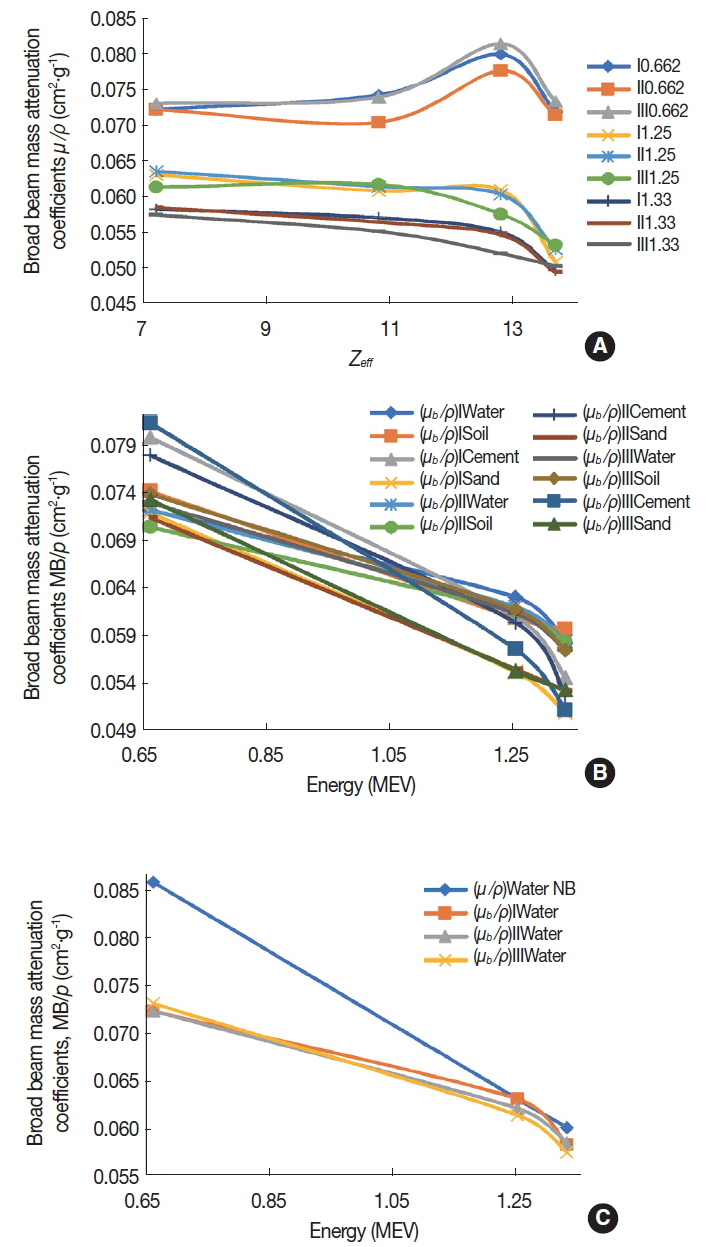
3. The mass attenuation coefficients
The broad beam mass attenuation coefficients ╬╝
b/
Žü are calculated from the photo peak areas without and with the materials for each measurement, the gamma build-up influences these values significantly. The attenuation by air column(s) in the source-detector space is considered as having the same effect in the three arrangements, and its values at E
╬│
=0.662, 1.25, and 1.33 MeV are obtained from [14]. The ╬╝
b/
Žü values of the attenuators as function of Z
eff
and energy are plotted respectively in Figure 6A and 6B. These values are characteristic for the present experimental set-up. The gamma build-up due to broad beam geometry led ╬╝
b/
Žü to have values smaller than the theoretical values. The theoretical value ╬╝
/
Žü for water at 0.662 MeV=0.0857 cm2┬ĘgŌłÆ1 [14], the present broad beam arrangements yield ╬╝
b/
Žü=0.0722ŌĆō0.0742 cm2. At the energy 1.33 MeV ╬╝
/
Žü for narrow beam geometry ╬╝
/
Žü=0.061 cm2┬ĘgŌłÆ1, while the result of the present study ╬╝
b/
Žü=0.0574ŌĆō0.0584 cm2┬ĘgŌłÆ1. It is clear enough that B is larger at the lower energy 0.662 than at 1.33 MeV, in accordance with [20], in which, a build-up correction factor a1 originated from [4], was reported to be proportional to the target density, and the attenuation coefficient and inversely proportional to photon energy. The observable regular change in the ╬╝
b/
Žü plots at the energies 0.662, 1.25 and 1.33 MeV, shown in Figure 6A and 6B, is strictly combined with this enhancing role of B. Figure 2 reveals that cement can be considered as best shielding material in comparison with water, soil and sand according to its ╬╝
b/
Žü value, cement on the other hand has the largest Z
eff
, see Table 2. This result is in line with [21], the material Ba(CO3)2 is reported as best shielding material among the four barium compounds BaCl2, Ba(NO3)2 and BaSO4. Additionally, Ba(CO3)2 was found to have the largest Z
eff
in the compounds. Similar comparisons can be dealt with for the other materials which produce more impressive effect for B according to the larger Z
eff
. The broad beam mass attenuation coefficients ╬╝
b/
Žü reflects, how does the material affect the spectrum of gamma rays passing through it. Figure 6C, compares between ╬╝
b/
Žü values as function of energy for water at the three arrangements with the theoretical values [14]. The large differences at 0.662 MeV indicate to maximum B, and on the other hand, minimum B at 1.33 MeV. The build-up factor B can be calculated using ╬╝
/
Žü and ╬╝
b/
Žü results. According to Equation 3, B for water at 0.662 MeV=1.0135. It is ~1.003 at 1.25 and 1.33 MeV.
The errors in ╬╝
b/
Žü have been calculated from the propagation of errors according to the relation given in [8],
where t is surface thickness g┬ĘcmŌłÆ2, I
0
and I are the number of counts without and with material [10]. The errors are less than 6%.
4. The full width at half maximum and the centroids
The full width at half maximum, FWHM and centroids of the photo peaks are almost the same at I and II. In III the space of gamma attenuator interaction is maximum, see Figure 1, causing peak broadening and the full width at half maxima have larger values. The resolution ranged between 7.34% and 7.57% E
╬│
0.662 MeV and between 5.25% and 5.57% for E
╬│
=1.33 MeV.
The data of the various variables, attenuators, arrangements, and ratios allow to illustrate much graphs, however what has been dealt with in this work is the illustration and discussion of corner stones.
Conclusions
Using broad beam geometries, the modifications of ╬│-ray spectra via transmission through matter are studied in view of the variations of the photo peak areas to well defined parts in the spectra. The ratios of the peak area to areas of: The peak plus its back ground, the Compton valley and the Compton plateau are measured and analyzed. The broad beam mass attenuation coefficients ╬╝
/
Žü are measured and compared with theoretical values. The peak ratios are inversely proportional to Z
eff
of the attenuator, the photon energy and the solid angle confining the source-material- detector. The peak to total ratios are the most sensitive parameter to experimental variations and the peak to valley ratios are more sensitive than peak to Compton ratios. The peak ratios of 1.33 MeV photons are less than the peak ratios of 0.662 photons and larger than the 1.25 MeV photons, this result is described as the inversion trend. The broad beam mass attenuation coefficients ╬╝
b
/
Žü have largest differences from theoretical values at 0.662 MeV. Maximum change in energy resolution and peak centroids are recorded at the arrangement of maximum solid angles. The results are explained according to the varying build-up in the transmitted ╬│-ray intensities originated from different experimental conditions. The increase in the Compton continuum is a result of the increasing solid angles. Moreover, the sensitive PtT ratios to variation in the experimental conditions is attributed to the large differential forward scattering cross sections found in Klein-Nishina formula. The build-up at 0.662 MeV > at 1.33 MeV and > at 1.25 MeV. The build-up factor B for water at 0.662 MeV=1.0135, and 1.003 at 1.25 and 1.33 MeV, for sand B is about 1.006 at the three energies. The present results provide information to decide for the suitable experimental set-up based on the aim of work, e. g. a set-up with small scattering angles and high ╬│-energies can be employed to measure ╬╝
/
Žü with good accuracy. On the other hand, for In-situ radiation measurements in the fields as health physics, mining, environmental research, etc. broad beam set-up is suggested.