

Introduction
Estimated lifetime risks of cancer mortality or incidence attributable to exposure to ionizing radiation have been repeatedly included in major reports of international committees including United Nations Scientific Committee on the Effects of Atomic Radiation (UNSCEAR) [1] and International Commission on Radiological Protection (ICRP) [2, 3]. These risk calculations mainly adopt risk models with parameters obtained by regression analyses of data from the Life Span Study (LSS) of the atomic bomb survivors in Hiroshima and Nagasaki [4] and the baseline reference data (hereinafter the baseline risk) for a population on cancer incidence or mortality and all-cause mortality. The risk model with estimated parameters from the LSS may be applied to the projection of cancer risks at low doses and low-dose rates, with an additional assumption about low-dose or low-dose-rate extrapolation.
Risk projections have been conducted for various purposes: risk projection for an actual population under specific scenarios of medical, occupational, and environmental exposures [5–7]; sensitivity analysis of risk estimates [8]; and development of methodologies of risk assessment [9]. On the other hand, calculational tools nowadays are publicly available; thus, one can assess outcomes calculated using given risk models, assumptions, and statistical data. For example, Radiation Risk Assessment Tool (RadRAT; National Institutes of Health) [10], developed by the National Cancer Institute (NCI) at the National Institutes of Health of the United States, is a web-based risk calculator for estimating the lifetime risk of cancer incidence for populations of selected countries including the United States and Japan as a result of exposure to ionizing radiation at doses below 1 Gy and is based on the risk models mainly developed in Biologic Effects of Ionizing Radiation (BEIR)-VII [11]. LARisk ( https://cran.r-project.org ) [12] is an R package (R Foundation for Statistical Computing) [13] for computing the risk using methods and models similar to those in RadRAT. Nevertheless, we emphasize that there is no open-source code applicable to risk calculations that can be directly traced with the calculation algorithm, model parameters, and numerical database.
Quantitative risk evaluations should accompany comprehensive assessments of sources of uncertainty involved in the evaluated risks (UNSCEAR 2019 report, Annex A [14]). The latest National Aeronautics and Space Administration (NASA) studies in space flight provided the overall uncertainty of risk projection in terms of fold factors and a range of projection risk values at 95% confidence interval (CI) levels [15]. The main sources of uncertainties in evaluated risks include statistical uncertainties of the parameter estimates in the risk models, the method of risk transfer applied to populations with different baselines, and the assumption of applying a dose and dose rate effectiveness factor (DDREF) when projecting an LSS risk model to low-dose or low-dose-rate exposure scenarios. The epidemiological data from the atomic bomb survivors is the primary data on which most of the current risk projections are based. The cohort follow-up study that began in the 1950s is still ongoing, and the current risk projection covered by an international organization is the incidence rate data reported in 2007 [4]. Either the excess absolute risk (EAR) or excess relative risk (ERR) model is commonly used with effect modifications by sex, age at exposure, and attained age [1, 2]. The calculated risk measures are expressed by lifetime cancer probability (death, incidence) and life expectancy loss [1]. The ICRP uses detriment as a risk indicator for defining tissue weighting factors [2, 3].
With this background in mind, the present study aims to provide a computational code for risk projection and make the code publicly available as a resource for further improvement of risk projection. The Japan Health Physics Society (JHPS) approved to set up a research group tasked with the development of an estimation code for cancer risk associated with radiation exposure. The research group has developed a computational code named SUMRAY to encourage quantitative discussion on cancer risk and its uncertainty following radiation exposure at low doses and low dose rates. To disseminate the code widely, SUMRAY is released in two popular computer languages, that is, R and Python. The R-version SUMRAY is given as an R package called in the user’s own R script to calculate the risk probability, and the Python version is dedicated to calculations without any code written by users using American Standard Code for Information Interchange (ASCII) input and output files.
The distribution of the code was also discussed, taking into account copyright, maintenance, and ease of dissemination and updating. It was decided that the code is to be distributed under the Massachusetts Institute of Technology license [16] through the GitHub website ( https://github.com/JapanHealthPhysicsSociety/SUMRAY) upon approval by the JHPS Board.
Materials and Methods
1. Overview
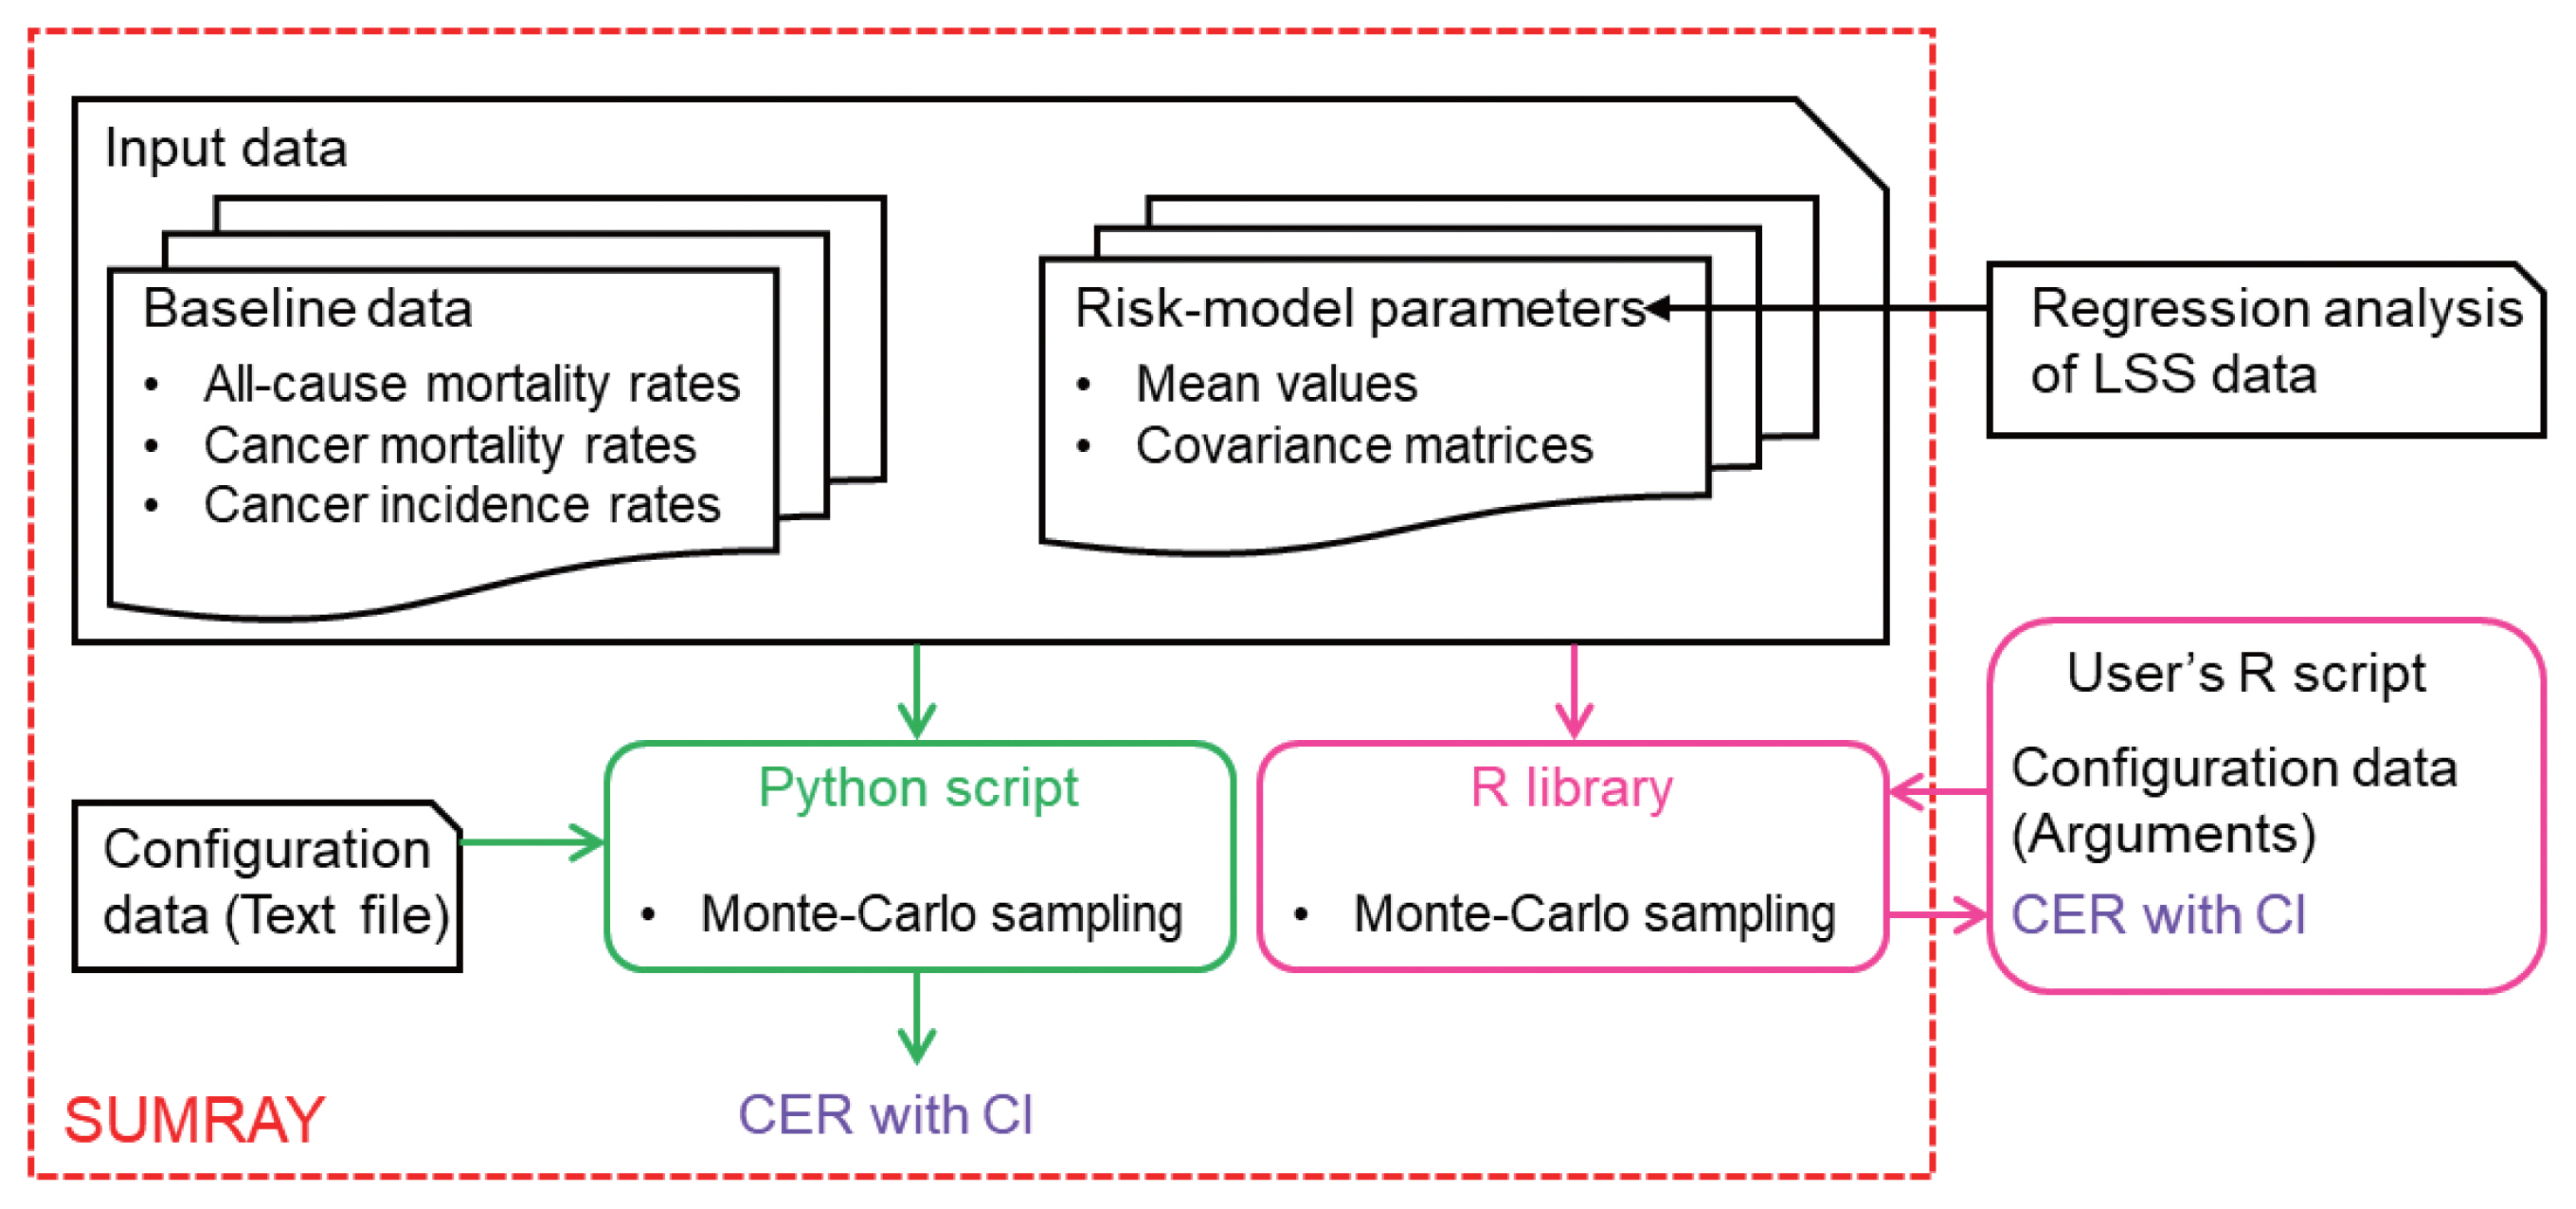
Fig. 1 illustrates an overview of the SUMRAY code system. The system calculates, as a primary risk measure, the cumulative excess risk (CER) of dying from or developing a specific cancer (specified by the risk model) as a result of a radiation exposure scenario (specified by the configuration data) in a population (specified by the baseline risk). The output from the system includes point estimates as well as interval estimates in terms of 95% CI. The details of input data, configuration data of an exposure scenario, and computational scheme are given in the following subsections. As we discuss the risk models included in the package in this article, the code to estimate a risk model is not included in the SUMRAY package.
In SUMRAY, a calculation part of CER with CI was developed using an R library and a Python script independently to meet the various demands of users in Supplementary Materials and Methods (Supplementary Table S1, Supplementary Figs. S1, S2) (‘1. Usage of the R library provided in SUMRAY’ and ‘2. Usage of the Python script provided in SUMRAY’). Both of them employed the same algorithm, but their styles are different. The R library in the SUMRAY package is called from the user’s own R script to calculate CER for an exposure scenario configured in that script. The Python script was designed for a stand-alone code for calculating CER in SUMRAY without any programming by users. The users can configure the exposure scenario via a text file, and obtain results as comma-separated values (.csv) files after running the Python script. The usage of the R library and the Python script is provided in the electronic supplements of this article.
Currently, mortality and incidence rates for all solid cancers as a group are targeted for risk projection without individual cancers. Our code can be extended through risk model development and its model fitting to the LSS data since it is desirable to address individual cancers. The risk prediction using the code can be made in cases of acute and chronic exposures without DDREF. The code can reflect the variances of the evaluated risk-model parameters on the risk predictions by a Monte Carlo sampling. The development of the computational code aims to clarify the process required for risk prediction of the cumulative probabilities of death and morbidity by sex and age. It should be noted; however, that the code may give a false sense of accuracy unless the quantitative uncertainties associated with the overall risk prediction are taken into account.
2. Baseline Risk
In SUMRAY, risk prediction is made based on the baseline risk of all-solid-cancer mortality and incidence rates λ0 for a target population. The baseline risk defines age-specific cancer mortality and incidence rates and age-specific all-cause mortality.
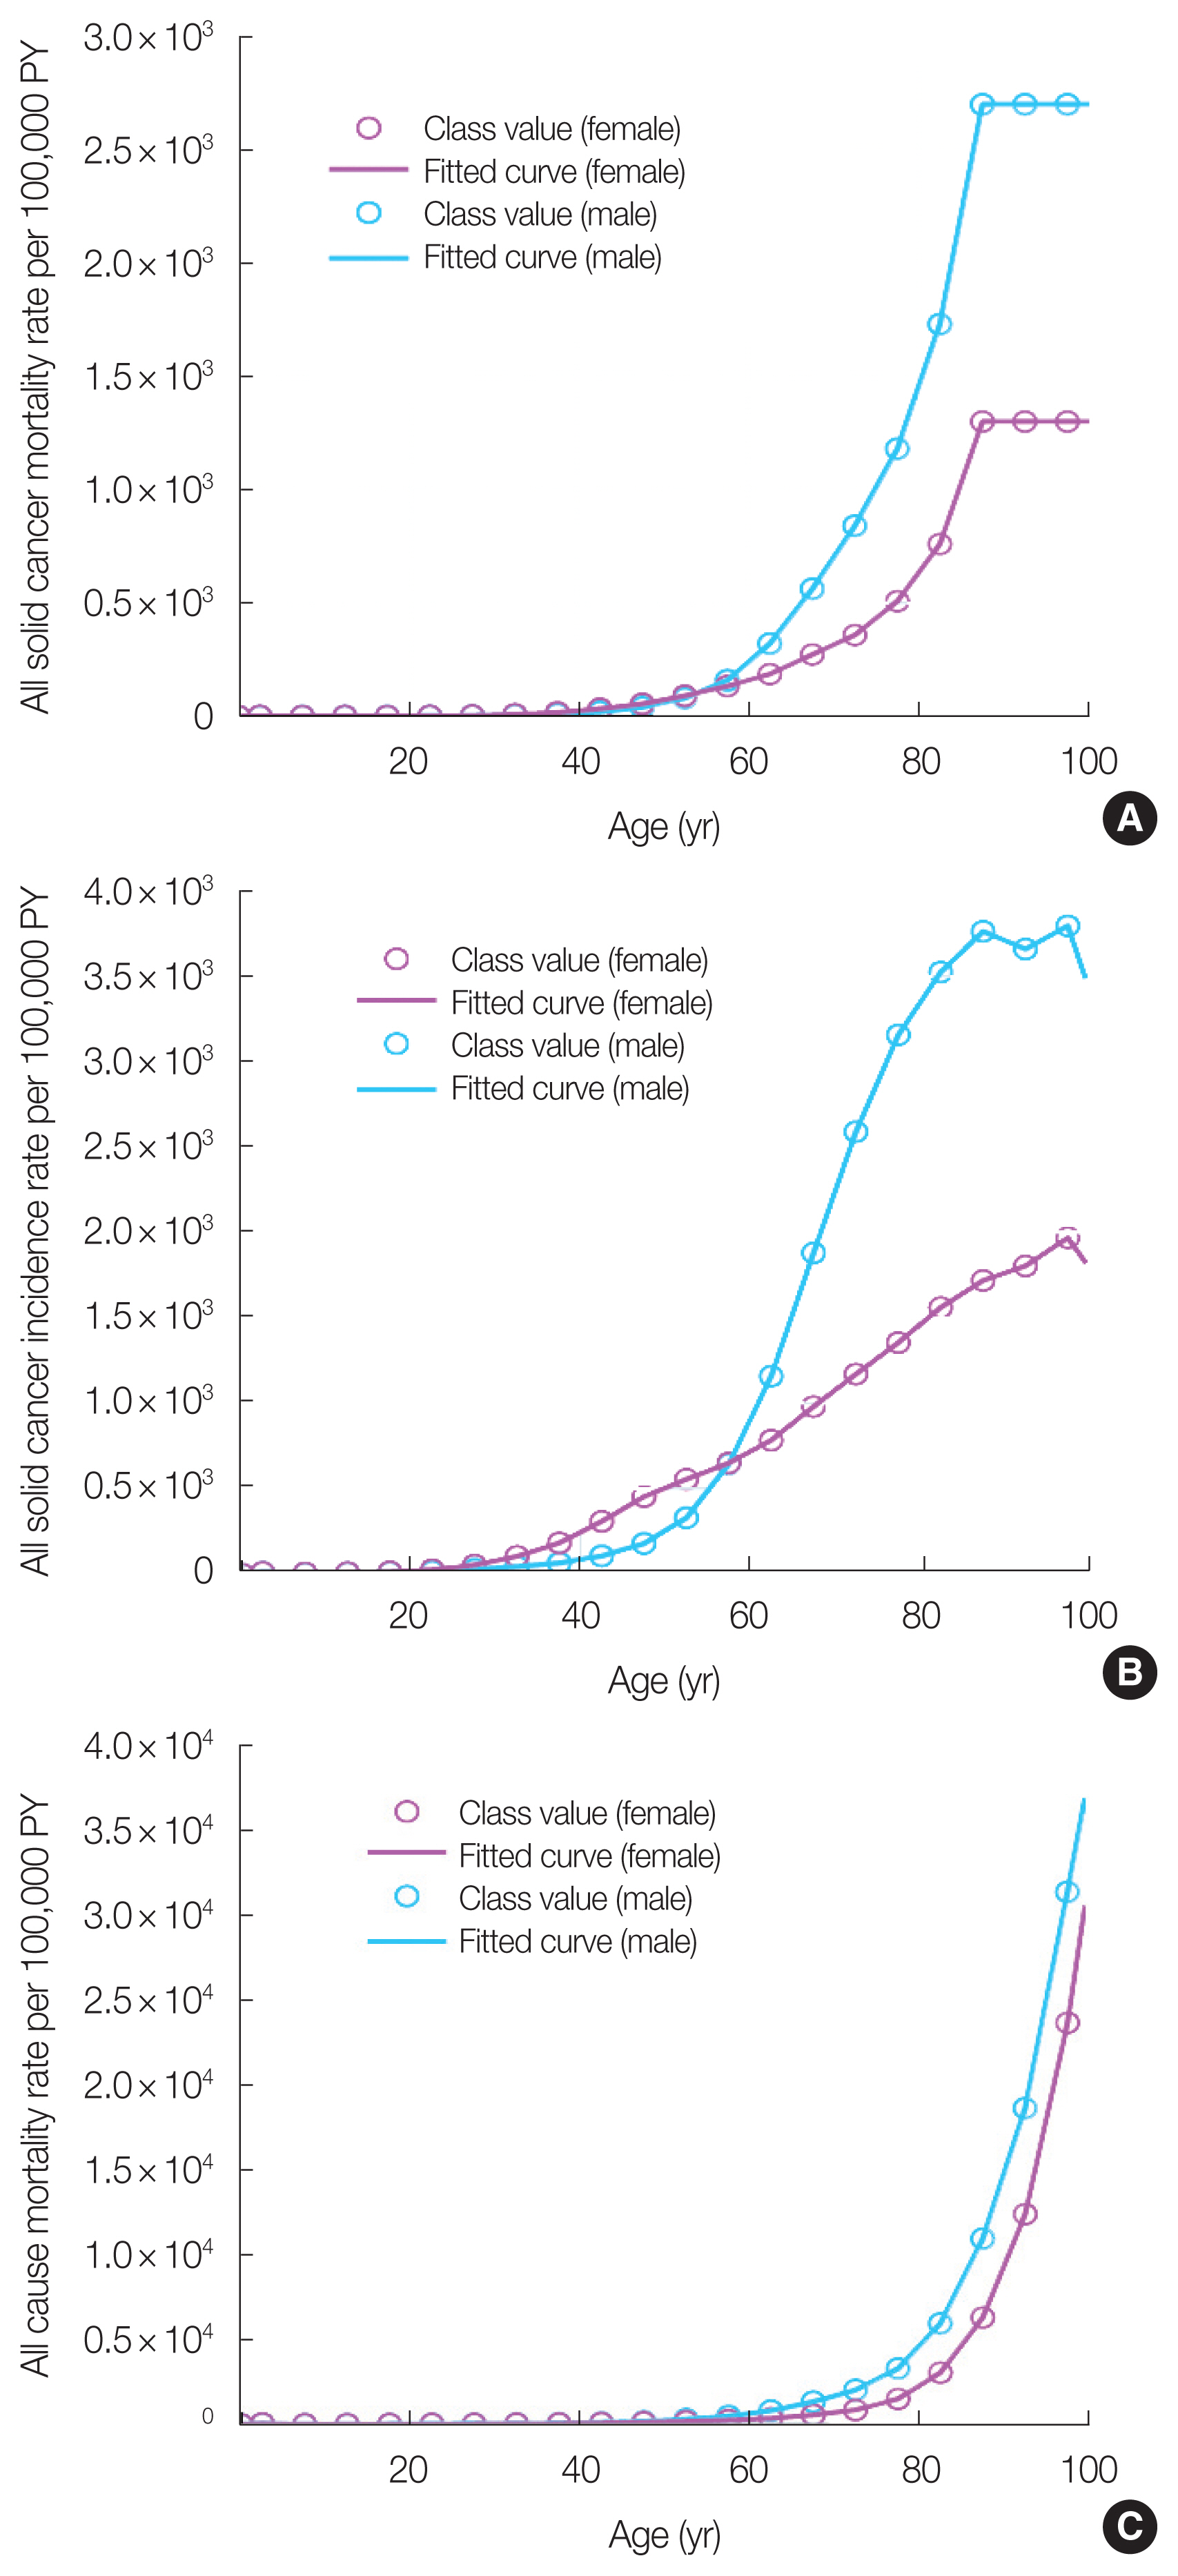
Default values for the baseline risks in SUMRAY were set to the risks of mortality and incidence from all solid cancers (International Statistical Classification of Diseases and Related Health Problems; International Classification of Diseases 10th Revision, category of cancer from C00 to C80) in the Japanese population in 2018 obtained from the National Cancer Center [17]. These baseline risks were converted to 1-year intervals from 5-year intervals by linear interpolation in SUMRAY. Fig. 2 shows the baseline risks of all-solid-cancer mortality and incidence rates λ0 for the Japanese population in 2018 with fitted curves. The default value of the survival function S for the target population is obtained from the Japanese statistical data for 2018 [18].
3. Equation
The radiation risk models in SUMRAY are the ERR and EAR models, which were created by fitting cancer mortality and incidence risk data from the LSS of atomic bomb survivors in Hiroshima and Nagasaki [4, 19]. The ERR and EAR models for all solid cancers derived from the LSS are used in the same equations in SUMRAY.
The variables of the ERR and EAR models are the absorbed dose d (Gy), age at exposure e, attained age a, and sex, where s=1 for males, and −1 for females. The parameters of each model are either the ERR estimate α (ERR/Gy) or the EAR estimate α (EAR per 10,000 person-years per Gy) and the effect modifiers of these risk estimates by sex ν, age at exposure γ, and attained age η. The variance-covariance matrices were set up for the parameter values (α, γ, η, ν) of the ERR and EAR models estimated from the published data of LSS using the generalized nonlinear model of the R library. The reason for estimating the variance-covariance matrices of the ERR/EAR models using the R library is that the previous research papers on the LSS [4, 19] only provide the CIs of the ERR/EAR models. In addition, in these previous studies on LSS, Epicure (Risk Science International, Inc.) [20], a commercial statistical software to fit the LSS data and obtain the numerical values of the variance-covariance matrix, was used. Therefore, the variance-covariance matrices of the ERR/EAR models in SUMRAY were estimated using the R library, which is free software. As the default values for the ERR/EAR models in SUMRAY, these parameters of cancer mortality were estimated from the latest LSS data [20] and cancer incidence data (1958 to 1998) [4].
The excess incidence and mortality risks of cancer associated with radiation exposure M were obtained using either the ERR or EAR model taking into account the baseline cancer incidence and mortality risks λ0 and the latent period of cancer FL which is the S-shape function [10]. Here, M(R) is calculated using the ERR model and M(A) is calculated using the EAR model.
or
SUMRAY calculates the cumulative excess cancer incidence or mortality risk, CER. For cancer incidence or mortality risk from age at exposure, e to attained age amax, CER is calculated using the following equation.
Here, the conditional survival function S(a|e,s) is the probability of surviving to age a, adjusted for survival with the condition that the probability equals one at the age at exposure (e) for the target population [19].
SUMRAY calculates CERs separately based on the ERR and EAR models and then combines these results using a weighted arithmetic mean from the following equation. Here, CER(R) is calculated from the ERR model and CER(A) is calculated from the EAR model.
where, w is the weight between the ERR and EAR transfer of risk. Expert choices for the possible weights are available in the code. The weights for estimating risk transfer to a population have been used in radiological protection [2]. Note that the values of DDREF are important in radiation risk assessment. However, SUMRAY does not consider DDREF explicitly. The determination of DDREF is a future issue.
SUMRAY can calculate the radiation risk from chronic and acute exposures. In the case of chronic exposure, we assume that the risk from the annual dose can be integrated over the duration of exposure. The excess cancer incidence and mortality rates after radiation exposure are calculated using the following equation,
where, dk is the absorbed dose at the kth exposure accumulated over 1 year from age (ek−1) to age ek. e:[e1...ek...emax] is a set of ages at exposure. de is a set of the absorbed doses at the set of ages at exposure e. With the above equation, M for chronic exposure with dose set de in ages e is calculated as a function of attained age a.
CER for chronic exposure is calculated by integrating M from the first exposure age e1 to the maximum attained age amax with the conditional survival function S(a|e1,s) using the following equation.
Note that the conditional survival function used to calculate CER is normalized by the age at first exposure (e1).
4. Monte Carlo Sampling
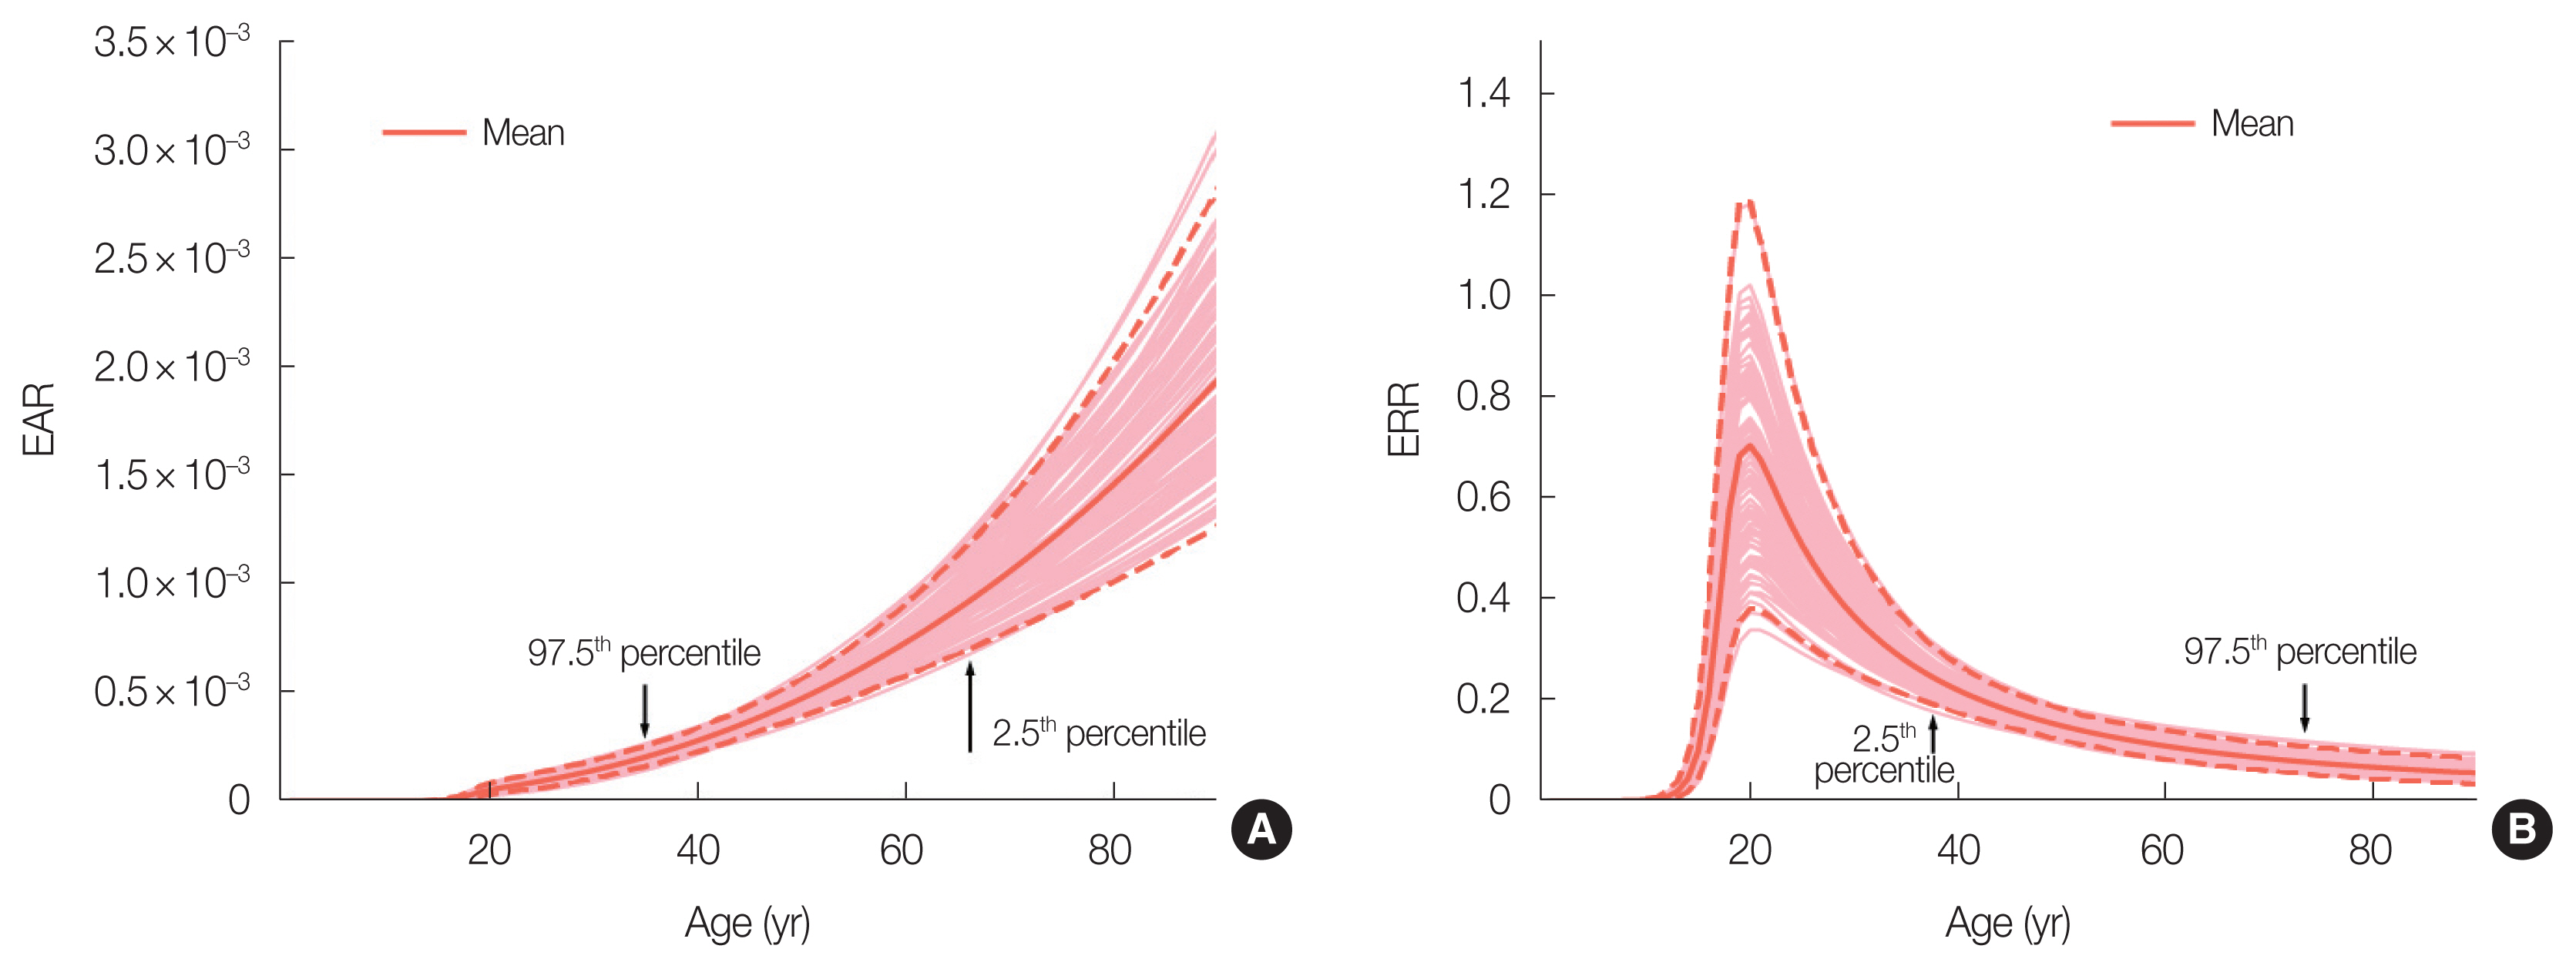
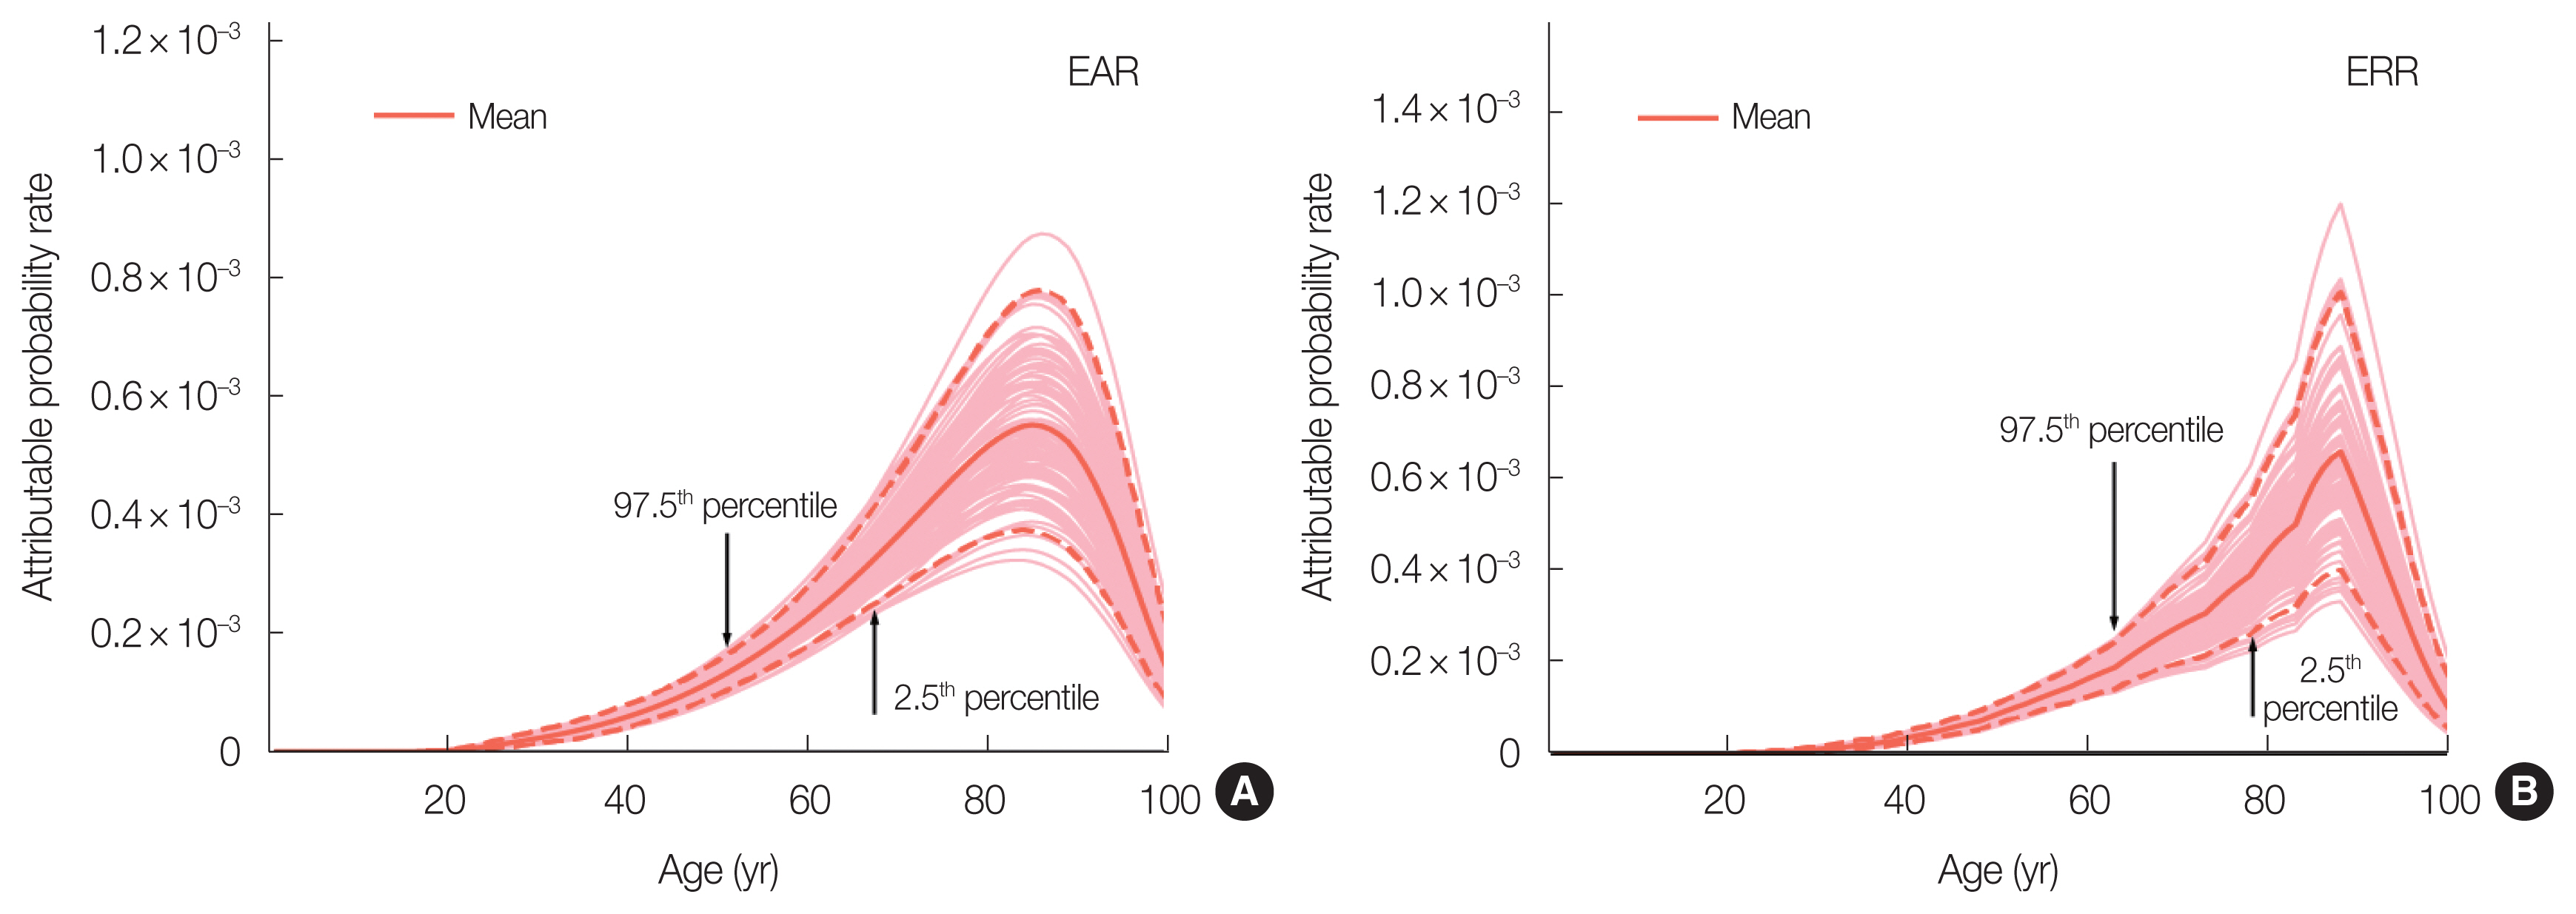
To calculate CER reflecting uncertainties of the estimated risk-model parameters, EAR and ERR given in Equations (2) and (3) were computed repeatedly using parameter values of (αi,γi,ηi,νi) at the i th Monte Carlo sampling. Fig. 3 shows examples of EAR and ERR curves calculated by the present Monte Carlo method. The values of (αi,γi,ηi,νi) were sampled from a multivariate normal distribution around mean values of (α,γ,η,ν) considering their variances and covariances matrix of the maximum likelihood estimates of the parameters of each ERR and EAR model. The size of Monte Carlo sampling is set to 104 as a default value. Using the simulated EARs and ERRs, CERs were calculated and their CIs were deduced statistically.
Results and Discussion
All results in this section were calculated with the default reference data provided in the SUMRAY package for the risk model (LSS R14 all-solid-cancer model), baseline risk (all-solid-cancer mortality rates in Japan 2018 [17]), and mortality data (all-cause mortality rates in Japan 2018 [18]). In addition, we employed the value of 7.5 years for the parameter of a latent-period in Equation (4).
1. Parameters of ERR/EAR Models
Table 1 shows the ERR and EAR parameter values and CIs used for these default values. Table 1 also shows the parameter values estimated using the Epicure software in previous studies [4, 19] to demonstrate the validity of the ERR/EAR parameter values estimated using the R code. Here, the CIs for mortality and incidence are shown as 95% and 90%, respectively, for comparison with those obtained in previous studies [4, 19] estimated using the Epicure software. The CIs for the ERR and EAR parameters are the uncertainties associated with nonlinear regression analysis. Table 1 shows that the parameter values and CIs estimated using the R code were not significantly different from those estimated using the Epicure software. Hence, the validity of the ERR and EAR parameter values estimated by the R code was confirmed by comparing them with those obtained in previous studies [4, 19].
2. Acute Exposure
The Supplementary Materials and Methods (3. Acute exposure) shows how to compute the cumulated excess risk for males exposed to 0.1 Gy at age 10 followed up until age 90 with ERR transfer using CER of the R library.
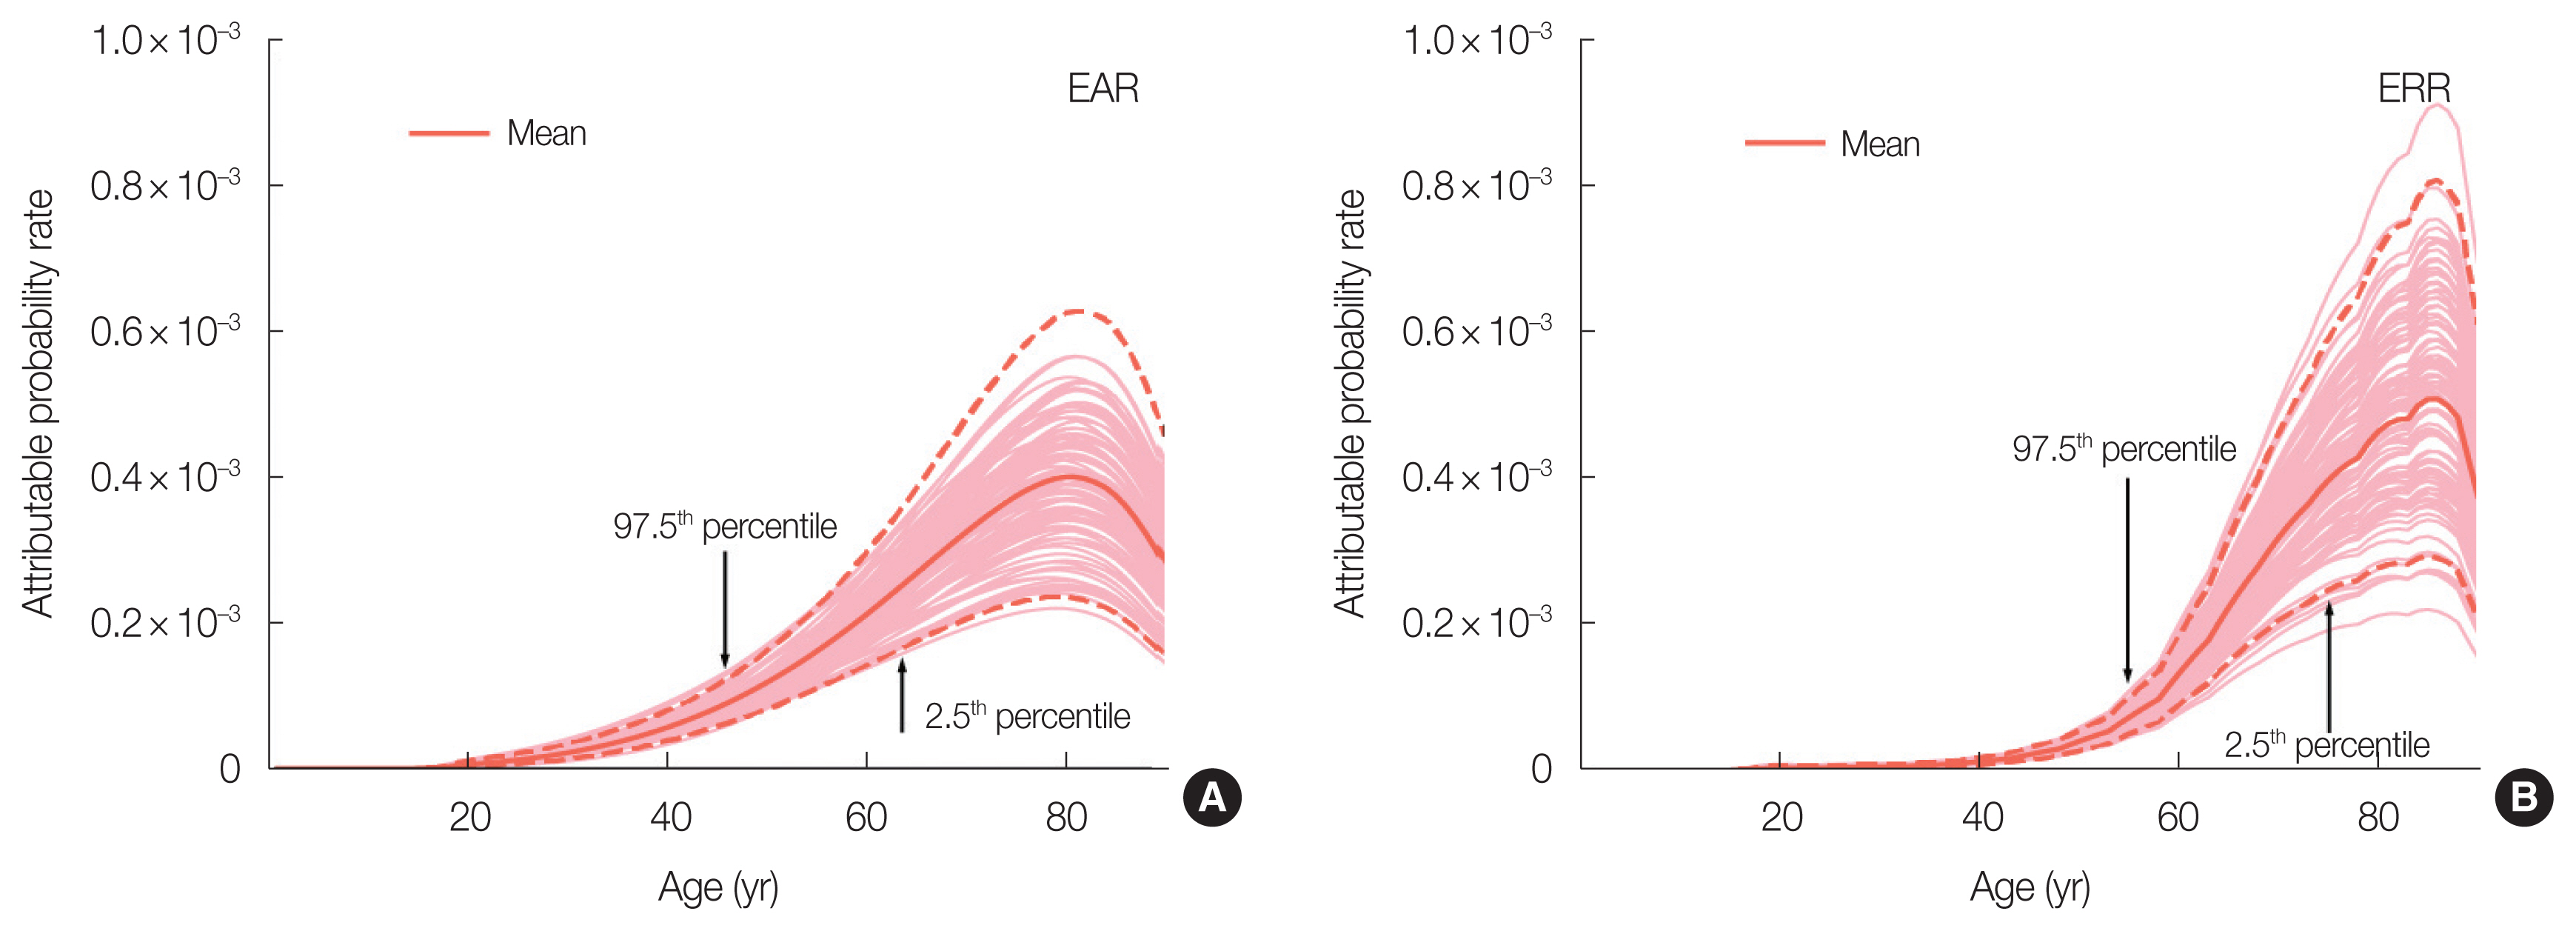
The mean, median, and CI of cumulated excess risk are shown after executing CER. The CI means a 95% CI between the upper and lower percentiles. The default of the weight is 1:0 for ERR and EAR transfers, and means that CER uses the result of only the ERR model. “maxage” indicates the final age at which a cumulative risk calculation is performed. This example shows a cumulative risk until the age of 90. In this example, the lifetime risk until the age of 90 indicates 1.2% (95% CI, 0.75% to 1.8%). The output using plotCER is shown in Fig. 4 to provide the attributable probability rate at an attained age. From the sum of these values, the cumulative risk can be calculated from the age at acute exposure to the age of 90. In the results obtained using the ERR model, there was an irregular variation of attributable probability rates between these ages following the linear interpolation. The absence of variation in the results obtained using the EAR model is due to the fact that the estimated excess risk is independent of the baseline risk.
3. Chronic Exposure
The Supplementary Materials and Methods (4. Chronic exposure) shows how to compute the cumulated excess risk for females exposed to 0.01 Gy/yr at ages 10 to 19 followed up until age 100 with 7:3 weights for ERR and EAR transfers. The results are similar to those for acute exposure. “agex” means the period of chronic exposure between the ages 10 to 19. “doseGy” means a total dose of 0.1 Gy with an annual dose of 0.01 Gy/yr for 10 years.
Fig. 5 shows the attributable probability rates of all-solid-cancer incidence at attained ages in the case of chronic exposure. There are marked differences between the EAR and ERR models.
4. Comparison of CER with Other Risk Calculators
The CERs of cancer incidence calculated with our R and Python codes were compared with those obtained using RadRAT version 4.2.1, which is available on the NCI website and allows web-based calculations. The CER of cancer mortality was also compared with the BEIR-VII estimates [11]. The results are shown in Tables 2, 3. CER was calculated as the cumulated probability until the age of 90, for which CER in our codes was used.
Exposure doses were set at 0.1 Gy for acute exposure at the age of 10 and at 0.01 Gy for chronic exposure for each age from 10 to 19. DDREF was not taken into account in either calculation. The CERs of cancer incidence calculated with our codes were comparable to those obtained using RadRAT, as shown in Table 2. In the comparison, however, one should note that there are many different methods and assumptions between our codes and RadRAT, and summation over all organs (oral cavity and pharynx, esophagus, stomach, colon, rectum, liver, gallbladder, pancreas, lung, prostate, bladder, kidney, nervous system, thyroid, and leukemia) at risk. The use of organ-specific ERR models in RadRAT would make a slight difference, although both codes used 2010 Japan population data for the cancer incidence baseline. In addition, RadRAT uses the DDREF for all chronic exposure and for acute exposure below 100 mGy using a log-normal distribution with a geometric mean of 1.5. These differences between both codes resulted in slight differences in the risk calculation as shown in the Table 2.
Table 3 provides the CERs of solid cancer mortalities between our codes and BEIR-VII. The CERs were obtained using BEIR-VII as the sum of site-specific CER estimates for the United States population. An assumption was made that the weights for ERR and EAR transfers were site-specific. CERs for the two methods showed close values in females, although there were some differences in males. It seemed that the difference of the cancer mortality baseline caused the difference of CER.
The CERs are calculated as a function of the excess risks and baseline risks of cancer mortality and incidence, as shown in Equation (5). The risk model was obtained by analyzing the LSS data in each site. The risk transfer model to other populations can depend on the baseline cancer mortality/incidence. The weights for ERR and EAR transfers are used for risk assessment of radiation protection issues. These assumptions should be noted when comparing CERs.
5. Other Considerations
The development of the codes provided an overall process of cancer risk calculation based on epidemiological data so that they output cumulative probabilities of excess mortality and incidence following acute or chronic exposure. However, estimating the risk of site-specific cancer will be the future issue for risk projection of the codes, although the codes will be able to be utilized for estimating site-specific cancer risk. Lifestyle modification of radiation-related risks, such as smoking history, would be future issues [21]. The overall uncertainty in the risk estimates includes DDREF and risk transfer from the atomic bomb survivors to other populations. Our codes treated risk transfer by considering the weights between ERR and EAR models. The values of DDREF can be treated with user input data. In addition, although exposure to neutrons is also considered in the dose assessment for atomic bomb survivors, gamma-ray is the main component of the individual radiation dose [22]. Therefore, it should be noted that SUMRAY can provide the risk projection for the whole-body external exposure to gamma-ray, but it does not fit for the risk estimates in the case of both external exposure to high linear energy transfer radiation like neutrons and internal exposure.
The risk calculation may give a false sense of accuracy unless the quantitative uncertainties associated with the overall risk prediction are taken into account. It is necessary to discuss which risk indicator is better than cumulative probability in terms of risk communication.
Conclusion
The JHPS research group has developed an open-source risk calculation code. The code evaluates the uncertainty of risk predictions taking into account statistical errors when the risk model is fitted to the atomic bomb survivor data and then provides estimates and 95% CIs for attained age and cumulative risk. A future work will extend the present code to allow for site-specific risk assessment.